
Abstract
Objective
Since fetal presentation is an essential factor for planning mode of delivery, the estimation of fetal presentation at delivery is important in prenatal management. This study aimed to clarify the transition of fetal presentation during pregnancy and to propose practical strategy to predict final fetal presentation.
Methods
During the period of 2 years, fetal presentations were analyzed using ultrasonography during the prenatal visits at and after 22 weeks of gestation in a single facility. The relationship between the transition of fetal presentation and final presentation at delivery was analyzed. Further, a prediction model was developed to predict the final fetal presentation at birth.
Results
Among 1737 singleton pregnancies with full-term delivery, non-cephalic delivery occurred in 76 pregnancies (4.4%). Non-cephalic presentation in later half of the gestational period was associated with low incidence of spontaneous cephalic version. Furthermore, we found that in 46% of women with a final non-cephalic delivery, the non-cephalic presentation continued during whole of the observational period without spontaneous cephalic version. Based on the analyzed data of this cohort, we show that in a group of women with non-cephalic presentation at 35/36 weeks, the best predictability for spontaneous cephalic version depended on whether the cephalic presentation was observed at least once at and after 30 weeks of gestation.
Conclusion
Our findings suggest that information on the changes in fetal presentation during gestation contributes to the prediction of the fetal presentation at delivery and planning mode of delivery.
Introduction
Non-cephalic presentation at birth comprises 3–4% of total pregnancies [Citation1]. Risk factors for non-cephalic presentation include uterine malformations (e.g. septate uterus), fibroids, placenta previa, congenital malformation in the fetus, and polyhydramnios. Since non-cephalic delivery occurs even without these established risk factors in many cases, the prediction of final fetal presentation is a challenging issue in obstetric practice.
The fetal presentation at term pregnancy is a major factor that determines the mode of delivery. Vaginal delivery for non-cephalic presentations (including breech, oblique, and transverse) has been associated with complications such as cord prolapse and fetal head entrapment, and could lead to poor prognosis of the neonates. Indeed, past reports have demonstrated significantly higher mortality and morbidity of neonates after vaginal delivery in breech presentation than those after elective cesarean section [Citation2,Citation3]. Therefore, in current obstetrics, elective cesarean section is the preferred mode of delivery in non-cephalic presentations. Furthermore, external cephalic version can be performed alternatively to avoid cesarean section under the non-cephalic indications [Citation4–6].
When non-cephalic presentation is observed in gestational stage at near-term, obstetricians must decide whether to expect spontaneous rotation to cephalic presentation as long as possible or to start prompt planning for medical intervention including cesarean section and external cephalic version (ECV). Therefore, it is highly important to make accurate predictions about the likelihood of spontaneous conversion to cephalic presentation. However, the optimal approach for the prediction has not yet been established.
Little is known about the transition patterns of fetal presentation during pregnancy [Citation1,Citation7,Citation8]. Some reports have revealed that non-cephalic ratio is relatively high until around 30 weeks of gestation (WG), and the chance of cephalic presentation increases progressively toward delivery [Citation7]. This phenomenon is commonly called the spontaneous cephalic version (SCV).
This study aimed to clarify the characteristics in the transition patterns of fetal presentation during pregnancy between the groups with cephalic and non-cephalic deliveries. We also sought to establish an approach to predict non-cephalic delivery from fetal presentation change over time during gestation. For this purpose, we conducted a retrospective analysis of the data on the fetal presentation cohort in a perinatal center hospital, where the fetal presentation was recorded by ultrasonographic findings at every prenatal visit from 24 WG until delivery.
Materials and methods
Collection of clinical data
This retrospective cohort study utilized clinical data from the University of Tokyo Hospital that serves as a core facility for perinatal care for a wide range of medical risks. The annual number of deliveries in our facility was 1004 and 1104 in 2015 and 2016, respectively. The medical records of all pregnant women who underwent perinatal care from 2015 to 2016 were assessed, and the data on the fetal presentation at prenatal visits at and beyond 22 WG and final presentation at birth were collected. Data on the background characteristics of pregnant women and the past history were also collected from the medical records.
Pregnancies with the following conditions were excluded from the analysis: preterm delivery, premature rupture of membrane in preterm period, multiple pregnancy, structural abnormality in the fetus and placental previa, and low-lying placenta requiring elective cesarean section. Pregnancies lacking the continuous prenatal records after 22 WG until delivery were also excluded.
Obstetrical management for non-cephalic pregnancies
Prenatal visits had been conducted according to the common protocol recommended by the Japanese Ministry of Health, Labor, and Welfare during the study period from 1 January 2015 to 31 December 2016 in outpatient obstetrics department. According to the protocol, the intervals of prenatal visits were every 4 weeks, 2 weeks, and 1 week for less than 22 WG, from 22 to 35 WG, and from 36 WG until delivery, respectively. At each visit, fetal presentation, fetal growth, and amniotic fluid volume were evaluated using the ultrasonography method by an obstetrician with a specialty certification by the Japanese society of Obstetrics and Gynecology. In Japan, it is common that pregnant women undergo ultrasound examination during each prenatal visit. Ultrasound examinations are provided for all pregnant women, regardless of their risk status. Blood pressure, urine protein and glucose levels, and general condition of the pregnant women are also assessed routinely at each prenatal visit.
Based on the fetal position at 36 WG, pregnant women were informed on the expected mode of delivery; for cephalic presentations, the mode of delivery was determined according to the common obstetric indications, while elective cesarean section was planned at 38 WG for non-cephalic presentations as a rule. In cases of spontaneous transition of non-cephalic-to-cephalic presentations until the day of cesarean section, vaginal deliveries were performed if no special reason necessitated cesarean section. Vaginal delivery for breech presentation was allowed only for multiparous with appropriate informed consent, with scheduled induction of labor at 38 WG. ECV was not attempted during the study period.
Statistical analysis
Based on the final fetal presentation at delivery, for the retrospective analysis, the study population was divided into the cephalic and non-cephalic groups. Further, the study population was divided into groups (for the prospective analysis to predict final fetal presentation) based on the information of the fetal presentation at a particular gestational week or at a certain period of time during pregnancy. In some analyses, the groups were further subcategorized depending on their parity. Categorical variables were analyzed using the Chi-squared (if all the values were larger than 10) or Fisher’s exact tests. In the analysis to reveal the difference of two groups, the t-test and Mann-Whitney U test were performed for parametric and non-parametric data, respectively. Trend data were evaluated using the Cochran-Armitage trend test. To perform statistical analyses, scikit-learn (version 0.23) based on Python (version 3.6.8) was used.
Results
Clinical characteristics of the study cohort
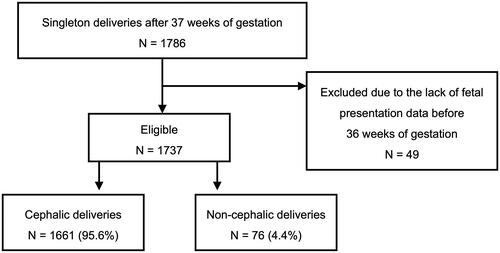
A total of 1786 pregnant women with singleton deliveries at 37 WG or later (8267 prenatal visits) were included in this study; 49 women who were transferred to the hospital after 37 WG were excluded because the data on fetal presentation before 36 WG were lacking (). Consequently, the clinical data of 1737 women with 8244 perinatal visits were analyzed. Moreover, 76 (4.4%) and 1661 (95.6%) women had non-cephalic and cephalic deliveries, respectively (). Further, 5.5% and 3.3% non-cephalic deliveries were conducted in the primiparous and multiparous women, respectively, with no statistical significance (p = .128).
Figure 1. The selection of the cohort introduced into analysis. The procedure for inclusion and exclusion of study subjects were shown in a flow chart.
The clinical characteristics and delivery outcomes of the two groups (cephalic and non-cephalic deliveries) are summarized in . No significant differences were observed between the two groups in terms of parity, maternal BMI, and frequency of placenta previa. In contrast, the maternal age at delivery (36.0 ± 4.1 years vs 35.0 ± 4.7 years, p = .045) and percent of women with uterine malformation (5.3% vs 0.8%, respectively, p = .006) were significantly higher in the non-cephalic group than that in the cephalic group. Most women (97.4%) in the non-cephalic group underwent cesarean delivery, while 25.8% had cesarean section in the cephalic group. Furthermore, the gestational age at delivery was significantly earlier in the non-cephalic group than in the cephalic group (38.0 ± 0.5 weeks vs 39.3 ± 1.2 weeks, p < .001). This difference was attributable to the managing policy of the hospital where elective cesarean sections were conducted for non-cephalic presentation at 38 WG. Resultantly, birth weight was also significantly lower in the non-cephalic group than in the cephalic group (2868 ± 325 g vs 3061 ± 389 g, p < .001)
Table 1. Clinical characteristics.
Frequency of non-cephalic presentation at different gestational weeks and the incidence of SCV until delivery
Based on the ultrasonography results of prenatal visits, the percentage of women that showed non-cephalic presentation decreased significantly with the progress of gestation (Cochran-Armitage trend test, p < .001), and this tendency was shared by both primiparous and multiparous groups (Supplementary Table 1 and Supplementary Figure 1, upper chart). We also determined the percentage of women that showed non-cephalic presentations at different gestational weeks but eventually ended up with cephalic delivery (SCV).
The incidence of SCV was around 90% up to 27 and 29 WG in the primiparous and multiparous groups, respectively; however, in the following period of gestation, the chances of SCV decreased progressively. This trend was statistically significant and was shared by both primiparous and the multiparous groups (Cochran-Armitage trend test, p < .001) (Supplementary Table 1 and Supplementary Figure 1, lower chart).
Frequency of cephalic presentation at different gestational weeks and the incidence of spontaneous version to non-cephalic (SVNC) until delivery
The percentage of women showing cephalic presentation at 23–27 WG and eventually undergoing SVNC delivery was 4% (2.6–5.8%) in both primiparous and multiparous groups; however, it decreased to 1% or less at the period later than 30 WG.
Prediction of SCV in women showing non-cephalic presentation at 35 to 36 WG
When non-cephalic presentations are confirmed during the near-term period of 35/36 WG, a precise prediction of SCV likelihood until birth is highly important for the proper delivery planning. In this study, we found that among 89 women who showed non-cephalic presentation at 35 or 36 WG, SCV until delivery occurred in 23 (25.8%). Furthermore, among the total women ending in non-cephalic delivery (n = 76) in this study, cephalic presentation was never observed in nearly half of these women (46%, n = 35). Based on this observation, we explored a prediction approach based on a rationale that the presence of cephalic presentation in preceding gestational period may be an indicative of SCV before delivery. Here, we divided women who showed non-cephalic presentation at 35/36 WG into two subgroups based on whether the cephalic presentation was either confirmed at least once during the gestational period from “X” WG until 35/36 WG (“positive”) or never observed (“negative”). Further, depending on the final presentation at delivery, the women in each subgroup were further assigned to either “true” or “false” fractions (see for details). Using this model, the highest odds of SCV (4.66, 95% confidence interval [CI]: 1.53–14.24) with 39.1% and 87.9% of sensitivity and specificity, respectively, were associated with the setting of 30 WG for “X” ( and ).
Figure 2. Illustration of the definitions of the terms used in making of prediction model.
Focusing on the group showing non-cephalic presentation at 35/36 weeks of gestation (N = 89), we determined the optimal model for prediction of fetal presentation at delivery. In the statistical analysis (shown in Table 4), the terms of “positive” and “negative” were used, respectively, to mean the presence and the absence of cephalic observation at least once at and after a certain gestational week. The term, “true” was given to the two types of subsets, one in which cephalic delivery occurred after cephalic presentation observed at and after a certain gestational week and the other in which non-cephalic delivery occurred without cephalic observation during the same period. The term, “false” was used for the subsets that did not fit the conditions of true subsets.
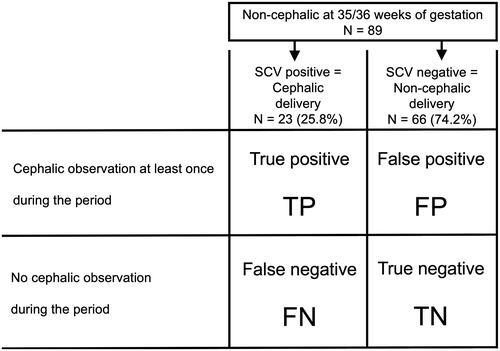
Figure 3. Sensitivity and specificity in the prediction models under different settings of data collection period.
The optimal model for prediction of non-cephalic delivery was explored focusing on the women in whom the fetus was non-cephalic at 35/36 WG. In the process, “cephalic observation at least once at and after a certain gestational week” was used a key parameter for prediction. The statistical analysis was conducted with different settings, in which the timing of gestational week to start collecting the data on fetal presentation was changed from 26 WG to 34 WG. Sensitivity and specificity in each setting is shown on the plot.
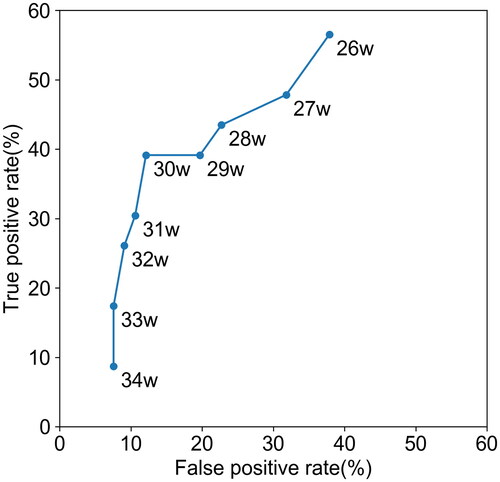
Table 2. Prediction models for final fetal presentation among women showing non-cephalic presentation at 35 or 36 WG.
Discussion
Implications
The strength of this study lies in its longitudinal rather than cross-sectional observation of changes in the fetal position. A cross-sectional study [Citation7] previously reported that the incidence of SCV until delivery was 57% and 25% among the groups with breech presentation at 32 and 36 WG, respectively. Longitudinal analysis in the present study provided more detailed information on the frequency of SCV during the period at 22 WG and later. SCV until delivery occurred in more than 80% of women at 28 WG and earlier and was still more than 60% than that of the non-cephalic cases at 32 WG. However, this frequency rapidly decreased later than 32 WG (Supplementary Table 1 and Supplementary Figure 1). On the other hand, the rates of SVNC at 27 WG and earlier were identical to the rate of non-cephalic delivery in this cohort (Supplementary Table 2). These results suggest that the stabilization of fetal presentation starts from 27 to 32 WG. Further, the proportional shift between pelvic cavity and infant head size, and the changes in amniotic fluid volume depending on gestational period might be involved in the facilitation of fixing fetal position.
This study confirmed that the non-cephalic presentation continued constantly at the prenatal visits later than 22 WG without a single observation of cephalic presentation in about a half of the women (46%) ending in non-cephalic delivery. Although the frequency of SCV among the whole cohort in this study was high (beyond 60%) until 32 WG, reduction in SCV chances were observed in group of women with non-cephalic delivery. Several risk factors associated with non-cephalic delivery have been described in the past studies [Citation9–12], including older age, primipara pregnancy, abnormal placentation, oligohydramnios, uterine malformations, and uterine fibroids. We also found that the uterine malformation was more frequent in the non-cephalic delivery group than in the cephalic delivery group (). Although it is possible that these known factors, at least partially, affected the SCV chances among women with non-cephalic delivery, the pregnant women with uterine malformations occupied only less than 10% of the group with non-cephalic delivery, and hence, unknown factor(s) may also be involved that inhibits SCV, leading to non-cephalic delivery.
This study showed that the incidence of non-cephalic delivery was less frequent (not statistically significant [p = .10]) in the multiparous group than in the primiparous group (3.3% vs 5.0%). This result supports a previous report where parity was identified as a factor associated independently with breech presentation [Citation11]. In the analysis for the percentage of SCV until delivery among the groups showing non-cephalic presentation at different gestational weeks, the frequency of SCV was higher in the multiparous group at most of the gestational weeks than in the nulliparous group (Supplementary Figure 1). On the other hand, the frequency of non-cephalic presentation was comparable or higher in the multiparous group than in the primiparous. From these observations, it is estimated that a smaller frequency of non-cephalic delivery among the multiparous women is attributable to larger SCV chances during gestation.
This study demonstrated that a prediction model based on an observation of cephalic presentation at least once at 30 WG and later is the best in terms of sensitivity and specificity. Regarding the underlying data used to create this model, SCV is expected to occur in 53% of women with non-cephalic fetus at 36/37 WG, if cephalic presentation was observed at least once at 30 WG and later. In contrast, the possibility of SCV was 19% in women in whom cephalic presentation had never been observed during the same period. Lauterbach et al. reported a lower success rate in persistent breech presentation before ECV attempts [Citation13]. Their study showed that SCV was observed with lower frequency when the non-cephalic presentation was sustained. In conditions where non-cephalic presentation continues, it is possible there are potential factors that inhibit both ECV and SCV.
Currently, cesarean section is the most standard option for delivery mode planned for breech presentation at term pregnancy. It is important in prenatal management to make a plan for delivery mode and give an appropriate counseling to pregnant women. With the finding from the present study, it seems the planning and counseling for delivery mode should not be given too early, especially earlier than 34 WG. The probability of SCV until delivery is still around 40% at 34 WG in both the primiparous and the multiparous. When non-cephalic presentation is confirmed in a prenatal visit at 30 WG and later, repeated checkup of fetal presentation in the following period would be useful for better planning of delivery mode. Early intervention is important in non-cephalic cases due to the risk of cord prolapse during expectant management. If non-cephalic presentation continues until 35/36 WG, early cesarean or ECV interventions can be favorable approaches instead of expectant management.
ECV is a potent option to avoid a risk of neonatal morbidity related to a trial of vaginal delivery for breech presentation, but the optimal timing of performing ECV is under debate. In a retrospective study on ECV [Citation14], SCV occurred in 6.6% of the women with non-cephalic fetus even after failure of ECV conducted at term pregnancy. Uniform consensus on the implementation of ECV as a default procedure for term breech is not yet achieved because ECV can be a painful experience [Citation15] for women, with a success rate of 60–70% and a small risk of stillbirth and placental abruption [Citation5]. Hence, the identification of the women with poor SCV likelihood and implementation of ECV at best timing are key to the optimization of medical practice. Our data on SCV chances until delivery would contribute to such better practices of ECV.
Strengths and limitations
The main strength of this study is its longitudinal design that has allowed investigating the fetal presentation at various time points during the gestation period, and hence, this study could present a clearer picture on changes in fetal presentations, SCV chances, and establish a predictive model that might be beneficial in better planning the delivery mode.
This study has some limitations. First, this was a single-center, retrospective study, and further prospective validation studies are required to verify the findings presented in this study and their applicability for general practice of obstetrics. Second, at our institution, we performed cesarean sections at 38 WG for cases of non-cephalic presentation, therefore, it is possible that further SCVs would have been observed had we continued observation for a longer period of time. Third, the prediction model did not include clinical information on known factors related to the incidence of non-cephalic presentation, such as placental location, uterine position before pregnancy (anteverted or retroverted uterus), amniotic fluid volume, uterine anomalies, and uterine fibroids.
Conclusion
In this study, we clarified the trend of fetal presentation observed at different periods of gestation. The changing pattern of fetal presentation was demonstrated distinctively between groups with cephalic and non-cephalic delivery. Our findings suggest that the information on the changes in fetal presentation during gestation, especially after 30 WG, contributes to the prediction of the fetal presentation at delivery and the planning for delivery mode.
Ethical approval
This study was approved by the research ethics committee of the Faculty of Medicine, University of Tokyo (Approval number: 3053).
Supplemental Material
Download PNG Image (204 KB)
Disclosure statement
No potential conflict of interest was reported by the author(s).
References
- Hickok DE, Gordon DC, Milberg JA, et al. The frequency of breech presentation by gestational age at birth: a large population-based study. Am J Obstet Gynecol. 1992;166(3):851–852.
- Hannah ME, Hannah WJ, Hewson SA, et al. Planned caesarean section versus planned vaginal birth for breech presentation at term: a randomised multicentre trial. Term Breech Trial Collaborative Group. Lancet (London, England). 2000;356(9239):1375–1383.
- Hofmeyr GJ, Kulier R, West HM. External cephalic version for breech presentation at term. Cochrane Database Syst Rev. 2015;2015:CD000083.
- Hutton EK, Hannah ME, Ross SJ, et al. The early External Cephalic Version (ECV) 2 trial: an international multicentre randomised controlled trial of timing of ECV for breech pregnancies. BJOG. 2011;118(5):564–577.
- Grootscholten K, Kok M, Oei SG, et al. External cephalic version-related risks: a meta-analysis. Obstet Gynecol. 2008;112(5):1143–1151.
- Ben-Meir A, Erez Y, Sela HY, et al. Prognostic parameters for successful external cephalic version. J Matern Fetal Neonatal Med. 2008;21(9):660–662.
- Westgren M, Edvall H, Nordstrom L, et al. Spontaneous cephalic version of breech presentation in the last trimester. Br J Obstet Gynaecol. 1985;92(1):19–22.
- De Castro H, Ciobanu A, Formuso C, et al. Value of routine ultrasound examination at 35-37 WG in diagnosis of non-cephalic presentation. Ultrasound Obstet Gynecol. 2020;55(2):248–256.
- Acien P. Reproductive performance of women with uterine malformations. Hum Reprod. 1993;8:122–126.
- Sekulic S, Ilincic M, Radeka G, et al. Breech presentation and the cornual-fundal location of the placenta. Croat Med J. 2013;54(2):198–202.
- Toijonen AE, Heinonen ST, Gissler MVM, et al. A comparison of risk factors for breech presentation in preterm and term labor: a nationwide, population-based case-control study. Arch Gynecol Obstet. 2020;301(2):393–403.
- Zhao R, Wang X, Zou L, et al. Adverse obstetric outcomes in pregnant women with uterine fibroids in China: a multicenter survey involving 112,403 deliveries. PLoS One. 2017;12(11):e0187821.
- Lauterbach R, Bachar G, Ben-David C, et al. Association of persistent breech presentation with external cephalic version success. Obstet Gynecol. 2021;137(2):258–262.
- Ben-Meir A, Elram T, Tsafrir A, et al. The incidence of spontaneous version after failed external cephalic version. Am J Obstet Gynecol. 2007;196(2):157.e1–157.e3.
- Watts NP, Petrovska K, Bisits A, et al. This baby is not for turning: Women’s experiences of attempted external cephalic version. BMC Pregnancy Childbirth. 2016;16:248.