
Abstract
Objective
To evaluate the changes of fetal epicardial fat thickness (EFT) in pregnancies with pregestational diabetes mellitus (PGDM) and gestational diabetes mellitus (GDM) and to identify the diagnostic effectiveness of fetal EFT in differentiating PGDM and GDM from normal pregnancies.
Methods
The study was conducted with pregnant women who admitted to perinatology department between October 2020 and August 2021. Patients were grouped as PGDM (n = 110), GDM (n = 110), and control (n = 110) for comparison of fetal EFT. EFT was measured in all three groups at 29 weeks of gestation. Demographic characteristics and ultrasonographic findings were recorded and compared.
Results
The mean fetal EFT was significantly higher in PGDM (1.47 ± 0.083 mm, p < .001) and GDM (1.40 ± 0.082 mm, p < .001) groups compared to control group (1.19 ± 0.049 mm) and was also significantly higher in PGDM group than GDM group (p < .001). Fetal EFT was significantly positively correlated with maternal age, fasting, 1st hour, 2nd hour glucose values, HbA1c, fetal abdominal circumference, and deepest vertical pocket of amniotic fluid (p < .001). Fetal EFT value of 1.3 mm diagnosed PGDM patients with a sensitivity of 97.3% and a specificity of 98.2%. Fetal EFT value of 1.27 mm diagnosed GDM patients with a sensitivity of 94% and a specificity of 95%.
Conclusions
Fetal EFT is greater in pregnancies with diabetes than in normal pregnancies, and also greater in PGDM than in GDM. In addition, fetal EFT is strongly correlated with maternal blood glucose levels in diabetic pregnancies.
Introduction
The most common metabolic disorder in pregnancy is hyperglycemia resulting from impaired blood glucose tolerance which is defined as either pregestational diabetes mellitus (PGDM) or gestational diabetes mellitus (GDM) [Citation1]. Diabetes in pregnancy may cause many adverse perinatal outcomes including fetal macrosomia, stillbirth, neonatal hypoglycemia, preeclampsia, and birth trauma [Citation2,Citation3]. The incidence of diabetes in pregnancy varies substantially across countries, ranging between 0.9% and 5.7% for PGDM and 1.8% and 25.4% for GDM [Citation4,Citation5]. Both type 2 PGDM and GDM could be diagnosed by various screening methods including fasting plasma glucose (FPG), HbA1c, and oral glucose tolerance test (OGTT), but which one of them is the most successful for the diagnosis is still controversial.
Epicardial fat tissue is located between the visceral pericardium and myocardium and is usually distributed adjacent to the right ventricle [Citation6,Citation7]. Proinflammatory vasoactive peptides, tumor necrosis factor-α, interleukin-6, and anti-inflammatory substances (adiponectin, omentin, adrenomedullin) are released from epicardial fat tissue [Citation8,Citation9]. Furthermore, epicardial fat tissue contributes to myocardial energy production [Citation6]. In recent years, measurement of epicardial fat thickness (EFT) in adults has been frequently used to detect insulin resistance [Citation10]. It has been shown that there is a correlation between EFT and cholesterol, adiponectin, and diastolic blood pressure [Citation11]. Since EFT is not affected by changes in skin and muscle tissue, it is thought to be more reliable than some other measurements such as abdominal circumference (AC) [Citation12]. However, conditions related to EFT are not clearly demonstrated in antenatal life as in non-pregnant adults. It has been proposed that increase in maternal EFT in pregnant women might be related to preeclampsia and vascular complications [Citation13,Citation14].
Limited studies in the literature have shown that fetal EFT is higher in pregnant women with diabetes [Citation15–18]. However, in these studies, the comparison of fetal EFT was conducted only in pregnancies with PGDM or GDM. Due to the methodology of previous studies, it could not be clarified whether there is a difference for fetal EFT values between pregnancies with PGDM and GDM. Therefore, the aim of this study is to identify whether fetal EFT differs in pregnant women with PGDM and GDM and also to correlate fetal EFT values with demographic parameters of diabetic pregnancies.
Materials and methods
The study was planned as a prospective cohort and performed among patients who applied to the Perinatology Department of Izmir Tepecik Training and Research Hospital between October 2020 and August 2021. A detailed consent form was obtained from all pregnant women participating in the study. The minimal number of patients to be included in the study was calculated using the G-power® program (effect size d: 0.5, α error probe: 0.03, power (1 – β err probe): 0.97, allocation ratio N2/N1:1) [Citation19]. Using the formula above, a minimum of 110 patients from each group would be required to be included in the study. The study was carried out in accordance with the conditions specified in the Declaration of Helsinki.
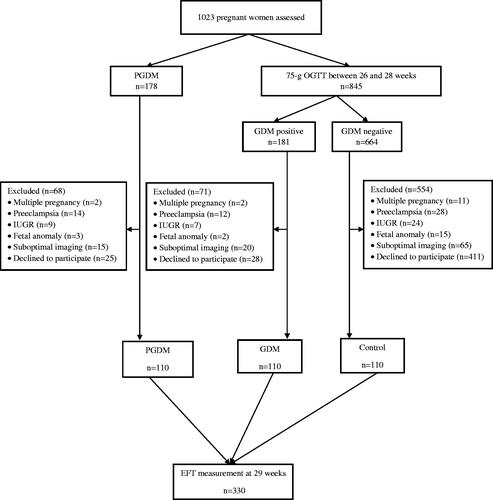
The aim of our study was to evaluate and compare the effects of maternal PGDM and GDM on EFT by ultrasonography. Therefore, we needed a group with PGDM, a group with GDM and a control group (without PGDM or GDM) to compare measurements in fetuses of the same gestational age. After the identification of patients with PGDM at first trimester of pregnancy, we performed GDM screening in order to determine the GDM and control groups. All patients without a previous diagnosis of PGDM underwent 75-g OGTT between 26 and 28 weeks of gestation. In order to compare EFT measurements at the same gestational week for standardization, all EFT measurements were performed at 29 weeks of gestation in all pregnant women who participated in the study. Gestational week was confirmed both according to the last menstrual period and first trimester ultrasound. Patients were divided into PGDM, GDM and control groups, with 110 cases in each group. Pregnant women with at least one high blood glucose level in the 75-g OGTT and with no diagnosis of previous diabetes were considered as GDM (FPG ≥ 92 mg/dL, 1st hour glucose ≥ 180 mg/dL, 2nd hour glucose ≥ 153 mg/dL). OGTT was not performed to pregnant women with PGDM. Multiple pregnancies, pregnant women with chromosomal and structural anomalies, insufficient EFT measurements (inability to obtain a clear measurement due to severe maternal obesity, unsuitable fetal position, etc.) and comorbidities accompanying pregnancy (preeclampsia, intrauterine growth retardation, metabolic disorders, etc.) were not included in the study. A flowchart of our study population was shown in . HbA1c was measured at the 29th weeks of gestation by high-performance liquid chromatography method supplied by the Bio-Rad Diagnostic Group (Hercules, CA). The treatment of GDM began with lifestyle interventions including nutritional counseling, dietary changes, and daily exercise. Fasting and postprandial self-monitoring of blood glucose were recommended in pregnancies with GDM to achieve optimal glucose levels. Glucose targets were FPG <95 mg/dL and either 1-h postprandial glucose <140 mg/dL or 2-h postprandial glucose <120 mg/dL. If blood glucose targets were not maintained in more than half of measurements during 1 week assessment, insulin treatment was initiated. Demographic characteristics (age, gravida, parity, HbA1C, body mass index (BMI), birthweight), results of the 75-g OGTT and ultrasonographic parameters including EFT, biparietal diameter (BPD), AC, femur length (FL), and deepest vertical pocket of amniotic fluid (DVP) were evaluated. Macrosomia was defined as a birthweight >90th percentile corrected for gestational age and gender. Samsung® HS 70A4D real time ultrasonography system (2017, Seoul, South Korea) was used for all patients by the same clinician as described previously [Citation20].
Figure 1. Flowchart of the study population. IUGR: intrauterine growth restriction; GDM: gestational diabetes mellitus; PGDM: pregestational diabetes mellitus; OGTT: oral glucose tolerance test.
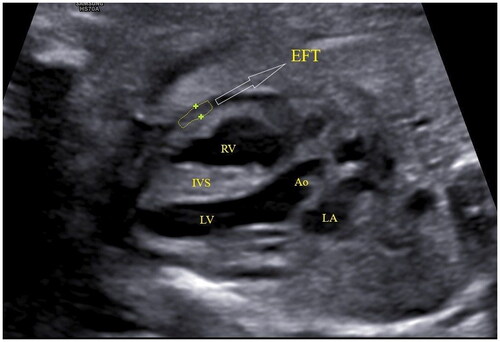
Patients whose fetal position was not suitable (the back of the fetus was close to the probe) and patients who did not have appropriate EFT measurements due to maternal morbid obesity were not included in the study. EFT is located along the right ventricular wall. Dimensions of EFT are highest toward the fetal heart apex and thickness decreases toward the base of the heart [Citation20,Citation21]. Thickest area of epicardial fat was chosen to measure the EFT. In an attempt to standardize the measurement technique as much as possible, images from cardiac long axis views of left outflow tract or short axis view of right outflow tract as close to the level of the aortic valve as possible were utilized (). Measurement should be taken at the end of diastole and mean thickness of three consecutive measurements should be recorded. Adipose tissue can be easily distinguished from pericardial effusion as it is more echogenic. Furthermore, pericardial fusion-EFT distinction can be made with color Doppler [Citation6]. In ultrasonographic measurement, calipers should be placed inwardly between epicardium and myocardium.
Figure 2. Ultrasonographic image of fetal epicardial fat tissue. EFT: epicardial fat thickness; RV: right ventricle; LV: left ventricle; IVS: interventricular septum; Ao: ascending aorta; LA: left atrium.
Data obtained in the study were analyzed using SPSS (Statistical Package for Social Sciences) for Windows 25.0 program (SPSS Inc., Chicago, IL). While evaluating data, descriptive statistical methods (number, percentage, min–max values, mean, standard deviation) were used. The normal distribution of data depends on skewness and kurtosis values being between ±3. In the comparison of normally distributed data and quantitative data, independent t-test was used for difference between two independent groups, and one-way analysis of variance (ANOVA) was used for comparing more than two independent groups. Chi-square test was used for categorical variables. The significance level was accepted as .05. Since OGTT was not performed in patients with PGDM, ANOVA for OGTT variables was not performed in this group. Independent t-test was used for these variables. Post hoc Bonferroni’s test was applied to determine which group make a difference after a statistically significant result in the comparison of the three groups. Correlation test was performed between EFT and other demographic measurements, and Pearson’s coefficient was checked for data with normal distribution. Receiver operating characteristic (ROC) curve analysis was used to calculate cutoff values in differentiating pregnancies with PGDM and GDM from normal pregnancies according to fetal EFT value.
Results
A total of 330 patients, including 110 pregnant women with PGDM, 110 pregnant women with GDM and 110 controls, were evaluated. The PGDM group consisted of 67 (60.9%) women with type 1 and 43 (39.1%) women with type 2 DM. Demographic characteristics and ultrasound findings of three groups are shown in . Patients in PGDM group were significantly older than both control and GDM groups (p = .003). FPG, 1-h and 2-h blood glucose values of patients in GDM group were found to be significantly higher than control group (p < .001 for all). HbA1C values were significantly higher in both GDM and PDGM groups compared to control group (p < .001). As expected, HbA1c values of patients with PGDM were significantly higher than those with GDM (p = .043). Body mass index was significantly higher in PGDM group compared to GDM and control groups (p = .047). In ultrasound measurements, AC and DVP were found to be significantly higher in PGDM and GDM groups compared to control group and also significantly higher in PGDM group compared to GDM group (p < .001 for all).
Table 1. Demographic features, laboratory and ultrasound findings of the three groups.
The mean of EFT measurements were found to be 1.19 ± 0.049 mm, 1.40 ± 0.082 mm, and 1.47 ± 0.083 mm for the control, GDM and PGDM groups, respectively (). There was a significant difference between all three groups in terms of EFT (p < .001). After adjusting by Bonferroni’s correction, it was observed that the mean EFT of control group was lower than the mean values of GDM and PGDM groups. Furthermore, the mean EFT of PGDM group was higher than the mean EFT of GDM group (p < .001). Comparison of the mean values of EFT using a box plot among three groups is demonstrated in .
Figure 3. Distribution of EFT values of GDM, PGDM, and control groups (a). ROC curves constructed with the multivariate logistic regression model. The AUC of EFT with other variables (FPG, 1hPG, 2hPG, HbA1c, AC, and DVP) for the diagnosis of GDM (1.000) is larger than when using the individual factors of EFT (0.985), FPG (0.643), 1hPG (0.956), 2hPG (0.976), HbA1c (0.902), AC (0.696), and DVP (0.669) (b). The AUC of EFT with other variables (HbA1c, AC, and DVP) for the diagnosis of PGDM (1.000) is larger than when using the individual factors of EFT (0.999), HbA1c (0.934), AC (0.858), and DVP (0.814) (c). 1hPG: 1 h plasma glucose; 2hPG: 2 h plasma glucose; AC: abdominal circumference; DVP: deepest vertical pocket; EFT: epicardial fat thickness; FPG: fasting plasma glucose; GDM: gestational diabetes mellitus; PGDM: pregestational diabetes mellitus.
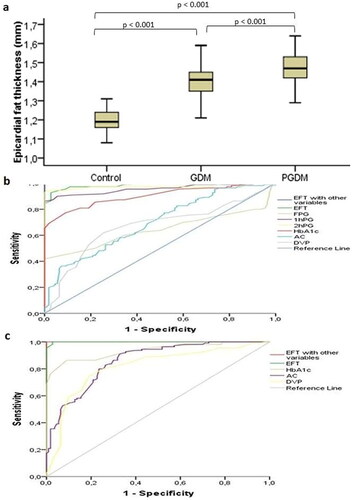
Correlation analysis was performed to test the relationship between EFT and demographic characteristics of patients (). There was a statistically significant weak positive correlation between EFT and maternal age (r = 0.184, p < .001), FPG (r = 0.188, p = .005) and DVP (r = 0.332, p < .001), moderate positive correlation between EFT and fetal AC (r = 0.422, p < .001), HbA1C (r = 0.559, p < .001) and strong positive correlation between EFT and 1st hour (r = 0.650, p < .001) and 2nd hour glucose values (r = 0.719, p < .001). ROC analysis was performed to identify optimal cutoff points in differentiating pregnancies with GDM and PGDM from normal pregnancies (). The ROC curve of the multivariate logistic regression model for the diagnosis of GDM demonstrated EFT with other variables (FPG, 1hPG, 2hPG, HbA1c, AC, and DVP) has an AUC of (1.000, 95% CI 1.000–1.000), which is larger than when using the individual factors of EFT (0.985, 95% CI 0.973–0.997), FPG (0.643, 95% CI 0.565–0.720), 1hPG (0.956, 95% CI 0.927–0.984), 2hPG (0.976, 95% CI 0.953–0.999), HbA1c (0.902, 95% CI 0.861–0.944), AC (0.696, 95% CI 0.628–0.764), and DVP (0.669, 95% CI 0.595–0.742). The ROC curve of the multivariate logistic regression model for the diagnosis of PGDM demonstrated EFT with other variables (HbA1c, AC, and DVP) has an AUC of (1.000, 95% CI 1.000–1.000), which is larger than when using the individual factors of EFT (0.999, 95% CI 0.998–1.000), HbA1c (0.934, 95% CI 0.902–0.967), AC (0.858, 95% CI 0.810–0.906), and DVP (0.814, 95% CI 0.756–0.873). Using a cutoff level of 1.27 mm, EFT diagnosed GDM with a sensitivity of 94% and specificity of 95% (AUC: 0.95 (95% CI 0.973–0.997)). Furthermore, using a cutoff level of 1.3 mm, EFT diagnosed PGDM with a sensitivity of 97.3% and specificity of 98.2% (AUC: 0.999 (95% CI 0.998–1.000)). We also performed an ROC curve analysis for assessing the performance of fetal EFT value in predicting macrosomia. The AUC was 0.945 (95% CI 0.912–0.979) for macrosomia. The optimal fetal EFT threshold for predicting macrosomia was found as 1.36 mm, with a sensitivity of 93.4% and specificity of 95.8%. We did not calculate inter-observer reproducibility for EFT because all measurements were obtained by a single clinician. However, intra-observer analysis demonstrated good repeatability and reproducibility of EFT. The interclass correlation coefficient of intra-observer reproducibility for EFT measurement was 0.755 (95% CI 0.526–0.984). Intra-observer variability of measurements of EFT was found to be 0.5 ± 0.4 mm.
Table 2. Correlation analysis between epicardial fat thickness and demographic features, laboratory and ultrasound findings.
Discussion
Diabetes is the most common endocrine disorder during pregnancy. Fetal–maternal morbidity is significantly reduced if diabetes is diagnosed and precautions are taken. In this study, we evaluated fetal EFT, which is a candidate to be a new marker to determine maternal diabetes status in pregnancy. Unlike other studies in the literature, we took one step further by separately evaluating fetal EFT in pregnancies with both PGDM and GDM. Cut off values of EFT for the diagnosis of diabetes risk were also identified.
It is known that epicardial adipose tissue has important paracrine and metabolic effects. EFT is closely related to excess fat tissue in the body. However, the main reason for EFT to be a reliable marker is that EFT is not affected by changes in subcutaneous and muscle tissues [Citation12]. Previous studies in adults revealed that increase in EFT is an important diabetic marker and may be a determinant in terms of morbidities that may occur due to diabetes [Citation22]. Furthermore, a close relationship was found between EFT and metabolic syndrome, obesity and insulin resistance [Citation8].
Some recent studies investigated whether use of EFT as a marker in adults could be beneficial for pregnant women and their fetuses. In the study by Jackson et al., EFT of fetuses was compared between diabetic and non-diabetic pregnant women [Citation16]. They found that fetal EFT was statistically significantly higher in diabetic pregnant women (EFT mean = 1.43 mm). However, in their studies, diabetic pregnancies were not grouped and evaluated as PGDM and GDM. Similarly, we found that EFT of fetuses was higher in diabetic pregnant women compared to non-diabetic pregnancies. Unlike to other studies, we also demonstrated that fetal EFT was significantly higher in pregnancies with PGDM compared to those with GDM.
In our study, we found that maternal age and values of HbA1C, AC, and DVP were significantly higher in PGDM and GDM groups. Although maternal age was not significantly different between GDM and control groups, pregnant women with PGDM were significantly older than both GDM and control groups. We have also observed a statistically significant correlation between fetal EFT and maternal age. Most of the previous studies did not explore any significant relationship between fetal EFT and maternal age [Citation15,Citation17,Citation18]. Only in the study of Akkurt et al., maternal age was found to be greater in diabetic pregnant women as in our study [Citation6]. The reason for higher maternal age in pregnant women with PGDM may be explained by the desire of women with existing diabetes to postpone their pregnancy to a later age. Another explanation is that these women with PGDM are more likely suffer from comorbidities which increase the risk of failure to conceive.
Since diagnosis of PGDM was established at the first trimester of pregnancy in our study population, OGTT was performed to GDM and control groups. We found that fetal EFT was significantly positively correlated with every parameter of OGTT values (fasting, 1st hour and 2nd hour). Although this correlation was weak for FPG level, it was strong for 1st hour and 2nd hour glucose levels after OGTT. Similarly, Yavuz et al. compared and correlated fetal EFT values and blood glucose measurements obtained during a 75-g OGTT [Citation18]. In their study, fetal EFT had a significantly weak and moderate correlation with 1st hour and 2nd hour glucose level after controlling for maternal age, gestational age, BMI, and AC. However, when only GDM pregnancies were included, fetal EFT was positively and moderately related to 2-h glucose values [Citation18]. Furthermore, we also explored that there was a significant and moderate positive correlation between fetal EFT values and maternal HbA1c levels. Confirming our results, Aydin and Fatihoglu observed a strong positive correlation between fetal EFT and maternal HbA1C values [Citation17]. In this study, fetal EFT was found to be significantly associated with adverse perinatal outcomes of diabetes including macrosomia and polyhydramnios. Fetal EFT was significantly positively correlated with fetal AC and DVP of amniotic fluid volume. Akkurt et al. were also demonstrated a higher fetal EFT in pregnancies with GDM compared to normal pregnancies [Citation6]. Unlike from our study, Aydin and Fatihoglu were determined a positive correlation between fetal EFT and DVP values instead of AC values [Citation17]. However, they compared fetal EFT values only between GDM and control groups. Among all three groups in our study, HbA1c, AC, and DVP values were significantly higher in PGDM group followed by GDM group. These findings provide strong evidence that high EFT value is a fetal reflection of poorly controlled maternal glucose level.
In this study, we investigated the diagnostic value of fetal EFT on diabetic pregnancies and determined cutoff EFT values for both PGDM and GDM. Until recently, there are two studies in the literature that calculate which values of fetal EFT can be used as cutoffs for diabetes in pregnancy. The first of these was done by Akkurt et al. [Citation6]. The recommended equation of the mentioned study for calculation of EFT in pregnant women with diabetes was EFT = 0.05 × gestational age + 0.07 (R2 = 0.70). In our study, we did not calculate the equation related to the gestational week. Instead, we evaluated EFT of all pregnant women in the same week to ensure standardization. Another study in the literature was performed by Aydin et al. [Citation15]. They conducted a study to determine the relationship between fetal EFT and weight. Aydin et al. stated that a cutoff fetal EFT value above 1.38 mm was predictive for diagnosis of fetuses with large for gestational age with a sensitivity of 94.4% and a specificity of 97.6% [Citation15]. All patients in that study were evaluated at 22 weeks of gestation, but diabetic pregnancies were not grouped as PGDM and GDM. In the present study, cutoff EFT values for pregnant women with PGDM and GDM were 1.30 mm (sensitivity 97.3%, specificity 98.2%) and 1.27 mm (sensitivity 94%, specificity 95%), respectively. Both EFT cutoff values of our study were found to be lower than the values calculated by Akkurt et al. and Aydin et al. [Citation6,Citation17]. We believed that the reason for this difference is related to patient selection criteria and classification of study population rather than measurement technique of fetal EFT.
In conclusion, this study revealed that fetal EFT was significantly increased in diabetic pregnancies with either PGDM or GDM but the increase in fetal EFT was significantly higher in PGDM compared to GDM. Furthermore, fetal EFT is strongly correlated with maternal blood glucose levels in diabetic pregnancies. Therefore, fetal EFT value could be used as a prognostic marker for PGDM and GDM and also for adverse perinatal outcomes related to diabetes.
Ethical approval
The research related to human use complied with all the relevant national regulations, institutional policies, and in accordance with the tenets of the Helsinki Declaration, and has been approved by the authors’ Institutional Review Board or equivalent committee (Izmir Tepecik Training and Research Hospital Ethics Committee, decision no: 2021/02-50).
Author contributions
All authors have accepted responsibility for the entire content of this manuscript and approved its submission.
Consent form
Informed consent was obtained from all individuals included in this study.
Disclosure statement
The authors report no conflict of interest.
Additional information
Funding
References
- Depla AL, De Wit L, Steenhuis TJ, et al. Effect of maternal diabetes on fetal heart function on echocardiography: systematic review and meta-analysis. Ultrasound Obstet Gynecol. 2021;57(4):539–550.
- Catalano PM, Presley L, Minium J, et al. Fetuses of obese mothers develop insulin resistance in utero. Diabetes Care. 2009;32(6):1076–1080.
- Vaag AA, Grunnet LG, Arora GP, et al. The thrifty phenotype hypothesis revisited. Diabetologia. 2012;55(8):2085–2088.
- Zhu Y, Zhang C. Prevalence of gestational diabetes and risk of progression to type 2 diabetes: a global perspective. Curr Diabetes Rep. 2016;16(1):1–11.
- Kitzmiller JL, Ferrara A, Peng T, et al. Chapter 5: preexisting diabetes and pregnancy. In: Cowie CC, Casagrande SS, Menke A, editors. Diabetes in America. 3rd ed. Bethesda (MD): National Institute of Diabetes and Digestive and Kidney Diseases (US); 2018.
- Akkurt MO, Turan OM, Crimmins S, et al. Increased fetal epicardial fat thickness: a novel ultrasound marker for altered fetal metabolism in diabetic pregnancies. J Clin Ultrasound. 2018;46(6):397–402.
- Sacks HS, Fain JN. Human epicardial adipose tissue: a review. Am Heart J. 2007;153(6):907–917.
- Bertaso AG, Bertol D, Duncan B, et al. Clinical update epicardial fat: definition, measurements and systematic review of main outcomes. Arq Bras Cardiol. 2013;101(1):18–28.
- Iacobellis G, Barbaro G. The double role of epicardial adipose tissue as pro- and anti-inflammatory organ. Horm Metab Res. 2008;40(7):442–445.
- Tam WC, Hsieh M, Yeh S. Echocardiographic measurement of epicardial fat thickness. Acta Cardiol Sin. 2019;35(5):546–547.
- Iacobellis G, Ribaudo MC, Assael F, et al. Echocardiographic epicardial adipose tissue is related to anthropometric and clinical parameters of metabolic syndrome: a new indicator of cardiovascular risk. J Clin Endocrinol Metab. 2003;88(11):5163–5168.
- Chun H, Suh E, Byun AE, et al. Epicardial fat thickness is associated to type 2 diabetes mellitus in Korean men: a cross-sectional study. Cardiovasc Diabetol. 2015;14(1):1–7.
- Cakmak A, Dincgez B, Abide C, et al. Assessment of relationships between novel inflammatory markers and presence and severity of preeclampsia: epicardial fat thickness, pentraxin-3, and neutrophil-to-lymphocyte ratio. Hypertens Pregnancy. 2017;36(3):233–239.
- Liu J, Song G, Zhao G, et al. Epicardial adipose tissue thickness as a potential predictor of pre-eclampsia. Pregnancy Hypertens. 2021;23:87–90.
- Aydin E, Tanacan A, Bulut AN. A cut-off value of epicardial fat thickness for the prediction of large for gestational age foetuses. J Obstet Gynaecol. 2020;41:224–228.
- Jackson D, Deschamps D, Myers D, et al. Fetal epicardial fat thickness in diabetic and non-diabetic pregnancies: a retrospective cross-sectional study. Obesity. 2016;24(1):167–171.
- Aydin S, Fatihoglu E. Fetal epicardial fat thickness: can it serve as a sonographic screening marker for gestational diabetes mellitus? J Med Ultrasound. 2020;28:239–244.
- Yavuz MO, Akkurt S, Yalcin G, et al. Second trimester fetal and maternal epicardial fat thickness in gestational diabetic pregnancies. Horm Metab Res. 2016;48:595–600.
- Faul F, Erdfelder E, Lang AG, et al. G*power 3: a flexible statistical power analysis program for the social, behavioral, and biomedical sciences. Behav Res Methods. 2007;39:175–191.
- Schejbal V. Epicardial fatty tissue of the right ventricle—morphology, morphometry and functional significance. Pneumologie. 1989;43(9):490–499.
- Can MM, Can E, Ozveren O, et al. Epicardial fat tissue thickness in preeclamptic and normal pregnancies. ISRN Obstet Gynecol. 2012;2012:386539.
- Nasri A, Najafian J, Derakhshandeh SM, et al. Epicardial fat thickness and severity of coronary heart disease in patients with diabetes mellitus type II. ARYA Atheroscler. 2018;14(1):32–37.