
Abstract
Objective
While a basic understanding of pelvic size and typology is still important for obstetricians, pelvic measurement data for Japanese women are very scarce. To our best knowledge, no large-scale pelvimetry studies of Japanese women have been made for the past 50 years. This study aimed to investigate the accurate size, particularly the obstetric conjugate (OC) and transverse diameter of the pelvic inlet (TD), of modern Japanese women, using three-dimensional (3D) computed tomography (CT), and to obtain their reference values.
Methods
This retrospective, single-center observational study enrolled Japanese non-pregnant women aged between 20 and 40 years, who underwent pelvic CT examination from 2016 to 2021. CT was performed for various reasons, including acute abdomen, search for cancer metastases, and follow-up of existing disease. However, no cases were taken for pelvic measurements. Pelvimetry was performed retrospectively using a 3D workstation. The OC was measured on a strict lateral view and the TD was measured on an axial-oblique view. Other clinical data, such as age, height, and weight, were also extracted from the medical charts and analyzed.
Results
A total of 1,263 patients were enrolled, with the mean age of 32.7 years (standard deviation [SD] 6.2). The mean height, weight, and body mass index were 158.8 cm (SD 5.8), 54.8 kg (SD 11.7), and 21.7 kg/m2 (SD 4.4), respectively. The mean OC length was 127.0 mm (SD 9.5, 95% confidence interval [CI] 126.5–127.5), while the mean TD length was 126.8 mm (SD 7.5, 95% CI 126.4–127.2). Both values were normally distributed. Height was significantly associated with OC (regression coefficient = 0.75 [95% CI 0.66–0.84], p < .001) and TD (regression coefficient = 0.63 [95% CI 0.56–0.70], p < .001). Age showed a weak but statistically significant positive association with TD (regression coefficient = 0.14 [95% CI 0.07–0.20], p < .001) and OC (regression coefficient = −0.10 [95% CI −0.18 to −0.01], p = .026).
Conclusion
The 3D CT pelvimetry in 1,263 non-pregnant Japanese women of childbearing age revealed the mean OC and TD of 127.0 mm, and 126.8 mm, which were 11.8 mm and 4.3 mm larger, respectively, than those in the survey in 1972. Our data will be referred to in clinical practice as the standard pelvic measurement values for the Japanese population.
Introduction
The interest in pelvimetry, while originating in the anatomical sciences, undoubtedly developed through the process of examining the causes of dystocia. Obstetricians, presumably, first attributed dystocia to the anatomical size of the pelvis. Therefore, external pelvimetry was widely used to determine whether vaginal delivery was possible. However, dystocia clearly occurred with a certain frequency in women who did not have a contracted pelvis. With the discovery of X-rays by Röntgen in 1895 and the establishment of X-ray pelvimetry methods by Guthmann and Martius in the 1920s, objective evaluation of the size of the baby’s head and each part of the pelvis became possible. This led to the development of the idea that dystocia is caused not only by the pelvis size but also by the relative relationship between the pelvis and the size of the baby’s head passing through it: cephalopelvic disproportion (CPD).
Since the emergence of the CPD concept, the significance of measuring only the pelvis has apparently declined. Importantly, however, individual differences in the maternal pelvis size are, in general, much larger than those of the mature infant’s head, suggesting that pelvic size may be more closely related to delivery progression than the infant head size. Moreover, Harper et al. designed and sensibly carried out a remarkable prospective study of 426 pregnant women, in which X-ray pelvimetry was performed after parturition, regardless of the success or failure of vaginal delivery [Citation1]. They revealed that women, whose anteroposterior pelvic diameter was less than the 10th percentile, were at a greater risk of cesarean section [Citation1]. These results are consistent with our clinical view that pelvic size itself has some influence on the success of vaginal delivery, although whether pelvimetry can predict it remains inconclusive. Given the absence of significant changes in the mode of human parturition over time, a basic understanding of pelvic size and typology remains important for obstetricians and should not be neglected.
Unfortunately, pelvic measurement data for Japanese women are very scarce. The only available study is the 1972 survey by the Japan Society of Obstetrics and Gynecology, which was published in Japanese [Citation2]. According to this study, in which the pelvimetry was probably performed by conventional X-ray method, the mean length of obstetric conjugate (OC) and the transverse diameter of the pelvic inlet (TD) were 115.2 and 122.5 mm, respectively. To our best knowledge, in the following 50 years since then, no large-scale pelvic measurements of Japanese women have been made. It is indisputable that the lifestyle of the nation has changed dramatically in the past 50 years, and that changes in the female physique have also occurred. For example, the mean heights of 17-year-old women in Japan in 1970 and 2020 are 155.6 cm (SD 5.04) and 157.9 cm (SD 5.35), respectively according to the Annual Report of School Health Statistics Research conducted by the Ministry of Education, Culture, Sports, Science and Technology. In light of these changes, we hypothesized that the pelvic size of the modern Japanese might have changed. Therefore, a timely and thorough investigation of the pelvic size of contemporary Japanese women is necessary since no studies have examined changes in pelvic size over a 50-year period within the same ethnic group.
Over the past two decades, pelvimetry has replaced conventional X-ray methods with computed tomography (CT) and magnetic resonance imaging (MRI). To acquire excellent bony pelvic images and for precise pelvimetry, three-dimensional (3D) images are essential. Although 3D images are available in both CT and MRI, 3D MRI images can be obtained only when relevant sequences are planned beforehand. In contrast, CT can create 3D images using any cross-sectional images backward as long as thin slice images are obtained, even if it is not performed for pelvimetric purpose [Citation3–5]. Additionally, the tissue contrast of bone is superior in CT images to MRI images, particularly with the contrast of 3D bone images.
Therefore, this study sought to investigate the accurate size, particularly the OC and TD, of modern Japanese women using 3D CT to understand how the Japanese pelvis size has changed over the past 50 years and obtain their current reference values.
Materials and methods
Study design and patients
This retrospective observational study was approved by the Ethics Committee of Kyoto University (R3077). Informed consent was obtained in the form of opt-out on the website. We retrospectively reviewed all patients who underwent CT examinations at Kyoto University Hospital between August 2016 and June 2021. The inclusion criteria were (1) Japanese non-pregnant women aged between 20 and 40 years, regardless of whether they were pregnant at the time of the study or had ever been pregnant, and (2) patients with CT images of the pelvis. The exclusion criteria were (1) patients with a disease that caused significant short stature and (2) patients with a history of pelvic fracture. If the same patient had CT examination more than once, the more recent information was used. CT was performed for various reasons, including acute abdomen, search for cancer metastases, and follow-up of existing disease. No cases were taken for pelvic measurements. Data were obtained for OC and TD, along with the basic characteristics of the women: age, height, weight, and body mass index (BMI). Determination of whether a patient was Japanese or not was made by the patient’s name, because Japanese surname and given name are extremely distinctive.
Definition of OC and TD of the pelvic inlet
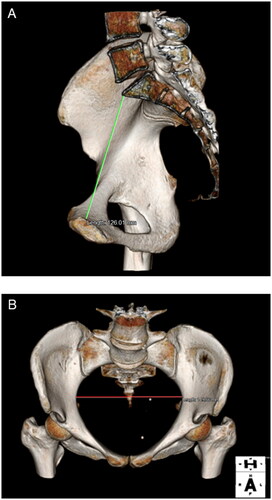
In this study, we defined OC and TD as follows: OC (mm), shortest distance from the promontory to the symphysis (; TD (mm), the maximum diameter between the right and left coxal bones that make up the pelvic inlet plane ().
Figure 1. Representative 3D CT images. Measurements of the obstetric conjugate (A) and transverse diameter of the pelvic inlet (B).
Pelvimetry
CT scanning was performed using 80- or 320-multidetector CT scanners (Aquilion Prime; Aquilion One, Canon Medical Systems, Tochigi, Japan). CT images were acquired using 80 × 0.5 mm beam collimation, 500-ms rotation time, 120 kVp; and the current was automatically regulated according to the individual patient’s shape. The volume data were transferred to a workstation (Aquarius Net Station, Terarecon, NC, USA), in which the images were converted to 3D bone images using the volume-rendering technique. Pelvimetry was performed retrospectively using a 3D workstation. OC was measured on a strict lateral view (), and TD was measured on an axial oblique view (). All measurements were performed by two obstetricians (S.N. and M.M.).
Sample size
Prior to the study, we calculated the precision-based sample size using STATA version 17. We found that a sample of approximately 1,119 women was required to obtain a two-sided 95% confidence interval (CI) for the mean OC with a 90% probability of having a width no larger than 1 mm. We estimated the standard deviation (SD) to be 8.3 mm based on a previous study [Citation6].
Statistical analyses
Statistical analyses were conducted using SPSS software version 28.0. Descriptive statistics (frequencies, means, 95% CI, SD, and percentiles) were obtained for OC and TD. We presented the frequency of contracted pelvis (OC <9.5 cm, TD <10.5 cm) and relatively contracted pelvis (OC ≥9.5 cm and <10.5 cm, TD ≥10.5 cm and <11.5 cm) based on the classifications from the 1972 study of the Japan Society of Obstetrics and Gynecology. We assessed the correlation between OC and TD using the Pearson correlation coefficient, followed by a regression analysis to determine the model with a good fit to the data (linear or quadratic regression model). We further conducted a regression analysis to examine the association of OC and TD with the age and height of the women. Multiple regression models were then developed to examine the extent to which the sizes of the OC and TD were influenced by age and height, after adjusting for each other. All tests were two-tailed, and p-values < 0.05 considered statistically significant. There were no missing cases in the outcome (OC and TD), except for the explanatory variables (height and weight). For missing data, pairwise deletion, also known as available case analysis, was adopted after a sensitivity analysis comparing the results of pairwise deletion and multiple imputations. Non-imputation was justified because the results of these analyses were almost identical, indicating that the effects of the missing data were unlikely to have caused biased results.
Results
During the study period, 1,271 patients met the inclusion criteria, excluding duplicates. After excluding eight patients with a congenital disease that caused a significant short stature, 1,263 patients met the inclusion criteria and were all enrolled. The mean age of the patients was 32.7 years (SD 6.2). There were 187 and 181 cases with missing height and weight data, respectively. Therefore, the mean height, weight, and BMI were 158.8 cm (SD 5.8, n = 1,076), 54.8 kg (SD 11.7, n = 1,082), and 21.7 kg/m2 (SD 4.4, n = 1,072), respectively.
and showed the results of pelvimetry using 3D CT. The mean OC length was 127.0 mm (SD 9.5, 95% CI 126.5–127.5), while the mean TD length was 126.8 mm (SD 7.5, 95% CI 126.4 to 127.2). The percentiles of OC and TD were shown in . There were only two patients (0.16%) diagnosed with contracted pelvis according to the definition of Japan Society of Obstetrics and Gynecology in 1972 (). Based on the same definition, 64 patients (5.1%), excluding two duplicates, were diagnosed with a relatively contracted pelvis ().
Figure 2. Histograms of the obstetric conjugate (A) and transverse diameter of the pelvic inlet (B).
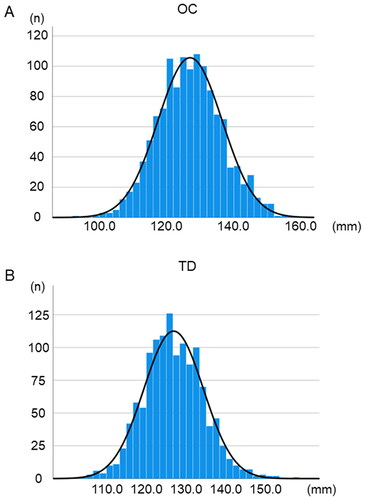
Table 1. Reference ranges for OC and TD.
Table 2. Incidence of contracted pelvis.
There was a statistically significant positive correlation between OC and TD (p < 0.001); however, the strength of the correlation was small, with a Pearson correlation coefficient of 0.17 (). The quadratic equation described the best correlation between OC and TD (R2 = 0.036, p < 0.001), indicating that only 3.6% of the OC variability could be explained by TD. Bivariate regression analysis showed that height was significantly associated with both OC (regression coefficient = 0.75 [95% CI 0.66–0.84], p < 0.001) and the TD (regression coefficient =0.63 [95% CI 0.56–0.70], p < 0.001) (, and ). Differences in height accounted for 20.7% of OC variations (linear regression R2 = 0.207) and 23% of TD variations (linear regression R2 = 0.230). Age showed a weak, but statistically significant, positive association with both OC and TD ().
Figure 3. Scatter plots of the obstetric conjugate, transverse diameter of the pelvic inlet, and height.
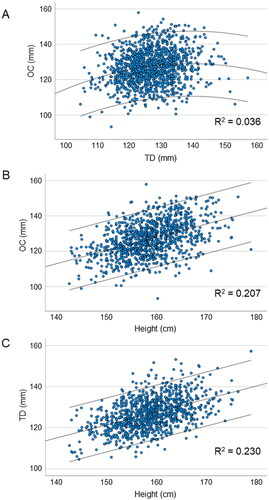
Table 3. OC and TD in relation to height and age.
Multiple regression models with height and age as predictors showed statistically significant associations between these variables and OC (with a regression formula of 10.69 + 0.75*height − 0.1*age; adjusted R2 = 0.21) and TD (with regression formula of 23.25 + 0.62*height + 0.14*age; adjusted R2 = 0.24). The proportion of outcome variability explained by these models was almost identical to that of bivariate regression models with height, indicating that outcome variability was largely unexplained by age.
Discussion
This study retrospectively performed 3D CT pelvimetry in 1,263 non-pregnant Japanese women of childbearing age. We revealed that the mean OC and TD were 127.0 mm and 126.8 mm, respectively, which were larger than those in the 1972 survey. To our best knowledge, this is the first large-scale, accurate pelvic measurement study of the modern Japanese population in almost 50 years.
In 1972, the Japan Society of Obstetrics and Gynecology compiled pelvimetry data, which was probably determined by the conventional X-ray method, on Japanese women who delivered mature babies weighing more than 2,800 g vaginally, from 29 hospitals across Japan [Citation2]. As a result, the mean OC and TD were 115.2 mm (95% CI 114.8–115.6, n = 2,012), and 122.5 mm (95% CI 122.1–122.9, n = 1,452), respectively. Although the detailed methods are unknown, the results of this study were analyzed together with the results of labor attempts based on the same strict criteria at 11 hospitals throughout Japan. According to the survey, the incidence of cesarean sections, indicated by arrest of descent, increased with the results of pelvic measurements: OC ≥105 mm, 7.2% (146/2,032); OC 95–105 mm, 23.7% (56/236); OC <95 mm, 40.0% (6/15); TD ≥115 mm, 8.4% (124/1,477); TD 105–115 mm, 24.2% (49/202); TD <105 mm, 72.7% (8/11), respectively. Based on these results, the Japan Society of Obstetrics and Gynecology defined a contracted pelvis as OC less than 95 mm or TD less than 105 mm. While these data formed the basis for reference values currently used in Japan, a precise methodology was not described in that report. Therefore, it is necessary to conduct reliable pelvimetry to establish standard values for the Japanese population.
This report has been the largest 3D CT pelvimetry study for non-pregnant women for decades. Our results are generally consistent with those of recent studies conducted in different racial populations. Lenhard et al. reported that the mean OC and TD of women in Germany who had normal vaginal delivery (n = 20) and women who had dystocia (n = 20), measured by 3D CT pelvimetry, were 120.0 mm (SD 9.0), 129.0 mm (SD 9.0), and 120.0 mm (SD 12.0), 127.0 mm (SD 11.0), respectively [Citation3]. Capelle et al. performed 3D CT pelvimetry on 63 pregnant women in France and found that the mean OC and TD were 124.6 mm (SD 10.7) and 125.1 mm (SD 10.9) [Citation5]. Similar results were reported in studies of MRI pelvimetry as well [Citation4,Citation7]. The MRI pelvimetry for pregnant women in Germany revealed that the OC and TD in vaginal delivery group (n = 93) were 125.4 mm (SD 9.2) and 133.6 mm (SD 9.2), and those in planned Cesarean section group (n = 95) were 120.5 mm (SD 12.0) and 127.2 mm (SD 9.1) [Citation7]. Furthermore, the measurement of OC by transabdominal ultrasound, which has been shown to be feasible and reproducible [Citation8], revealed that the mean OC in 209 Japanese female at 36 weeks of gestation was 127.7 mm (SD 7.0) [Citation9]. These data are not comparable to those of our study as they were all obtained from pregnant women or women who had experienced childbirth. However, it is interesting to note that the results were generally similar despite the different racial backgrounds of the study participants.
Our data suggested that the pelvic size, particularly in the context of the pelvic cavity, of Japanese women may have changed over the past 50 years. The mean OC and TD have increased by 11.8 mm and 4.3 mm, respectively. These changes were statistically and clinically significant. Consequently, in terms of OC and TD, only 0.08% of women were diagnosed with contracted pelvis in our present study. In contrast, 0.66 and 0.65% of women had contracted pelvis in terms of OC and TD, respectively, in 1972. Furthermore, the women diagnosed with relatively contracted pelvis in terms of OC and TD were 0.7, 4.5, and 10.3%, 12.0% in the current study and 1972 survey, respectively. These data indicated that few women today met the criteria for contracted pelvis, which usually results from malnutrition, such as vitamin D deficiency [Citation10].
Notably, the OC increase was more pronounced than the TD increase in this study, implying that the pelvic inlet shape also changed in the Japanese cohort. Interestingly, in 2015, Narumoto et al. reported that pelvic shape had changed among pregnant Japanese women over the last 5 decades [Citation11]. Based on the X-ray pelvimetry, they found that the prevalence of the anthropoid-type pelvis, whose pelvic inlet shape is characterized by a vertical oval, in 2010s was 46.3%, whereas those in 1980s and 1960s were 25 and 7.6%, respectively [Citation11]. Although typological analysis of the pelvic inlet was not performed in our study, our pelvimetry data seem to be consistent with their observations. However, the mechanism underlying these changes remains unclear. Notably, these changes occurred over a period of only 50 years. Therefore, it is reasonable to assume that they are not due to very long-term factors such as climatic changes [Citation12], but rather to more short-term factors including changes in diet, lifestyle, and body size. Indeed, our pelvimetry data significantly correlated with height, and the mean height of Japanese women has increased by 2.3 cm over the past five decades. This fact might account for the OC increase although no rational explanation exists as to why there has been only a slight TD increase. Methodological heterogeneity of X-ray and 3D CT may be an alternative explanation.
This is the largest pelvimetric study in Japan since the 1970s using 3D CT, which is more accurate than X-rays and has served its purpose well in terms of obtaining the reference values of OC and TD in reproductive aged women in Japan. However, the present study has some limitations. First, the data were collected in one hospital and may only be generalizable to a population with similar health and demographic characteristics. Second, most enrolled women had some kind of disease, such as cancer, which would require CT scans. To minimize selection bias, we excluded those with diseases that might affect pelvic formation or size. However, the results may differ from those of healthy women. Third, evidence supporting a relationship between the change in pelvimetry data and particular birth outcomes, which we wanted to know the most and is of clinical value, remains elusive. Further research is needed to determine the clinical impact of changes in pelvic size over the past 50 years, in both parturition and other clinical areas.
Conclusions
The 3D CT pelvimetry in 1,263 non-pregnant Japanese women of childbearing age revealed that the mean OC and TD increased by 11.8 and 4.3 mm, respectively, compared to the data from the previous survey in 1972. Our data will be referred to in clinical practice as the standard pelvic measurement value for the Japanese population.
Acknowledgement
We appreciate Mr. Satoshi Kozawa, RT (Department of Radiology, Kyoto University Hospital, Japan), for helpful discussions. We would like to thank Editage (www.editage.com) for English language editing.
Disclosure statement
No potential conflict of interest was reported by the author(s).
Additional information
Funding
References
- Harper LM, Odibo AO, Stamilio DM, et al. Radiographic measures of the mid pelvis to predict cesarean delivery. Am J Obstet Gynecol. 2013;208(6):460 e461–466.
- Kochi Y, Araki H, Ojima N, et al. Report of the subcommittee on pelvic size. Acta Obstetrica et Gynaecologica Japonica. 1972;24(2):172–173.
- Lenhard MS, Johnson TR, Weckbach S, et al. Pelvimetry revisited: analyzing cephalopelvic disproportion. Eur J Radiol. 2010;74(3):e107–111.
- Liao KD, Yu YH, Li YG, et al. Three-dimensional magnetic resonance pelvimetry: a new technique for evaluating the female pelvis in pregnancy. Eur J Radiol. 2018;102:208–212.
- Capelle C, Devos P, Caudrelier C, et al. How reproducible are classical and new CT-pelvimetry measurements? Diagn Interv Imaging. 2020;101(2):79–89.
- Perlman S, Raviv-Zilka L, Levinsky D, et al. The birth canal: correlation between the pubic arch angle, the interspinous diameter, and the obstetrical conjugate: a computed tomography biometric study in reproductive age women. J Matern Fetal Neonatal Med. 2019;32(19):3255–3265.
- Franz M, von Bismarck A, Delius M, et al. MR pelvimetry: prognosis for successful vaginal delivery in patients with suspected fetopelvic disproportion or breech presentation at term. Arch Gynecol Obstet. 2017;295(2):351–359.
- Di Pasquo E, Volpe N, Labadini C, et al. Antepartum evaluation of the obstetric conjugate at transabdominal 2D ultrasound: a feasibility study. Acta Obstet Gynecol Scand. 2021;100(10):1917–1923.
- Katanozaka M, Yoshinaga M, Fuchiwaki K, et al. Measurement of obstetric conjugate by ultrasonic tomography and its significance. Am J Obstet Gynecol. 1999;180(1 Pt 1):159–162.
- VanSickle C, Liese KL, Rutherford JN. Textbook typologies: challenging the myth of the perfect obstetric pelvis. Anat Rec. 2022;305(4):952–967.
- Narumoto K, Sugimura M, Saga K, et al. Changes in pelvic shape among Japanese pregnant women over the last 5 decades. J Obstet Gynaecol Res. 2015;41(11):1687–1692.
- Wells JC, DeSilva JM, Stock JT. The obstetric dilemma: an ancient game of russian roulette, or a variable dilemma sensitive to ecology? Am J Phys Anthropol. 2012;149(55):40–71.