
Abstract
Background
Using straightforward and accessible haematological parameters platelet/lymphocyte ratio (PLR) to diagnose preeclampsia (PE) early and precisely remains a challenge. Although several clinical studies suggested that PLR is able to diagnose PE, there has been no systematic evaluation of the diagnostic utility.
Objectives
To examine the diagnostic accuracy and potential applicability of PLR in the detection of PE.
Study design
Seven databases were searched using a combination of PLR and PE terms, and all potentially pertinent studies were systematically searched up to March 2023. All potentially relevant studies both prospective and retrospective were reviewed. To assess the diagnostic value of PLR for PE, pooled sensitivity (Sen), specificity (Spe), diagnostic odds ratio (DOR) and area under the summary receiver operating characteristic curve (SROC-AUC) were calculated.
Results
Thirteen studies were enrolled in the meta-analysis. In the second and third trimesters, the PLR suggested a diagnostic value for PE with a pooled Sen of 54.7% [95% confidence interval (CI) (51.7, 57.6)], Spe of 77.8% [95% CI (75.5, 80.0)], + LR of 2.457 [95% CI (1.897, 3.182)], -LR of 0.584 [95% CI (0.491, 0.695)], DOR of 4.434 [95% CI (3.071, 6.402)], the SROC-AUC of 0.7296 and the standard error (SE) of 0.0370.
Conclusion
For the diagnosis of PE, PLR has a limited sensitivity but an acceptable specificity, and showed moderate accuracy. Further using complete blood count (CBC) indicators such as PLR alone or in combination to diagnose and predict PE could reduce healthcare costs and improve maternal and child prognosis.
1. Introduction
Pre-eclampsia (PE) is mainly manifested by new-onset hypertension after 20 weeks of gestation, with associated impaired maternal organs and systems, which incidence is about 3% to 10% of all pregnancies [Citation1]. In a prospective observational study of six low and middle-income countries, preeclampsia/eclampsia is the third leading cause of maternal death [Citation2]. Fetal growth restriction (FGR), postpartum depression, and premature birth are all rates that are higher in pregnant women who have PE [Citation3–5]. Having experienced PE increases the lifetime risk of women developing vascular disease, hypertension, and stroke [Citation1,Citation6]. PE exposure has been linked to a higher lifetime risk of cardiovascular disease in children [Citation7]. Meanwhile, PE raises the risk of mental retardation, social cognitive impairment, epilepsy, and cerebral palsy in exposed kids causing neurodevelopmental problems [Citation8]. These adverse maternal and infant outcomes raise the short-term cost of healthcare, putting enormous strain on families and society [Citation9]. Therefore, earlier detection of PE and administration of the necessary therapies will assist to improve the prognosis for both the mother and the newborn.
The pathophysiology of PE is multifactorial, multi-mechanistic, and multi-pathway. Placental ischemia and hypoxia are brought on by persistent uteroplacental blood flow limitation brought on by inadequate recasting of the uterine spiral artery. Once the placenta is stressed, it releases reactive oxygen species, inflammatory mediators, and anti-angiogenic hormones into the mother’s bloodstream, which damages and dysfunctions endothelial cells and leads to the development of PE [Citation10]. Meanwhile, dysfunction in endothelial cells contributes to vasoconstriction and platelet adhere aggregation, triggering clotting, increasing platelet consumption, and leading to a low platelet count [Citation11]. Preeclampsia is characterized by an immunoreaction and inflammatory reaction imbalance, which leads to abnormal immune tolerance and an excessive systemic inflammatory response [Citation12], increasing the number of lymphocytes [Citation13]. This results in “low-grade inflammation”, which is defined as a condition with slightly elevated immune cells and inflammatory factors without obvious clinical symptoms [Citation14].
Platelets and lymphocytes are significant blood markers for immunologic surveillance, and the platelet-to-lymphocyte ratio (PLR) is crucial for the development of the cytokine-dependent immune response [Citation15]. Currently, for diagnosis of PE, the traditional method is based on maternal characteristics, and physical methods use the measurement of blood pressure (BP) or mean artery pressure (MAP), which are extremely accessible and recognized, but seem difficult to accurately assess PE [Citation16–18]. Hemo-diagnosis is fast and low-cost, including platelet count (PLT), mean platelet volume (MPV) and red cell distribution width (RDW) are raised as significant markers of PE, while their diagnostic capacity is unsatisfactory [Citation19,Citation20]. PLR is a marker of systemic inflammatory response (SIR) that can be evaluated automatically during a complete blood count (CBC) for regular obstetric evaluation and has a wide clinical application in the prediction and diagnosis of PE. According to recent research, PLR may be linked to systemic inflammatory diseases [Citation21], atherosclerosis [Citation22,Citation23], and cancer prognosis [Citation24]. Due to the different study designs and population selection, the diagnostic value of PLR for PE is mixed. Through a review of the literature, there is no evidence-based medical evidence that supports the diagnostic accuracy of the PLR index for PE.
This study systematically assessed the sensitivity and specificity of PLR's diagnostic accuracy in the detection of PE in order to provide high-quality evidence to support the clinical application of PLR in the diagnosis of PE.
2. Materials and methods
This protocol is registered on the PROSPERO platform (ID: CRD42022311953), reported by the Preferred Reporting Items for Systematic Reviews and Meta-Analyses (PRISMA) [Citation25], and completed checklists.
2.1. Search strategy
The following electronic databases were systematically searched including PubMed, Cochrane Library, EMbase, Wanfang data, VIP database (VIP) and China Biomedical Literature Database (CBM), the Chinese National Knowledge Infrastructure (CNKI) databases. Two investigators separately searched the relevant articles up to March 2023, without regard for language. Using “pre-eclampsia”, “preeclampsia”, “PE”, “platelet/lymphocyte”, “platelets to lymphocytes ratio”, “platelets-lymphocytes” and “PLR” as index terms for the literature search. The search strategy is presented in the online supplement Figure 1. All search strategies were determined by multiple pre-searches, and the search formulas were adjusted according to the characteristics of each database. All potential research is imported into the EndNote x7 software. Any differences between the two investigators are dealt with by the third.
2.2. Inclusion and exclusion criteria
Studies meeting the following inclusion criteria were eligible: (1) PLR diagnostic test for PE; (2) Clinical diagnostic criteria, the 8th edition of Obstetrics and Gynecology [Citation26] or the American College of Obstetricians and Gynecologists (ACOG) [Citation27] diagnostic criteria are satisfied by PE patients; (3) Data such as true positives (TP), false positives (FP), false negatives (FN), and true negatives (TN) can be calculated. Studies meeting the following exclusion criteria were ineligible: (1) Studies included abstracts as well as expert commentary, case studies, review articles, letters, and editorials; (2) Studies failed to gather crucial information; (3) Nonclinical or non-human research studies; (4) Studies were duplicate publication. All papers confirmed were evaluated and vetted by DY and SWL; any disparities were solved by RXH.
2.3. Data extraction
The following information will be extracted from the inclusion studies: authors, year of publication, country, sample size, age, gestational week at sampling in PE group and control group, the PE reference standard, cut-off of the PLR, TP, TN, FP, FN and other outcomes of interest. Data were extracted and vetted by DY and SWL; any disagreement was settled by RXH.
2.4. Quality assessment
The collected diagnostic test literature was assessed employing the Quality Assessment of Diagnostic Accuracy Studies 2 (QUADAS-2) tool [Citation28]. Each entry was evaluated as “yes”, "no", or "unclear”, “yes" for meeting this criterion, “no” for not meeting this criterion, “unclear” for partially meeting or not getting enough information. The quality of the literature was evaluated by DY and SWL independently in RevMan 5.3 software. If a dispute arose, RXH was consulted.
2.5. Statistical analysis
Software programs MetaDiSc 1.4 and Stata 16.0 were utilized for the statistical analysis. The homogeneous between included studies was evaluated by chi-square and I2 statistic. Studies were defined as significant heterogeneity with p < .10 or I2 > 50%. If there is significant heterogeneity, a random-effects model is applied. If no significant statistical heterogeneity was observed, a fixed-effect model was used.
The diagnostic accuracy of PLR for PE was calculated. Pooled sensitivity (Sen) and specificity (Spe) were used to assess the extent to which the PLR values matched the true values. Using negative likelihood ratio (-LR) and positive likelihood ratio (+LR) to synthetically evaluate the veracity of diagnostic tests. Use diagnostic odds ratio (DOR) to reflect the strength of the association between the results of PLR diagnosis and PE. The area under the summary receiver operating characteristic curve (SROC-AUC) was applied to assess the efficacy of diagnostic tests.
Spearman correlation coefficient, univariate meta-regression analysis and subgroup analysis were made to recognize and explain the source of heterogeneity and if it was caused by threshold effects. Sensitivity analysis is based on exploring the stability of the results by deleting one paper each time. Using Deeks funnel plots to analyze the possibility of publication bias. The statistical significance threshold was fixed at p < .05.
3. Results
3.1. Study selection
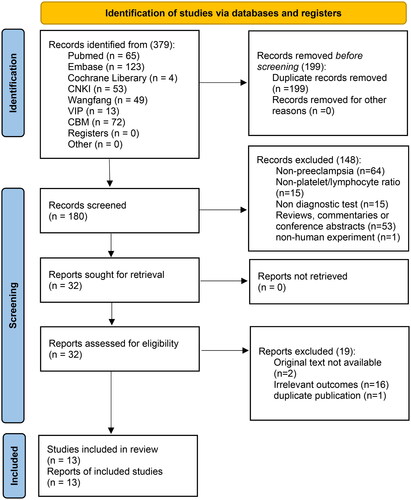
Selecting literature based on the PRISMA diagram. The original search yielded 379 articles, then 199 duplicates were excluded, and 167 studies were excluded according to the eligibility criteria. Thirteen studies [Citation29–41] in all were eventually included for analysis. The selection flowchart is shown in .
Figure 1. Selection flowchart.
3.2. Study characteristics
Finally, thirteen studies with 1696 PE cases and 2010 control cases were included in the present meta-analysis. Thirteen studies [Citation29–41] were all published between 2016 to 2023 and involving seven nations. Three studies [Citation39–41] collected the samples in the first trimester for examining the predictive value of PLR, while ten studies [Citation29–38] sampled in mid-to late pregnancy. Moreover, two were of the prospective design [Citation30,Citation34] and eight were of the retrospective design [Citation29,Citation31–33,Citation35–41]. Diagnostic test basic characteristics are summarized in .
Table 1. The basic characteristics of the included thirteen studies in the systematic review.
3.3. Quality assessment
The quality assessment of the 13 studies using QUADAS-2 (see online supplement Figure 2). Common reasons for the lower quality of evidence were failure to pre-determine thresholds and failure to use blinding in the interpretation of results. The outcomes reveal that the included studies generally satisfied the standards for quality assessment of diagnostic accuracy.
3.4. Diagnostic accuracy of PLR in second and third trimesters
Ten studies investigated the diagnostic utility of PLR in the second and third trimesters [Citation29–38]. The calculation of the I2 statistic of sensitivity and specificity for the pooled studies was 88.3% and 86.9%, revealing significant heterogeneity among the enrolled studies. The diagnostic effectiveness of PLR for PE was investigated using the random-effects model. It was possible to detect a modest diagnostic value of PLR for the detection of PE with a pooled Sen of 54.7% [95% CI (51.7, 57.6)], Spe of 77.8% [95% CI (75.5, 80.0)], +LR of 2.457 [95% CI (1.897, 3.182)], -LR of 0.584 [95% CI (0.491, 0.695)], DOR of 4.434 [95% CI (3.071, 6.402)] (). An overview of SROC curves is presented in , with the AUC calculated to be 0.7296 and the standard error (SE) to be 0.0370.
Figure 2. Forest plots of diagnostic Performance of PLR for PE in second and third trimesters. (A) sensitivity, (B) specificity, (C) negative likelihood ratio, (D) positive likelihood ratio, (E) diagnostic odds ratio (DOR), (F) area under the summary receiver operating characteristic (SROC) curve. The first author’s name and year of each studies are listed. CI: confidence interval.
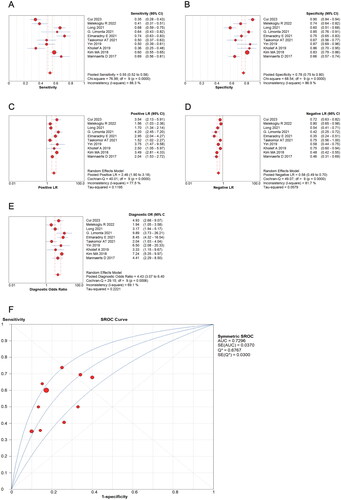
The Spearman correlation coefficient was 0.602 (p = 0.066), which implied non-existent of the threshold effect. Subgroup analysis of the ten included studies revealed that the total sample size of the study, cutoff values, and reference standard may all have an impact on the results of the diagnostic ability of PLR for PE (see online supplement Table 1).
Using univariate meta-regression analysis to identify sources of study heterogeneity. According to the analyses, the study design could have a statistically significant effect on meta-analysis outcomes (p = .0165), whereas the area, reference standard, cutoff and sample size have no effect on heterogeneity. The univariate meta-regression analysis results can be found in the online supplement Table 2.
3.5. Prediction ability of PLR in first trimester
Three articles [Citation39–41] looked into the predictive diagnostic efficacy of PLR. Based on the statistical analysis, significant heterogeneity was found in these studies, which derived from the threshold effect. Fitting the SROC curve, the AUC was calculated to be 0.7671, the Q value was 0.7077, and the SE(Q) was 0.0186 (see online supplement Figure 3).
3.6. Weighted mean difference of the PLR in pre-eclampsia
Considering the limited number of relevant studies, the weighted mean difference (WMD) of the available six studies [Citation29,Citation32,Citation34–37] in mid to late pregnancy was calculated. The severe PE had a lower PLR than mild PE compared to the control group (WMD = −13.48 [95% CI (−24.96, −1.99)] (p = 0.000) and WMD = −27.94 [95% CI (−46.64, −9.24)] (p = 0.000)). Meanwhile, PLR is considerably reduced in severe PE than in mild PE with a WMD of −14.27 [95% CI (−24.29, −4.25)] (see online supplementary Figure 4).
3.7. Sensitivity analysis
Sensitivity analysis was carried out and the results showed no significant difference from the overall results, indicating that this study is stable and reliable (see online supplement Figure 5).
3.8. Publication bias
According to Deek’s funnel plots, of the studies that were considered, there was no proof of potential publication bias (p = 0.53) (see online supplement Figure 6).
4. Discussion
Worldwide, about 500,000 fetal and neonatal deaths and 76,000 maternal deaths are associated with PE per year [Citation42], therefore, early prediction and diagnosis of PE is critical for early management of the disease and improved pregnancy outcomes. Traditional, biophysical and serobiological prediction methods for PE exist [Citation43–44], since there is no reliable and accepted screening model that is widely accepted in clinical practice. Currently, clinical studies demonstrated that sFlt-1 (soluble fms-like tyrosine kinase-1)/PlGF (Placental Growth Factor)-Ratio can be used as a diagnostic predictor of PE [Citation45–46], but due to it is not a recommended indicator for monitoring in common pregnant woman, sFlt-1 and PlGF are not be routinely tested in obstetric examination. This will incur additional healthcare costs. Therefore, it is necessary to find simple and universal predictive or screening indicators before the appearance of typical clinical signs and symptoms of PE.
The assessment of CBC is common during obstetric examinations of pregnant women, and the acquisition of its relevant parameters is straightforward. Placental microangiopathy in pregnant women with PE affects circulating cells such as leukocytes, neutrophils, lymphocytes and platelets, while the number of CBC varies by gestational period [Citation47].
Research [Citation48] suggests that neutrophil-lymphocyte ratio (NLR) was higher in patients with pre-eclampsia mean difference (MD) was 1.44 [95% CI (1.04, 1.83)] and is relevant in the clinical prediction and severity stratification of PE. A meta-analysis by Zheng et al. [Citation49] reported an SROC-AUC of 0.82 for the diagnosis of PE by NLR alone and has an acceptable sensitivity. PLR is a nonspecific inflammation marker, and studies on the use of PLR to diagnose PE are existing. However, due to the variability of the experimental design, the diagnostic accuracy of PLR for PE was unclear. This is the initial research with the use of meta-analysis on the diagnostic utility of PLR in PE. Based on numerous clinical studies with a total sample of 1696 patients with PE, the meta-analysis showed that PLR has moderate diagnostic value for PE in the second and third trimesters, while more original research is still required to confirm the predictive benefit.
PLR is a typical haematological parameter, which is safely, easily and cheaply obtained by calculation after CBC testing. However, the number of platelet and lymphocyte may vary between different instruments, which may have influenced the PLR data.
PE is classified as non-severe or severe based on clinical features. It is also classified as early-onset or late-onset based on the gestational week of onset, preterm or full-term based on the situation of preterm delivery. The classifications of PE are not mutually exclusive [Citation27,Citation50]. The current studies correlate PLR with the severity of PE [Citation51]. In our study included literature, only Melekoğlu R et al. [Citation30] distinguished PE as non-severe and severe and reported that the sensitivity, specificity, and AUC of PLR for the diagnosis of severe PE were 45.9%, 78.1% and 0.573 respectively. In two trials, the accuracy of PLR in identifying severe PE merely was analyzed, which was excluded in our meta-analysis, reporting the sensitivity, specificity, and AUC were 49.6%, 74.7%, 0.639 and 55%, 50%, 0.554 [Citation52, Citation53]. It is apparent that PLR has an inferior diagnostic capability for severe PE.
Yu et al. [Citation39], Oğlak SC et al. [Citation40] and Gezer C et al. [Citation41] collected samples within 14 weeks of gestation and assessed the predictability of PLR for PE. According to the calculation, the threshold effect existed obviously among the three studies, demonstrating 0.7671 of AUC and 0.7077 of Q value. This finding indicates that PLR may be useful in predicting PE, a subsequent investigation is needed to conduct a meta-analysis.
In this systematic review, ten studies were used to assess the diagnostic potential in the second and third trimesters of PLR for PE. According to the meta-analysis findings, the pooled Sen and Spe were 54.7% [95% CI (51.7, 57.6)] and 77.8% [95% CI (75.5, 80.0)], separately, and the SROC-AUC was 0.7296, suggesting that PLR has a moderate diagnostic value, high specificity and low misdiagnosis rate, while low sensitivity and high leakage. The pooled DOR was 4.434 [95% CI (3.071, 6.402)], indicating that PLR has good diagnostic efficacy. The likelihood ratio responding to both sensitivity and specificity can reflect the diagnostic accuracy comprehensively and steadily. The pooled + LR and -LR in this systematic review were 2.457 [95% CI (1.897, 3.182)] and 0.584 [95% CI (0.491, 0.695)], revealing that the likelihood ratio has a high misclassification rate and poor stability.
This systematic review has significant heterogeneity, the heterogeneity test and the calculation of the Spearman correlation coefficient suggest that significant heterogeneity exists and is not caused by threshold effect. Subgroup analysis of the area, reference standard, sample size, cutoff, and study design separately revealed that the subgroup with a total sample size of less than 200 cases, cutoff values of less than 110, and using ACOG as the reference standard has superior diagnostic ability. Using univariate meta-regression analysis of these 5 factors indicated that study design could be a source of heterogeneity in the meta-analysis (p = 0.0165).
In mid to late pregnancy, we explored the WMD of PLR in the mild PE group, the severe PE group and the control group similarly, suggesting a progressive decrease in PLR with the progression of PE in the two trimesters, with a significant statistical difference between all groups. This is possibly related to the excessive systemic inflammation arising from PE [Citation54], resulting in a lower PLR than normotensive pregnancy. Perhaps in further study, haematological parameter levels also can be used to assess the treatment of PE [Citation55].
Some limitations remain in this study. (i) PLR is a novel marker of systemic inflammatory response (SIR), the number of literature examining its diagnostic value for PE is limited, which may cause problems with data stability. (ii) The thirteen included studies were from East Asia, the Middle East, and Europe, with English and Chinese as the languages and yellow and white as the ethnicities, which could lead to selection bias. (iii)The sample size of the included studies would have an impact on the findings of this review.
In conclusion, we systematically evaluated the efficacy of PLR in the prediction and diagnosis of PE alone in this study. PLR is a low-cost, easily accessible, and safe marker with moderate value in the diagnosis of PE. A lower level in PLR signals the likelihood of PE. However, PLR is one of the haematological parameters, and trials which combine with other indexes are necessary. Prospective, multicenter, large sample-size studies should be conducted in the future to validate the potential applicability of PLR as a predictive and diagnostic marker for PE, either alone or in combination with other easily accessible markers during pregnancy.
Supplemental Material
Download MS Word (3.4 MB)Disclosure statement
No potential conflict of interest was reported by the author(s).
Additional information
Funding
References
- Perry H, Khalil A, Thilaganathan B. Preeclampsia and the cardiovascular system: an update. Trends Cardiovasc Med. 2018;28(8):505–513. doi: 10.1016/j.tcm.2018.04.009.
- Pasha O, McClure EM, Saleem S, et al. A prospective cause of death classification system for maternal deaths in low and middle-income countries: results from the global network maternal newborn health registry. BJOG. 2018;125(9):1137–1143. doi: 10.1111/1471-0528.15011.
- An H, Jin M, Li Z, et al. Impact of gestational hypertension and pre-eclampsia on preterm birth in China: a large prospective cohort study. BMJ Open. 2022;12(9):e058068. doi: 10.1136/bmjopen-2021-058068.
- Mol BWJ, Roberts CT, Thangaratinam S, et al. Pre-eclampsia. Lancet. 2016;387(10022):999–1011. doi: 10.1016/S0140-6736(15)00070-7.
- Caropreso L, de Azevedo Cardoso T, Eltayebani M, et al. Preeclampsia as a risk factor for postpartum depression and psychosis: a systematic review and meta-analysis. Arch Womens Ment Health. 2020;23(4):493–505. doi: 10.1007/s00737-019-01010-1.
- Thilaganathan B, Kalafat E. Cardiovascular system in preeclampsia and beyond. Hypertension. 2019;73(3):522–531. doi: 10.1161/HYPERTENSIONAHA.118.11191.
- Alsnes IV, Vatten LJ, Fraser A, et al. Hypertension in pregnancy and offspring cardiovascular risk in young adulthood: prospective and sibling studies in the HUNT study (Nord-Trøndelag health study) in Norway. Hypertension. 2017;69(4):591–598. doi: 10.1161/HYPERTENSIONAHA.116.08414.
- Vakil P, Henry A, Craig ME, et al. A review of infant growth and psychomotor developmental outcomes after intrauterine exposure to preeclampsia. BMC Pediatr. 2022;22(1):513. doi: 10.1186/s12887-022-03542-5.
- Stevens W, Shih T, Incerti D, et al. Short-term costs of preeclampsia to the United States health care system. Am J Obstet Gynecol. 2017;217(3):237–248.e16. doi: 10.1016/j.ajog.2017.04.032.
- Burton GJ, Redman CW, Roberts JM, et al. Pre-eclampsia: pathophysiology and clinical implications. BMJ. 2019;366:l2381. doi: 10.1136/bmj.l2381.
- Mtali YS, Lyimo MA, Luzzatto L, et al. Hypertensive disorders of pregnancy are associated with an inflammatory state: evidence from hematological findings and cytokine levels. BMC Pregnancy Childbirth. 2019;19(1):237. doi: 10.1186/s12884-019-2383-7.
- Qu H, Khalil RA. Vascular mechanisms and molecular targets in hypertensive pregnancy and preeclampsia. Am J Physiol Heart Circ Physiol. 2020;319(3):H661–H681. doi: 10.1152/ajpheart.00202.2020.
- Amidu N, Boateng Antuamwine B, Awe Akilla M, et al. Leucocyte differential count and pregnancy induced hypertension: implication for risk and disease assessment. AJLM. 2020;5(1):32. doi: 10.11648/j.ajlm.20200501.15.
- Kirbas A, Ersoy AO, Daglar K, et al. Prediction of preeclampsia by first trimester combined test and simple complete blood count parameters. J Clin Diagn Res. 2015;9(11):QC20–QC23.
- Turkmen K, Erdur FM, Ozcicek F, et al. Platelet-to-lymphocyte ratio better predicts inflammation than neutrophil-to-lymphocyte ratio in end-stage renal disease patients. Hemodial Int. 2013;17(3):391–396. doi: 10.1111/hdi.12040.
- Wright D, Syngelaki A, Akolekar R, et al. Competing risks model in screening for preeclampsia by maternal characteristics and medical history. Am J Obstet Gynecol. 2015;213(1):62.e1–62.e10. doi: 10.1016/j.ajog.2015.02.018.
- Amiri M, Ramezani Tehrani F, Rahmati M, et al. Changes over-time in blood pressure of women with preeclampsia compared to those with normotensive pregnancies: a 15-year population-based cohort study. Pregnancy Hypertens. 2019;17:94–99. doi: 10.1016/j.preghy.2019.05.007.
- Tayyar A, Krithinakis K, Wright A, et al. Mean arterial pressure at 12, 22, 32 and 36 weeks’ gestation in screening for pre-clampsia. Ultrasound Obstet Gynecol. 2016;47(5):573–579. doi: 10.1002/uog.15815.
- Sachan R, Patel M. L., Sachan P., Shyam R. Role of platelet count and mean platelet volume and red cell distribution width in the prediction of preeclampsia in early pregnancy. J Family Med Prim Care. 2021;10(2):838–843. doi: 10.4103/jfmpc.jfmpc_1528_20.
- Bawore SG, Adissu W, Niguse B, et al. A pattern of platelet indices as a potential marker for prediction of pre-eclampsia among pregnant women attending a tertiary hospital, Ethiopia: a case-control study. PLoS One. 2021;16(11):e0259543. doi: 10.1371/journal.pone.0259543.
- Gasparyan AY, Ayvazyan L, Mukanova U, et al. The platelet-to-Lymphocyte ratio as an inflammatory marker in rheumatic diseases. Ann Lab Med. 2019;39(4):345–357. doi: 10.3343/alm.2019.39.4.345.
- Qiu Z, Jiang Y, Jiang X, et al. Relationship between platelet to lymphocyte ratio and stable coronary artery disease: meta-Analysis of observational studies. Angiology. 2020;71(10):909–915. doi: 10.1177/0003319720943810.
- Kounis NG, Koniari I, Plotas P, et al. Inflammation, thrombosis, and platelet-to-lymphocyte ratio in acute coronary syndromes. Angiology. 2021;72(1):6–8. doi: 10.1177/0003319720946213.
- Zhang X, Zhao W, Yu Y, et al. Clinicopathological and prognostic significance of platelet-lymphocyte ratio (PLR) in gastric cancer: an updated meta-analysis. World J Surg Oncol. 2020;18(1):191. doi: 10.1186/s12957-020-01952-2.
- Page MJ, McKenzie JE, Bossuyt PM, et al. The PRISMA 2020 statement: an updated guideline for reporting systematic reviews. Syst Rev. 2021;10(1):89. doi: 10.1186/s13643-021-01626-4.
- Xie Xing GW. Obst Gynaecol. 2013; Beijing, China: People’s Medical Publishing House, 66–67.
- Gestational hypertension and preeclampsia: ACOG practice bulletin, number 222. Obstet Gynecol. 2020;135(6):e237–e260.
- Whiting PF, Rutjes AW, Westwood ME, et al. QUADAS-2: a revised tool for the quality assessment of diagnostic accuracy studies. Ann Intern Med. 2011;155(8):529–536. [Database] doi: 10.7326/0003-4819-155-8-201110180-00009.
- Cui HX, Chen C, Jung YM, et al. Neutrophil-to-lymphocyte ratio (NLR) as a predictive index for liver and coagulation dysfunction in preeclampsia patients. BMC Preg Childbirth. 2023;23(1):4. Published 2023 Jan 4. doi: 10.1186/s12884-022-05335-1.
- Melekoğlu R, Yaşar Ş, Zeyveli Çelik N, et al. Evaluation of dyslipidemia in preeclamptic pregnant women and determination of the predictive value of the hemato-lipid profile: a prospective, cross-sectional, case-control study. Turk J Obstet Gynecol. 2022;19(1):7–20. doi: 10.4274/tjod.galenos.2022.36744.
- Limonta G, Intra J, Brambilla P. The clinical utility of D-dimer/platelet count ratio in pregnant women. J Mat-Fetal Neonatal Med. 2022;35(18):3602–3611. doi: 10.1080/14767058.2020.1833322.
- Long L, Huang Y, Zhang Z, et al. Correlation of the neutrophil/lymphocyte ratio and platelet/lymphocyte ratio with the severity of preeclampsia. Maternal Child Health Care China. 2021;36(06):1263–1266.
- Elmaradny E, Alneel G, Alkhattaf N, et al. Predictive values of combined platelet count, neutrophil-lymphocyte ratio, and platelet-lymphocyte ratio in preeclampsia. J Obstet Gynaecol. 2022;42(5):1011–1017. doi: 10.1080/01443615.2021.1986476.
- Taşkömür AT, Erten Ö. The role of cystatin C, neutrophil-lymphocyte ratio and platelet-lymphocyte ratio in the evaluation of kidney function in women with preeclampsia. Taiwan J Obstet Gynecol. 2021;60(4):615–620. doi: 10.1016/j.tjog.2021.05.007.
- Yin X, Yang Z. Correlation of inflammation index and platelet distribution width in peripheral blood of pregnant woman with preeclampsia. Hebei Medical J. 2019;41(19):2918–2921.
- Kholief A, Swilam R, Elhabashy A, et al. Neutrophil/lymphocyte ratio, platelet/lymphocyte ratio, and c-reactive protein as markers for severity of pre-eclampsia. Res Opin Anesth Intensive Care. 2019;6(1):1. doi: 10.4103/roaic.roaic_101_17.
- Kim MA, Han GH, Kwon JY, et al. Clinical significance of platelet-to-lymphocyte ratio in women with preeclampsia. Am J Reprod Immunol. 2018;80(1):e12973. doi: 10.1111/aji.12973.
- Mannaerts D, Heyvaert S, De Cordt C, et al. Are neutrophil/lymphocyte ratio (NLR), platelet/lymphocyte ratio (PLR), and/or mean platelet volume (MPV) clinically useful as predictive parameters for preeclampsia? J Matern Fetal Neonatal Med. 2019;32(9):1412–1419. doi: 10.1080/14767058.2017.1410701.
- Hong-Biao YU, Meng-Dan SHI, Jing YAO, et al. Value of neutrophil-to-Lymphocyte ratio and platelet-to-Lymphocyte ratio for predicting preeclampsia during pregnancy. J Sichuan Univ. 2022;53(06):1039–1044.
- Oğlak SC, Tunç Ş, Ölmez F. First trimester mean platelet volume, neutrophil to lymphocyte ratio, and platelet to lymphocyte ratio values are useful markers for predicting preeclampsia. Ochsner J. 2021;21(4):364–370. doi: 10.31486/toj.21.0026.
- Gezer C, Ekin A, Ertas IE, et al. High first-trimester neutrophil-to-lymphocyte and platelet-to-lymphocyte ratios are indicators for early diagnosis of preeclampsia. Ginekol Pol. 2016;87(6):431–435. doi: 10.5603/GP.2016.0021.
- Magee LA, Brown MA, Hall DR, et al. The 2021 International society for the study of hypertension in pregnancy classification, diagnosis & management recommendations for international practice. Pregnancy Hypertens. 2022; 27:148–169. doi: 10.1016/j.preghy.2021.09.008.
- Erez O, Romero R, Maymon E, et al. The prediction of late-onset preeclampsia: results from a longitudinal proteomics study. PLoS One. 2017;12(7):e0181468. doi: 10.1371/journal.pone.0181468.
- Tarca AL, Taran A, Romero R, et al. Prediction of preeclampsia throughout gestation with maternal characteristics and biophysical and biochemical markers: a longitudinal study. Am J Obstet Gynecol. 2022;226(1):126.e1-126–e22. doi: 10.1016/j.ajog.2021.01.020.
- Dröge LA, Perschel FH, Stütz N, et al. Prediction of preeclampsia-related adverse outcomes with the sFlt-1 (soluble fms-like tyrosine kinase 1)/PlGF (placental growth factor)-ratio in the clinical routine: a real-world study. Hypertension. 2021;77(2):461–471. doi: 10.1161/HYPERTENSIONAHA.120.15146.
- Hughes RCE, Phillips I, Florkowski CM, et al. The predictive value of the sFlt-1/PlGF ratio in suspected preeclampsia in a New Zealand population: a prospective cohort study. Aust N Z J Obstet Gynaecol. 2023;63(1):34–41. doi: 10.1111/ajo.13549.
- Bulbul M, Uckardes F, Karacor T, et al. Can complete blood count parameters that change according to trimester in pregnancy be used to predict severe preeclampsia? J Obstet Gynaecol. 2021;41(8):1192–1198. doi: 10.1080/01443615.2020.1854697.
- Kang Q, Li W, Yu N, et al. Predictive role of neutrophil-to-lymphocyte ratio in preeclampsia: a meta-analysis including 3982 patients. Pregnancy Hypertens. 2020;20:111–118. doi: 10.1016/j.preghy.2020.03.009.
- Zheng W, Zhan J, Chen A, et al. Diagnostic value of neutrophil-lymphocyte ratio in pre-eclampsia: a systematic review and meta-analysis. China J Modern Med. 2020;30 (01):63–69.
- Poon LC, Shennan A, Hyett JA, et al. The international federation of gynecology and obstetrics (FIGO) initiative on pre-eclampsia: a pragmatic guide for first-trimester screening and prevention [published correction appears in. Int J Gynaecol Obstet. 2019; 146(3):390–391. .
- Toptas M, Asik H, Kalyoncuoglu M, et al. Are neutrophil/lymphocyte ratio and platelet/lymphocyte ratio predictors for severity of preeclampsia? J Clin Gynecol Obstet. 2016;5(1):27–31. doi: 10.14740/jcgo389w.
- Tiantian W, Shihong C, Yunxiao Z, et al. Changes and clinical value of peripheral blood inflammatory markers in patients with preeclampsia. Medical Innovation of China. 2021;18(09):15–18.
- Ozkan D, Ibanoglu MC, Adar K, et al. Efficacy of blood parameters in predicting the severity of gestational hypertension and preeclampsia. J Obstet Gynaecol. 2023;43(1):2144175.
- Aggarwal R, Jain AK, Mittal P, et al. Association of pro- and anti-inflammatory cytokines in preeclampsia. J Clin Lab Anal. 2019;33(4):e22834. doi: 10.1002/jcla.22834.
- Adane T, Melku M, Ayalew G, et al. Accuracy of monocyte to lymphocyte ratio for tuberculosis diagnosis and its role in monitoring anti-tuberculosis treatment: systematic review and meta-analysis. Medicine. 2022;101(44):e31539. doi: 10.1097/MD.0000000000031539.