
 ?Mathematical formulae have been encoded as MathML and are displayed in this HTML version using MathJax in order to improve their display. Uncheck the box to turn MathJax off. This feature requires Javascript. Click on a formula to zoom.
ABSTRACT
Based on commercial passenger-carrying airships like LZ129 or R100, a hypothetical electric rigid framed airship including a solar cell covered surface and a lithium-ion battery is designed. The size of the battery and the coverage with solar cells are selected such that long-haul flights are possible. To simulate flight times, weather data from 2019 and time-dependent solar irradiation are used. Travel route and battery use are optimised in order to reduce flight times. For a mid-range and long-haul use case for passenger or freight transport, travel times have been calculated. Building on these results, analysis of CO2 emissions, land-use, and operating costs are carried out to reveal that depending on the use case, CO2 emissions of solar-powered airships could be as low as 1% to 5% of the emissions of a conventional aircraft at an estimated energy consumption in USD per km of 0.5% to 2.5%.
1. Introduction
Access to affordable, sustainable, and efficient transportation is a critical factor for inclusion and opportunity (see Sustainable Mobility for All Citation2017). Structural changes in the mobility landscape, for example through digitalisation, as well as climate and environmental protection initiatives such as the Paris Agreement on Climate Change require innovative approaches to enable the use of renewable energy, low emission of climate-damaging gases and aerosols, affordable transportation costs, short transportation time, and low land use. In the case of air transportation, it is difficult to find a technology meeting all these requirements. Besides, air transportation demand is expected to increase globally and existing capacities might meet their limitations soon. In particular, this holds for mid-range to long-haul flights, where a transition from jet fuel to hydrogen or electric energy is not feasible with technologies available in the foreseeable future and the fast scaling up of sustainable aviation fuel availability is challenging. Therefore, depending on the use case, different technologies and aircraft types (fixed wing, lighter-than-air) could be employed to carry out flights in a more climate-friendly and affordable manner while expanding existing capacities to address the expected global growth in air transportation.
Especially, lighter-than-air aircrafts (airships) using batteries and solar cells as an energy source could present a viable alternative for certain mission profiles in addition to the services of the currently available fixed wing types (see Prentice and Knotts Citation2016). Due to the use of batteries, solar cells, and electric motors, no direct CO2 or non-CO2 emissions are expected for such solar-powered airships. Similar emission reductions could be obtained when using a combination of hydrogen and fuel cells as suggested by Kamp (Citation2022). However, hydrogen produced from renewable sources is assumed to generally be more expensive than charging a battery directly through the electric power grid or solar cells, e.g. on the surface of an airship. More detailed analysis to understand the opportunities of hydrogen fuel cell powered or battery and solar cell powered or a combination of both (Manikandan, Vaidya, and Pant Citation2020) is needed, but outside of the scope of the current work. In the following, we are focusing on an airship design using batteries and solar cells as an energy source.
To understand and predict the range of possible applications of battery and solar cell powered airships and therefore the potential impact on the aviation sector, it is important to develop a methodology for estimating the flight time and related energy consumption and CO2 emissions for various use cases. The energy consumption could have an important impact on the operating costs and carbon emissions of the flight. To the authors’ knowledge, such airship designs were studied in detail for unmanned solar-powered vehicles or high-altitude applications (see Zhu et al. Citation2021; Zhang et al. Citation2021), but data for manned larger-scale airships for low cruising altitudes with a focus on sustainability and CO2 emissions are missing. This shortcoming is addressed in this work. The potential design of such a larger-scale solar-powered airship is only recently being made possible by the development of extremely lightweight flexible thin-film solar cells (see Beernink et al. Citation2007; Green et al. Citation2021). They allow to cover a large area of the surface of an airship, while limiting the additional weight trade-off. Another important development is the availability of highly efficient lithium-ion batteries. These batteries not only provide energy supply in addition to the photovoltaic cells, but also allow for energy storage for nighttime use or times of low solar radiation. Nevertheless, the main energy source for such airships is still the solar energy directly obtained from the integrated solar cells (see Khoury Citation2012, Chapter 20).
An airship route optimisation algorithm without solar cells was presented by Sarma, Hochstetler, and Wait (Citation2007). However, more complex simulation methodologies are required to consider solar irradiation and battery optimisation, which, to the authors’ knowledge, has not been developed yet. Therefore, in this paper, a new method is presented to optimise battery size, battery use during day and night, and time of departure, in order to reduce flight time for a hypothetical new generation of solar-powered airships.
The paper is organised as follows. Section 2 describes the design of the hypothetical airship, which is considered in this work. In particular, it is described how novel solar cells and batteries are included. Section 3 presents a new methodology of route and battery optimisation, which leads to a more sustainable airship. In order to analyse the airship operation, use cases and corresponding simulation results are presented in Section 4. Section 5 discusses the results with respect to sustainable energy and land use.
2. Airship, solar cells, and battery
Airships can be characterised by rigid and non-rigid frames. Here, rigid framed airships are analysed due to their higher resistance to unfavourable weather conditions (see Zeppelin Citation1908), which is considered to be an important factor for mid-range and long-haul applications. To estimate parameters like the airship’s weight, data from the airship LZ 129 (see Dörr; Kleinheins Citation1996) are used. The sizes of this airship are: length 246.7 m, width: 41.2 m, and height: 41.2 m.
An important parameter affecting flight time of an airship is its drag coefficient. The drag coefficient of the airship Lotte was studied in detail and published in Bock and Knauer (Citation2003), its value being cw = 0.04. Estimations of other drag coefficients are given in Lee et al. (Citation2021). By Table 4.5.3 in Khoury (Citation2012), the drag coefficient of the airship LZ129 is 0.06. This value is certainly larger than the value one can obtain for an optimised airship with integrated solar cells. Our simulations showed that an airship with a slightly flatter surface leads to improved harvesting of solar energy. However, assessing how such a construction influences the drag coefficient and other physical parameters of the airship is outside the scope of this work. Therefore, the classical LZ 129 design is selected.
Since lightweight constructions significantly improved in the last 90 years, one can assume that many parts of a new large airship would be much lighter than in the past. For example, in Khoury (Citation2012), it was estimated that a modern aluminium construction of LZ 129 and LZ 130 would reduce the weight of the frame by 10 t. The basic weight of these airships was 118 t. Thus, a basic weight of 108 t is a realistic assumption. The configuration of the motors and the propellers are taken from the airship LZ129 (see Dörr). These are four motors, each one operating a propeller with a diameter of 6.54 m with 3200 kW maximal total power. However, electric motors with an efficiency of 95% each are chosen instead of diesel motors. The electric motors are assumed to be lighter than the earlier used diesel engines. On the other hand, additional weight for lightweight pressurised cabins (if applicable) or electrical equipment might have to be added. One can assume that both changes in weight balance each other out.
In addition to the basic weight of the airship, the weight of the solar cells and the battery as well as the payload has to be considered. The hypothetical airship is equipped with thin film photovoltaic cells on the surface and recent battery developments are included in this work.
There are several kinds of thin film solar cells which are suitable for airship applications. Confirmed efficiency records of such types of solar cells are 11.7% for organic solar cells on a submodule (see Distler, Brabec, and Egelhaaf Citation2020), 22.6% for Perovskite on a cell (see Peng et al. Citation2021), and 10.2% for amorphous Silicon on a cell (see Matsui et al. Citation2015). These types of solar cells are potential candidates for future airship application, since they can be produced on lightweight and flexible substrates. The weight of these solar cells is about 100 g/mm2 (see Zeppelin Citation1908). In this work, data of Copper Indium Gallium Selenide (CIGS) thin film solar cells are selected, since they are commercially available and have optimal properties for a potential use on airships. In particular, they are flexible, lightweight, and highly efficient. For larger airships, a high efficiency of the solar cells is an important requirement, due to the relatively small ratio of the surface’s area to the airship’s volume comparing to the one of smaller airships. Whereas for smaller airships, a low weight of the solar cells is the most important requirement.
This work focuses on the advantages of a larger airship and therefore the following parameters based on Wada et al. (Citation2001) and Company Solar Cloth, Technical Specification Sheet (Citation2021) are chosen:
efficiency of CIGS thin film solar cells: 17.6%,
total area covered with solar cells: 13.203 sqm,
weight of solar cells per sqm: 0.5 kg/sqm, and
total weight of solar cells: 6.6 t ≈ 7 t.
The weight of future batteries is difficult to estimate. In Buchmann (Citation2016), the energy density of batteries is given by 240 Wh/kg. However, based on data from Sarma, Hochstetler, and Wait (Citation2007), Nitta et al. (Citation2015), and Hepperle (Citation2021), one can estimate that future batteries will have a higher energy density. For example, LiNi0.8Co0.15Al0.05O2 in commercial cells has a specific capacity of 200 mAh/g, where the average voltage is 3.7 V. Therefore, the capacity of the lithium-ion battery was chosen to be 3000 kWh, such that the minimal true air speed is at least 50 km/h even during the night in order to be able to navigate the airship. However, for most of our simulated examples, the minimal true air speed was more than 70 km/h. Furthermore, our simulations showed that choosing a 30% reduced capacity of the battery does not significantly decrease the flight time. The reason is that a smaller capacity not only decreases the speed during the night, but it also increases the speed during the day, when the battery is fully charged. Furthermore, it is assumed that the energy density of the battery in relation to usable energy is 300 Wh/kg, the battery efficiency for charging and discharging is 86%, the maximal charge and discharge power is 2000 and 3200 kW, and the total weight of the battery is 10 t.
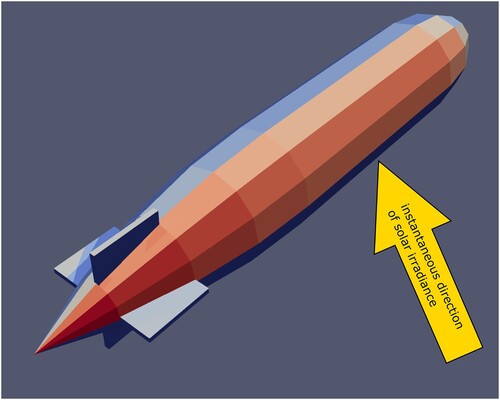
Using the above design parameters, shows the schematic of the simulated solar-powered airship shape and expected areas with various grades of collected energy by solar cells on the surface. Solar cells are placed at surfaces with upward normal vector. Simulation results of are taken for a flight between New York and London in March.
Figure 1. Solar-powered airship shape. Red for the calculated expected highest energy collection potential and blue for the calculated expected lowest energy collection potential.
The chosen weight of the expected payload is presented as follows. The lifting gas is assumed to be a combination of helium and mainly hydrogen, the way it was originally planned for the LZ 129 (see Kleinheins Citation1996). The volume of the lifting gas of LZ 129 was 190,000 m3. However, considering the total volume of about 230,000 m3, one can assume that a modern construction allows a lifting gas of 195,000 m3. Using the barometric formula, this leads to a buoyant force that could lift between 189 and 129 t depending on the studied travel altitude between 2000 and 5600 m. and show the corresponding maximal load and the maximal number of passengers. Here, the average mass of baggage is assumed to be 100 kg per passenger plus around 20 kg (ICAO Citation2009). Furthermore, the weight of the interior design like sleeping cabins is assumed to be 180 kg per passenger, which leads to 300 kg in total per person. The results in and assume conventional buoyant lift. However, modern airship design can aerodynamically attain a significantly higher lift (see Khoury Citation2012). Therefore, a flight height of 5600 m for 100 passengers might be possible, when additional aerodynamic lift can be achieved.
Table 1. Assumed maximal load and number of passengers depending on travel altitude based on conventional buoyant lift.
Table 2. Assumed maximal payload for the cargo use case.
In the case of freight transportation, a very low travel time is not as decisive as it is for passenger transport. Therefore, a low altitude can be chosen for freight transportation, since this allows a higher maximum payload. However, for passenger transport short travel time is often favourable. Therefore, in certain cases a higher travel altitude might be useful, as it is shown in Section 3.2.
The number of passengers and crew members of the LZ 130 is around 100. The British airship R100 had 100 passengers and 50 crew members (see Zeppelin Citation1908). However, the maximal travel altitude was lower, since these airships had to carry a large amount of fuel. Therefore, a larger number of passengers up to 200 is nowadays reasonable at the cruising altitude of 2000 m, when travel time is shorter and sleeping cabins are not needed, like for the investigated use case from Madrid to Las Palmas.
3. Route and battery simulation and optimisation methodology
To determine for which applications an airship is potentially suitable, it is important to first obtain the approximate flight time and related energy consumption. Then, other parameters like operating costs and emissions can be estimated. The flight time is assumed to be influenced by several factors like the shape of the airship, travel route, departure time, weather conditions like wind, and the use of the battery, in particular charging and discharging cycles. In order to take into account these large number of physical effects a new software including new algorithms was developed, which simulates the flight of a mainly solar-powered airship between a user-defined origin and destination. The new algorithms optimise the travel route and battery use in order to reduce travel time. The simulations showed that the newly developed algorithms are important in order to obtain a low travel time.
In this work, it is assumed that the battery of the airship is fully charged before the start of the trip, using the national electricity grid of the country of origin. Therefore, the maximal energy capacity of the battery accounts for an external energy supply. The energy provided by the solar cells during the trip does not lead to additional costs for the airship operator. These considerations imply that a suggested route and battery have to take into account an optimal charging strategy by photovoltaic energy and discharging of the battery for a best-case scenario. Furthermore, the thrust of the airship has to be balanced in order to guarantee a minimal flight velocity. The boundary conditions of the simulations are:
minimal true airspeed of the airship: 50 km/h,
departure day and time, and
coordinates of departure and destination point.
Historic weather data from July 2019 were used to calculate the flight time. These data were taken from the Global Forecast SystemFootnote1 in GRIB format (General Regularly-distributed Information in Binary form, see Stull Citation2016; Newman Citation2019). These data include wind strength and direction at different altitudes. For future travel route optimisations, data have to be taken from weather forecast. Another relevant factor for the flight time is the solar irradiation. This irradiation depends on the position of the sun and the location of the airship. To calculate this time-dependent solar irradiation correctly, the air mass and refraction have to be taken into account (see Koenen Citation2019; Young Citation1994). The earth curvature and the rotation of the earth have been considered as well, while the influence of clouds has not been accounted for. A difficulty in treating the influence of clouds is that the prediction of the effective solar irradiation due to clouds on the surface of the photovoltaic cells is highly uncertain. Clouds lead to both absorption and scattering of solar light. Since the photovoltaic cells on the surface of an airship are not evenly aligned in the same direction, in certain cases clouds could even increase the effective solar irradiation on the surface of the photovoltaic cells. Furthermore, the influence of clouds on effective solar irradiation decreases with altitude. Using the above considerations and data, the flight time calculation is performed in three steps:
Step 1. Discrete optimal route calculation. The shortest route is calculated using the A* path search algorithm. The vertices of the corresponding graph are a grid related to the data in GRIB format. The edges are the connections to the nearest nine vertices. Additionally, suitable edges are inserted in the direction of strong local winds (see Wagner Citation2020). The weights of the edges are the flight time from one vertex of the edge to the other vertex. The flight time is estimated by the velocity of the wind at edge and a pre-estimated thrust. The calculation of this thrust includes an estimation of the battery state of charge and the estimation of the position of the sun. Furthermore, the flight altitude is chosen such that weights of the edges are minimal. The result of this calculation is a pre-estimation of the shortest route from departure to destination point.
Step 2. Smoothing of the shortest route. Using the shortest route of Step 1, the location of the vertices of this route is optimised to reduce the flight time. shows the simulated travel route of a solar-powered airship from New York to London (blue) and London to New York (green) in March. The solid line corresponds to a maximal flight altitude of 3200 m and the dashed line to a maximal flight altitude of 5600 m. The vector field shows the wind direction and the velocity at an altitude of 5600 m. The simulation algorithm includes optimisation of the flight altitude (see ). Regulatory safety margins have to be considered in future work.
Step 3. Battery optimisation. Using the shortest route of Steps 1 and 2 charging and discharging of the battery is optimised to reduce the flight time. For this purpose, the position of the sun must be accounted for. In general, the battery is charged, if solar irradiation is strong enough. Furthermore, the battery is discharged in order to guarantee optimal speed. A global optimisation is obtained by a simulated annealing algorithm and a gradient search algorithm. Again, regulatory safety margins have to be considered in future work.
Figure 2. Simulated travel route of a solar-powered airship.
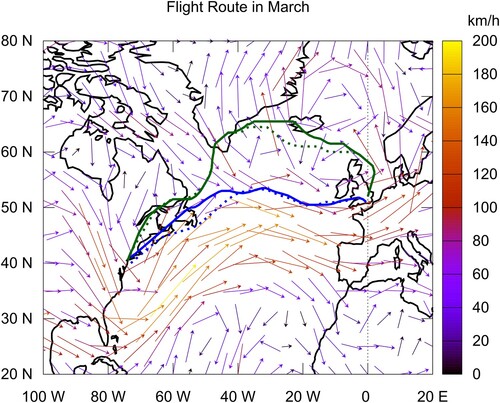
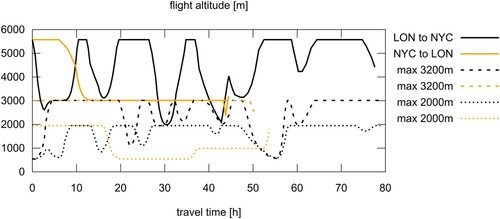
Figure 3. Simulated optimal flight altitude for travel in March between New York and London.
and present the resulting charging and discharging progress of the battery for a round-trip from London to New York.
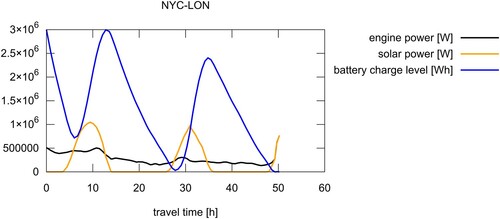
Figure 4. Battery charge level, engine power and power obtained by solar cells. Flight from London to New York in March. Maximal travel altitude 3200 m.
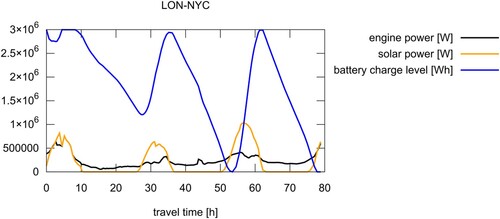
Figure 5. Battery charge level, engine power and power obtained by solar cells. Flight from New York to London in March. Maximal travel altitude 3200 m.
4. Use cases and simulation results
The methodology described in Section 3 allows to calculate the flight time for a domestic, mid-range flight from Madrid (MAD) to Las Palmas (LPA), Gran Canaria in Spain, and a longer flight from London (England, LON) to New York City (USA, NYC). The shortest flight route from MAD to LPA is assumed to be 1760 km and from NYC to LON 5566 km, respectively. These are considered representative of typical flight routes for which new technologies in lighter-than-air technology could be of use, since these flights cannot be replaced easily – for example by high-speed trains – and currently available battery technology does not allow for all-electric heavier-than-air technology to be employed for a larger number of passengers. Furthermore, the selected routes were considered to be in a high demand for passenger and freight transportation (IATA World Air Transport Statistics (WATS) Citation2019).
Simulated flight times for each month of the year are depicted in and . Like for heavier-than-air conventional aircrafts, the travel time for the NYC-LON trip can significantly be reduced for a flight from west to east using the winds at higher altitude (see ). However, the travel time of a solar-powered airship is additionally influenced by solar irradiation, which is stronger in summer than in winter. This leads to a longer travel time and additionally to a different travel route in winter, as depicted in . Average values of the travel time per year are given in . In particular, a flight operated with a solar-powered airship from New York to London lasts 48 h on average, which implies 2 days and 2 nights, at a maximal altitude of 5600 m. The average travel time for a flight from London to New York was found to be 76 h, which means 3 days and 3 nights, at a maximal altitude of 5600 m. A lower flight altitude leads to longer travel times in case of a flight from New York to London. and depict in more detail the flight data for a flight between London and New York at a maximal altitude of 3200 m. The true airspeed is about 100 km/h on average, but it can reach up to 150 km/h. Furthermore, it never drops below 50 km/h, even during the night flight, which is one of the boundary values defined in Section 3. The highest speed over ground of up to 180 km/h is obtained by an optimal travel route downwind. Since this cannot be obtained along the whole route, wind speed and true airspeed do not exactly sum up to speed over ground. The simulations show that choosing an optimal flight route () and travel altitude () significantly reduces travel time. Furthermore, optimised charge level of the battery is important for an efficient energy consumption (see and ). The battery is mainly charged during the day and discharged overnight. In , one can see that the solar power is not a smooth function. The reason is that the absorbed sun radiation by the solar cells of the airship depends on the flight direction, which is influenced by the wind direction. This means that strong side winds can force the airship to rotate. Then, solar irradiation from front and back leads to a lower absorbed power than irradiation from one side.
Figure 6. Simulated flight times of an airship depending on the month of the year 2019. Travel route between London (LON) and New York (NYC).
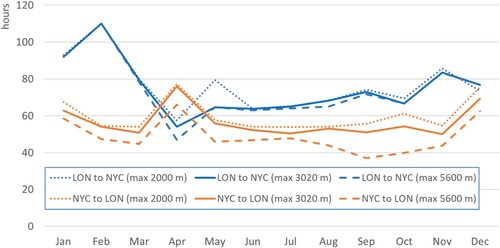
Figure 7. Simulated flight times of an airship depending on the month of the year 2019. Travel route between Gran Canaria (LPA) and Madrid (MAD).
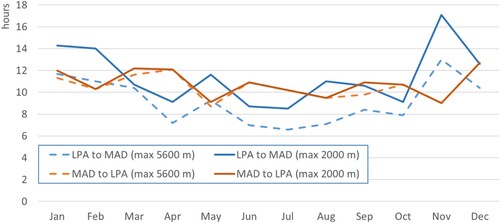
Figure 8. Simulated travel route of a solar-powered airship in January (winter, blue line), April (spring, green line), July (summer, orange line) and October (autumn, brown line), between New York and London (left) and London to New York (right). The maximal travel altitude is 3020 m.
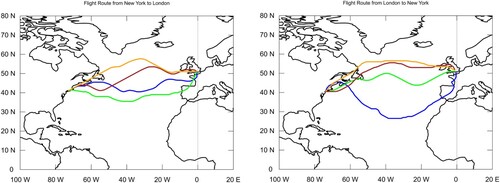
Figure 9. Simulated true air speed and speed over ground for a flight from London to New York. The wind speed is obtained from a database of the year 2019. Maximal travel altitude is 3020 m.
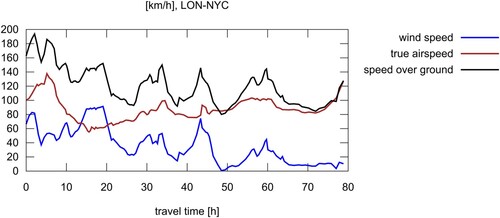
Figure 10. Simulated true air speed and speed over ground for a flight from New York to London in March. The wind speed is obtained from a database of the year 2019. Maximal travel altitude is 3020 m.
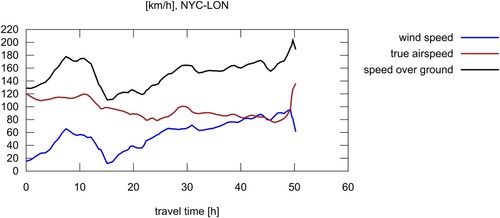
Table 3. Average travel times between New York (NYC)–London (LON) and Madrid (MAD)–Gran Canaria (LPA) by a solar-powered airship.
For a mid-range flight, for example from Madrid to Gran Canaria, the average travel time ranges between 9.5 h for travelling at an altitude of 5600 m and 13.2 h for travelling at an altitude of 2000 m (see ). However, it can reach up to 20 h in winter and drop down to 7 h in summer, due to the travel time under one day. Consequently, the flights could be taken at about 2000 m and a basic airship configuration could be chosen, without the need for added cabin pressurisation or oxygen supply.
5. Sustainable transportation
5.1. Land use and infrastructure requirements
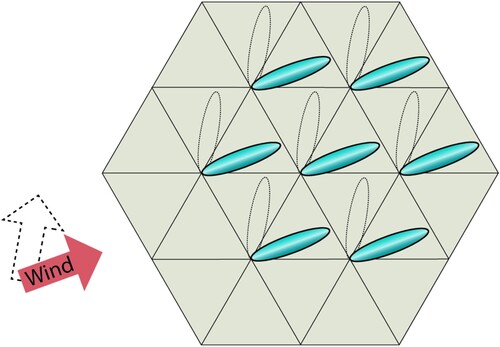
The land use of an airship essentially consists of the parking space it requires. Terminal space for the passenger waiting area, security checks and other ground operations can be limited to a minimum and are almost negligible compared to the airship parking space. Furthermore, the expected downwash of an airship is considered very low and therefore approaching the airship for boarding is considered safer for passengers and ground crew compared to heavier-than-air aircrafts. Here, open air parking places are assumed, since these need less infrastructure investments. Open air parking of airships is mostly obtained through parking bars fixing the airship only at its front (see Khoury Citation2012; Sarma, Hochstetler, and Wait Citation2007; Zeppelin Citation1908). A suitable construction can guarantee a movable fixation at the back of the airship, so that even a large number of airships is aligned with the wind direction. Now, a minimal land use is obtained through parking bars located at the corner points of a grid of equilateral triangles. The edge length of these triangles has to be a little bit larger than the length of the airship. Therefore, the edge length of each equilateral triangle is assumed to be 270 m. depicts the concept of such an outside parking space construction for n = 2 triangles at each edge of the hexagon parking place. Such a parking construction requires
(1)
(1)
Figure 11. Outside hexagon parking space construction for a large number of airships for n = 2 triangles at each edge of the hexagon.
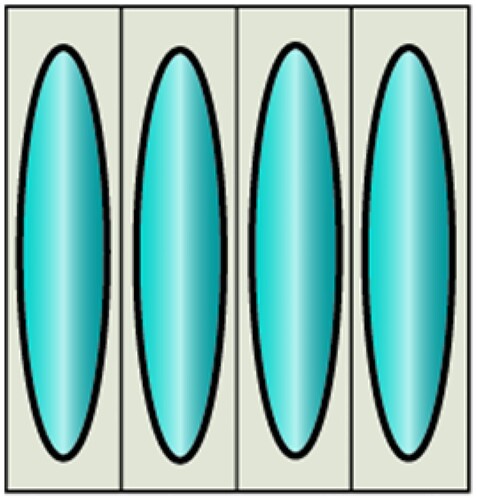
for each airship for a large number of airships. Observe that a hexagon parking construction must only partially consist of a built-up area, the rest being grass area. Therefore, the potential land-use-change (LUC) needed might be low or even positive regarding the amount of CO2 stored in the respective piece of land. In addition to open space parking, hangars are needed for maintenance and inspection (see ). This kind of parking is more expensive to build, but it has a lower land consumption, because the airships are not moving with the wind. The size of such a hangar is In this paper, the parking spaces are assumed to be a combination of hexagon-free space parking and hangars. Additionally, space is needed for landing, terminals, and access roads. The space for landing is a circular area with a radius of 500 m for our hypothetical airship design and access roads can be created around the hexagonal parking lot. This results in the following estimated land consumption for a selected number of airships:
free space hexagon parking (n = 5): 5,800,000 m2 for 61 airships
parking in hangars: 390,000 m2 for 25 airships
landing site: 785,000 m2 for 1 airship
access roads: 420,000 m2
terminals: 40,000 m2
Figure 12. Parking in a hangar.
Therefore, an average area of is needed for each airship in our envisioned configuration. This yields the following first estimation of land use:
land use of cargo airships: 0.0011 km2/t and
land use of passenger airships: 365 m2/pax – 730 m2/pax.
By , a reasonable assumption is that an airship carries 200 passengers in case of a mid-range flight and 100 passengers in a long-haul flight.
5.2. Comparing CO2 emissions and transportation costs with other means of transportation
The simulation results in allow to estimate transportation costs and land use of solar-powered airships and to compare these costs with those obtained by other means of transportation. The first result of the simulations is that an airship can perform 345 / 2.5 = 138 long-haul flights NYC-LON per year and 345 mid-range flights MAD-LPA per year, on average. This includes 20 days of downtime for maintenance, inspections and bad weather. Using the results in Section 3, this leads to the land use shown in , where data for conventional transportation are taken from Allekotte et al. (Citation2021). In order to calculate specific CO2 emissions, the embodied emissions of electricity generation are accounted for according to the ISO standards of life cycle analysis. In case the electricity is sourced from the grid, a global average value of 120 g/MJ in 2020 is used for the GHG emission intensity of electricity (ICAO LTAG Report Citation2022). For wind energy generation this leads to a greenhouse gas (GHG) emission intensity of 3.1 and 11.1 gCO2e/MJ for photovoltaic energy generation, in 2020. ICAO assumes that the global average carbon intensity value for jet fuel is 89 gCO2e/MJ. shows the CO2 emissions on per passenger or per tonne basis for a conventional international civil aviation aircraft (heavier-than-air) and our hypothetical airship operation. The values presented for a conventional aircraft powered by aviation fuel are obtained from ICAO Carbon Calculator (Citation2022). The energy consumption for the airship is assumed to be constant to the initial battery loading from the grid. Especially for the long-distance flights, solar-powered airships are found to have about 120 times lower CO2 emissions per km than conventional aircrafts, which still amounts to about 24 on a per passenger km basis. For large vehicles like buses or trucks of to 40 t CO2 emissions can be up to about 29.3 gCO2/p km, which is lower than the value for conventional aviation but still around a factor of 8 higher than for the solar-powered airship (Allekotte et al. Citation2021). Similar results are presented for long-distance trains of 33.2 gCO2/p km. Freight transportation buses or trucks up to 40 t are found to generate about 95.6 gCO2/t km and long-distance trains around 18.5 gCO2/t km (Allekotte et al. Citation2021). Both values are lower than for conventional aviation but considerably higher than for the investigated solar-powered airship ().
Table 4. Comparison of land use requirement for air transportation.
Table 5. Comparison of CO2 emission and land use for air transportation.
Besides CO2 emissions operating costs play a major role in aviation. presents energy consumption costs for conventional aircraft and for solar-powered airship. For the calculation, electricity prices for industry use are considered. These prices vary lesser than for residential use and are more stable across countries. On a global level, industrial electricity prices in 2020 still vary between under 30 and 240 USD/MWh (IEA Citation2019). A world average of 103 USD/MWh is used. For liquid hydrogen only electricity generated from wind and photovoltaic panels is considered, the minimum selling price therefore being assumed to be 0.058 $/MJ. For aviation fuel, a minimum selling price of 0.0322 $/MJ is assumed (ICAO LTAG Report Citation2022). shows that the energy prices for the solar airship are considerably lower than those for conventional aviation. Furthermore, even in case of a hydrogen-powered airship like advertised in industry (Clipper H2 Citation2022), the costs per ton-mile are estimated to be from USD 0.177 to 0.247 per ton-mile for distances between 1000 and 6000 miles. The solar-powered airship exhibits an advantage in energy consumption costs.
Table 6. Energy consumption prices for operating conventional aircraft and the solar-powered airship.
6. Conclusion
The transportation costs and CO2 emissions can significantly be reduced by a solar-powered airship. In case of passenger transport, CO2 emissions of a solar-powered airship are about 5% of the emissions of a conventional aircraft. In case of cargo transport, this value is about 1.4% in case of a midrange flight and less than 1% in case of a long-haul flight. Additionally, one can expect a considerable reduction in energy consumption costs. These are about 2.5% in case of passenger transport and less than 1% in case of cargo transport. Furthermore, a flight using a solar-powered airship does not produce any combustion-related emissions. Only before departure a small amount of CO2 emissions can be detected, when providing energy from the electric power grid for charging the battery. On the other hand, the flight time increases by a factor of 3 for a mid-range flight and by an average factor of 6 for a long-haul flight. In particular, one can expect a flight from New York to London to last about 2 days and a flight from London to New York around 3 days. This travel time might be acceptable for most freight transportation and it is faster than for sea transport. But even for passenger transport, specific use cases might be of interest and could provide solutions to improve environmental outcomes for the aviation sector. This is an interesting alternative to conventional air transport, since travelling in an airship is much more comfortable than in a conventional aircraft. LZ 130, for example, was equipped with a large dining room and a large common room. Furthermore, a comfortable twin room was available for each passenger (see Zeppelin Citation1908; Dörr), which allowed for a pleasant adjustment to the different time zones between the points of departure and arrival thus reducing jet lag.
This work aims to open up discussion on alternative modes of air transport for certain mission profiles, rather than to provide a final solution for airship use.
Disclosure statement
No potential conflict of interest was reported by the author(s).
Notes
References
- Allekotte, M., H. Althaus, F. Bergk, K. Biemann, W. Knörr, and D. Sutter. 2021. Umweltfreundlich mobil!. Dessau: Umweltbundesamt.
- Beernink, K., S. Guha, J. Yang, A. Banerjee, K. Lord, G. DeMaggio, F. Liu, et al. 2007. “Lightweight, Flexible Solar Cells on Stainless Steel Foil and Polymer for Space and Stratospheric Applications”. Proceedings of the 19th Space Photovoltaic Research and Technology Conference, NASA Technical Reports Server (NTRS).
- Bock, J. K., and B. Knauer. 2003. Leichter als Luft. Transport- und Trägersysteme: Ballone, Luftschiffe, Plattformen [English: Lighter than Air Transportation and Carrier Systems]. Hildburghausen: Frankenschwelle.
- Buchmann, I. 2016. Batteries in a Portable World: A Handbook on Rechargeable Batteries for Non-Engineers. Richmond: Battery University.
- Clipper H2. 2022. November. https://h2clipper.com.
- Company Solar Cloth, Technical Specification Sheet. 2021. www.solar-cloth.com/technology.
- Distler, A., C. J. Brabec, and H.-J. Egelhaaf. 2020. “Organic Photovoltaic Modules with New World Record Efficiencies.” Progress in Photovoltaics. doi:10.1002/pip.3336.
- Dörr, W. E. Das Zeppelin-Luftschiff “LZ129”, 80(13), Zeitung des VDI, 1036.
- Green, M. A., E. D. Dunlop, J. Hohl-Ebinger, M. Yoshita, N. Kopidakis, and X. Hao. 2021. “Solar Cell Efficiency Tables (Version 58).” Progress in Photovoltaics. doi:10.1002/pip.3444.
- Hepperle, M. 2021. “Electric Flight - Potential and Limitations.” Proceedings of AVT-209. Workshop on Energy Efficient Technologies and Concepts of Operation. https://elib.dlr.de/78726/.
- IATA World Air Transport Statistics (WATS). 2019. “Electronic 2 Year Airline Data.” Download–Code IATA9443-63.
- ICAO. 2009. “Available Capacity and Average Passenger Mass.” ICAO STA/10-WP/5, https://www.icao.int/Meetings/STA10/Documents/Sta10_Wp005_en.pdf.
- ICAO Carbon Calculator. 2022. https://www.icao.int/environmental-protection/Carbonoffset/Pages/default.aspx.
- ICAO LTAG Report. 2022. https://www.icao.int/environmental-protection/LTAG/Documents/ICAO_LTAG_Report_AppendixM5.pdf.
- IEA. 2019. “Global Energy and CO2 Status Report 2019.” https://iea.blob.core.windows.net/assets/23f9eb39-7493-4722-aced-61433cbffe10/Global_Energy_and_CO2_Status_Report_2018.pdf.
- Kamp, J. 2022. “Freedom Fuel.” Kamp Solutions, 9, 22–30.
- Khoury, G. A. 2012. Airship Technology. Cambridge: Cambridge Press.
- Kleinheins, P., Hrsg. 1996. Die Grossen Zeppeline, Die Geschichte des Luftschiffbaus. Düsseldorf: VDI Verlag.
- Koenen, S. 2019. “Simulation eines Solar-Wind-Luftschiffes.” Bachelor’s thesis, Friedrich-Alexander Universität Erlangen-Nürnberg. www10.cs.fau.de/publications/theses/2019/Koenen_BT_2019.pdf.
- Lee, D. S., D. W. Fahey, A. Skowron, M. R. Allen, U. Burkhardt, Q. Chen, S. J. Doherty, et al. 2021. “The Contribution of Global Aviation to Anthropogenic Climate Forcing for 2000 to 2018.” Atmospheric Environment 244: 117834. doi:10.1016/j.atmosenv.2020.117834.
- Manikandan, M., E. Vaidya, and R. S. Pant. 2020. “Design and Analysis of Hybrid Electric Multi-Lobed Airship for Cargo Transportation.” Sustainable Energy Technologies and Assessments 51. doi:10.1016/j.seta.2021.101892.
- Matsui, T., A. Bidiville, K. Maejima, H. Sai, T. Koida, T. Suezaki, M. Matsumoto, K. Saito, I. Yoshida, and M. Kondo. 2015. “High-efficiency Amorphous Silicon Solar Cells: Impact of Deposition Rate on Metastability.” Applied Physics Letters 106. doi:10.1063/1.4907001.
- Newman, C. 2019. “Optimal Control of a Solar Airship.” Bachelor’s thesis, Friedrich-Alexander Universität Erlangen-Nürnberg. www10.cs.fau.de/publications/theses/2019/ Newman_BT_2019.pdf.
- Nitta, N., F. Wu, J. Tae Lee, and G. Yushin. 2015. “Li-ion Battery Materials: Present and Future.” Materials Today 18 (5): 252–264. doi:10.1016/j.mattod.2014.10.040.
- Peng, J., D. Walter, Y. Ren, M. Tebyetekerwa, Y. Wu, T. Duong, Q. Lin, et al. 2021. “Nanoscale Localized Contacts for High Fill Factors in Polymer-Passivated Perovskite Solar Cells.” Science 371 (6527): 390–395. doi:10.1126/science.abb8687.
- Prentice, B. E., and R. Knotts. 2016. “Sustainable Transportation: Airships Versus Jet Airplanes.” Canadian Transportation Research Forum. Proceedings Issue: 51st, Annual Meeting.
- Sarma, A., R. Hochstetler, and T. Wait. 2007. “Optimization of Airship Routes for Weather.” 7th AIAA Aviation Technology, Integration and Operations Conference. American Institute of Aeronautics and Astronautics. doi:10.2514/6.2007-7880.
- Stull, R. B. 2016. Practical Meteorology. An Algebra-Based Survey of Atmospheric Science. Vancouver: The University of British Columbia.
- Sustainable Mobility for All. 2017. Global Mobility Report 2017: Tracking Sector Performance. Washington, DC: Creative Commons Attribution CC BY 3.0, 2017. ISBN 978-0-692-95670-0.
- Wada, T., Y. Hashimoto, S. Nishiwaki, T. Satoh, S. Hayashi, T. Negami, and H. Miyake. 2001. “High-efficiency CIGS Solar Cells with Modified CIGS Surface.” Solar Energy Materials & Solar Cells 67: 305–310. doi:10.1016/S0927-0248(00)00296-8.
- Wagner, S. 2020. “Optimale Routenplanung für einen Solarzeppelin.” Masters’s thesis, Friedrich-Alexander Universität Erlangen-Nürnberg. www10.cs.fau.de/publications/theses/2019/ Wagner_MT_2020.pdf.
- Young, A. T. 1994. “Air Mass and Refraction.” Applied Optics 33 (6): 1108–1110. doi:10.1364/AO.33.001108.
- Zeppelin, G. 1908. “Erfahrungen beim Bau von Luftschiffen. Vortrag gehalten auf der 49.” Hauptversammlung des Vereines Deutscher Ingenieure zu Dresden am 29. Juni 1908, Berlin: Julius Springer. www.forgottenbooks.com.
- Zhang, L., W. Zhu, H. Du, and M. Lv. 2021. “Multidisciplinary Design of High-Altitude Airship Based on Solar Energy Optimization.” Aerospace Science and Technology 110. doi:10.1016/j.ast.2020.106440.
- Zhu, W., B. Zhang, L. Zhang, Y. Xu, and K. Yang. 2021. “Spatial Path Analysis for High-Altitude Solar-Powered Airship with Maximum net Energy.” Aerospace Science and Technology 117. doi:10.1016/j.ast.2021.106922.