
 ?Mathematical formulae have been encoded as MathML and are displayed in this HTML version using MathJax in order to improve their display. Uncheck the box to turn MathJax off. This feature requires Javascript. Click on a formula to zoom.
ABSTRACT
In this study an extended model is proposed based on government subsidies to support the development of new energy power plants. Accordingly, the profit of this production unit is increased with the reduction of CO2 emissions. In addition, the results show that the plan to sell carbon dioxide emissions threshold helps in financial subsidies saving. Also, the increase in factors such as energy production capacity, electricity market price, CO2 emission threshold price and fluctuations in investment costs can lessen the amount of dedicated subsidies by the government. Also, the increase in parameters such as investment costs and fluctuations in electricity prices, and the price of CO2 emission thresholds leads to the dedication of more encouragement subsides.
1. Introduction
Energy is of great significance for improving social and economic well-being, and is essential for most industrial and commercial products, and is a key factor in alleviating poverty, improving human well-being, and raising living standards (Zare et al. Citation2022; Toolabi Moghadam, Sarani, et al. Citation2022). Energy plays a key role in moving towards sustainable development (Toolabi Moghadam, Soheyli, et al. Citation2022; Toolabi Moghadam et al. Citation2023). Today, the global energy industry is undergoing major changes that shifts to green growth solutions and a circular economy (Chen and Liu Citation2006). The renewable energies term refers to the types of energy that, unlike non-renewable or fossil energy, are the source of that type of energy that can be regenerated by nature in a short period of time (Chen and Liu Citation2006; Zare and Tavakolpour-Saleh Citation2021). In other words, renewable energy is a resource that can be easily replaced after consumption (Scarlat et al. Citation2015). In recent years, due to the decline of non-renewable energy sources, renewable energies have received a lot of attention. The first significant trace of renewable energy in the world dates back to 2006, when about 1.8% of global energy consumption came from renewable sources of energy. The share of biomass has traditionally been around 13%, which was mostly for heating and 3% for hydropower. The remaining 4.2% includes small hydropower plants, modern biomass, wind energy, solar energy, geothermal energy, and biofuels, which have expanded rapidly in recent years (Cifor et al. Citation2015). Concerning global warming and climate change, and to ensure global energy security, countries realised that, the need for sustainable energy production and consumption is increasingly vital (Li, Li, and Guo Citation2020). In 2017, oil export was responsible for about 80% of Iran's total exports. Iran has a high potential for employing renewable energies such as hydropower, wind, solar, geothermal and wave energies. Therefore, the use of these resources to reduce consumption is absolutely necessary (Li, Li, and Guo Citation2020). The renewable energies have long been neglected for a variety of reasons, such as the abundancy of oil and natural gas reserves. Unfortunately, the share of renewable resources in Iran's energy portfolio is not significant. In 2018, only 0.74% of the total energy consumption in Iran was produced from renewable sources (Economy Watch Citation2010).
Despite the high importance of using renewable energies, utilising them demands a great amount of investment; yet, investors are reluctant to invest in a renewable energy project due to the problems of capital recovery, and high investment risk (Weibel and Madlener Citation2015). Based on the government incentive policies to promote investment in the renewable energy sector with the aim of reducing consumers’ share of payment within the ideal range, or the need to demand a certain amount of renewable energy, renewable energy subsidies play a crucial role. They have a great deal to do in increasing private sector investment in the production and exploitation of renewable energy (Casisi et al. Citation2015; Batlle Citation2011). On the other hand, the market-based electricity pricing mechanism, and the uncertain trend of investment costs in the long run affect the decision-making process of renewable energy investors. Therefore, the uncertainty and the complexity of the investment environment has greatly increased (Zhang, Zhou, and Zhou Citation2014; ShahNazari et al. Citation2014). Another factor that affects the amount of private sector investment in renewable energy is the reduction of carbon dioxide emissions. Thus, investors can sell a part of this privilege and thus return a part of their capital. Therefore, reviewing government support policies to increase the motivation of private sector investors is an issue that must be addressed scientifically and is considered as a futuristic approach. With regards to what is mentioned so far, it is necessary to investigate the affecting factors on the amount of dedicated subsides to the private sector by the government. Because the optimal dedication of subsidies through the government will motivate investment. To this end, in this paper, the effect(s) of each affecting factor on the amount of dedicated subside by the government is investigated, which enables the Iranian government to optimise the distribution of energy subside more purposefully, through a better understanding of these factors. Indeed, the main objective of this paper is that in accordance with the conditions and regulations in Iran, an extended model is proposed based on government subsidies to support the development of new energy power plants by means of the budget allocated to the CO2 emission limit, as well as the electricity market price and investment cost for renewable energy.
2. Literature review
As mentioned in the introduction, government subsidies to production units are one of the most common ways to attract investment in the field of renewable energy. But the subsidy itself must be both attractive to the investors and does not impose excessive conventional costs on the government. To this end, governments should employ optimal approaches for dedicating subsidies to production units. One way for optimising subsidies is to pay for the privilege of CO2 emissions. This factor means that generating units can receive a fee for producing less CO2 gas than a certain allowed threshold; in other words, they will have the right to sell the privilege of CO2 emissions. In this regard, a number of research were conducted for reviewing and presenting models that can predict the amount of government subsidies. To this end, Zhang et al. (Citation2017) have studied and evaluated the investment of renewable energy by considering unknown factors such as CO2 price, non-renewable energy cost, investment cost, and electricity market price. The results show that, if an advanced CO2 market can be employed, then investing in renewable energy in China will be attractive, otherwise the Chinese government should not expect to attract investors to build renewable energy units in the short run. In another study, Zhang, Zhou, Zhou, et al. (Citation2016) suggested that the Chinese government should use feed-in tariffs for renewable energy units (FITs) (is a policy designed to support producers by supporting the development of renewable energy sources by offering guaranteed and above market prices), and taking into account the fluctuations of CO2 prices in the policy of subsidising them, will attract more investment in this area. They also found that feed tariffs in 30 provinces of China ranged from 0.68 RMB / kWh to 1.71 RMB / kWh and the average level was 1.01 RMB / kWh. Thus, they concluded that the sub-regional tariff feed levels announced in 2013 were no longer appropriate and should be adjusted as soon as possible. In another study, Zhang, Zhou, Ding, et al. (Citation2016) proposed a model for investing in biomass energy production in China. In the proposed model, the aim was to take into account the uncertainty in the market price of electricity and CO2 prices. Similarly, this study also emphasises that the implementation of the carbon emissions trading plan theoretically helps to improve the value of the investment and advances the most likely optimal investment time. On the other hand, it is pointed out that the current CO2 price is not enough to advance the most probable optimal investment time, any further. Benalcazar, Suski, and Kamiński (Citation2020) investigated the effects of government subsidies on energy production investment in the optimal design of micro-grid systems. In this paper, the effects of various government supportive policy measures on the optimal structuring of small networks, in the island state are investigated. To this end, by providing a computational model, they conducted a sensitivity analysis and evaluation of the impact of government subsidies and electricity prices on the balanced cost of electricity in different systems. Martelli, Freschini, and Zatti (Citation2020) presented a model for optimising renewable energy subsidies and carbon taxes for small and medium-sized multi-energy systems using two-tier planning. At the top level of the model, as the government minimises its support costs, sets subsidies to meet the target of reducing emissions; at the low level, to design and operate energy production optimally, with respect to the costs, subsidies, and the amount of investment made, the multi-energy system manufacturing companies make decisions in a way that minimises their overall costs, i.e. total investment and operating costs.
As mentioned in the presented articles and shown in , the goal of the researchers was to provide qualitative and quantitative models in order to realise the amount of government subsidies to investors. In this regard, a number of research were conducted based on the conditions and regulations of different countries such as China. But if the presented models in these articles are to be applied to Iran, it is necessary to expand the practiced models of this area so that they can be modified according to the conditions and regulations of Iran. Accordingly, in this paper, a real and quantitative extended model is proposed based on the expansion of the model presented in the articles (Zhang, Zhou, Zhou, et al. Citation2016; Zhang et al. Citation2017). To evaluate the optimal level of subsidies required by investors in renewable energy in Iran. Compared to previous studies, this paper examines uncertain and long-term changes in the investment environment more realistically using a stochastic process to describe CO2 prices, electricity market prices, and investment costs. In fact, this extended model can examine whether it is cost-effective to support renewable production units in terms of carbon emission threshold, as well as government subsidies, and what the optimal subsidy should be in order to achieve this goal. To this end, the two indicators of project value and threshold value were used to obtain the optimal subsidy. The amount of subsidy obtained in this article is more realistic than the amount of subsidy obtained by the NPV method because it can compensate the net cost and opportunity caused by uncertainty at the same time. The proposed model is applied to evaluate the subsidy for a solar photovoltaic power generation project in Iran. With respect to this process, efforts are made to address challenges such as the optimal level of subsidy for renewable energy investors and the impact of related factors on the subsidy. The following reviews problem modelling, and policy-making based on government incentive schemes scenario for the use of renewable energy in electricity generation.
Table 1. A review of the conducted studies.
The structure of article is organised as follows. In Section 2, the state of the literature is reviewed in order to determine the existing gaps in knowledge on government support and renewable energy development. Section 3 deals with mathematical modelling based on government support scenarios. Indeed, in this section, a mathematical model is presented on how to implement government incentive policies to develop renewable energy, encourage investors, and extract the desirable results from various projects in Iran. The results (obtained from the mathematical model presented in section 3) are reviewed and evaluated in Section 4, and finally, in Section 5, conclusions are presented.
3. Mathematical modelling based on the governmental supportive policies
Politics plays an important role in promoting renewable energy. Most governments have developed multi-subsidy policies for improving market mechanisms, optimising social resource allocation, and stimulating investment (renewable energy subsidy policies) (Srivastava, Van Passel, and Laes Citation2018). Although most subsidy policies were able to boost the development of renewable energy sources, their effectiveness was not entirely satisfactory. On the one hand, some government subsidy policies were not sufficient enough to boost investment, thus, renewable energy were not fully utilised, and the installed capacity was far below demanded level. On the other hand, in some areas, the level of subsidies is far above the required level, which may have led to excessive subsidies, market turmoil, excessive financial pressure, and the neglection of technological innovation (Wang and Fan Citation2021); so, the question is, are the current subsidy policies really effective? Therefore, in this section, a mathematical model is presented on how to implement government incentive policies to develop renewable energy, encourage investors, and extract the desirable results from various projects in Iran. The presented model in this paper, includes the value of a renewable energy generation project (), the amount of investment stimulus threshold for electricity generation from renewable energy (
), and the amount of government support subsidy (
). It should be noted that the proposed model in this paper is derived from the development of the model presented in the articles (Zhang, Zhou, and Zhou Citation2014; ShahNazari et al. Citation2014). According to the proposed model, the objective function is presented in Equation (1), which determines the amount of government support through subsidies. In other words,
is equal to the optimal level of government subsidy required for renewable energy investors for the entire project life ($/kWh). Also,
and
are According to this equation, the amount of subsidy is equal to the difference between the net present value of the project, and zero if the net value of the project is negative; otherwise, there is no need to provide subsidies (Zhang, Zhou, and Zhou Citation2014; ShahNazari et al. Citation2014).
(1)
(1)
(2)
(2)
Equation (2) expresses the value of a renewable energy project. Project value is defined as the expectation of the project, which depends on various factors such as the amount of discount, project cash flow over the year, project life, and the amount of cost invested in the project.
Equation (3) determines the threshold value to make the investment decision. If the value of project V is not less than the threshold value of
, the investment decision is cost effective and practical. Yet, based on the actual options method, the subsidy is the difference between the threshold value
and the project value
. The energy industry is currently in a stage of continuous development. The energy industry is currently in a stage of constant development. In this case
is always higher than
. Traditionally, if the net present value of the project is not less than zero, the investment made is cost-effective and practical. In opposite, if the net present value of the project is less than zero, the investment is uneconomical and should be ignored.
(3)
(3)
Equation (4) expresses cash flow (). In general, the cash flow
in year
is denoted by the variable
, where
equals the binary variable representing the use of the carbon dioxide emissions sales policy Explaining the sale of carbon dioxide emissions it can be pointed out that the government has set an allowed emission threshold for all electricity producers; by emitting less carbon dioxide than the allowed threshold, the unadmitted amount of the allowed emission can be sold for a price, and the income be put into use.
(4)
(4)
Equation (5) expresses the revenue from the sale of electricity at time t. In this regard, the market price of electric energy (), unit production capacity (
), household-service energy consumption rate (
), and installed capacity of electricity generation equipment from renewable energy (IC) is the revenue from the sale of electricity.
(5)
(5)
Equations (6) to (12) express the parameters and relationships in Equation (4), i.e. the cash flow ().
(6)
(6)
(7)
(7)
(8)
(8)
(9)
(9)
(10)
(10)
(11)
(11)
(12)
(12)
In Equation (6) is equal to the unit production capacity at the time t (kWh). Also,
equals to the cost of operating and maintaining equipment at the time t. On the other hand,
, the income from not selling the allowed carbon dioxide emission at the time t and
is equal to taxes. In this regard,
represents VAT. Equation (13) shows the inverse demand function, which uses the linear demand function to simplify the model. In this equation,
is the size of the electricity market, which is a constant value, and
is equal to the amount of energy produced.
is the market price of electricity. To meet the demand, it is assumed that both renewable energy producers generate energy from wind turbines, solar panels, biomass, etc., and fossil power plants are able to supply the required amount of fuel through coal, natural gas, etc. These energies are identified by the (R) and (D), respectively.
(13)
(13)
Equation (14) presents the amount of profit of a renewable energy producer based on the amount of support subsidy received.
(14)
(14)
Considering the fact that, for energy suppliers, the cost of producing fossil and renewable energy is known, the final profit for each company can be determined by making a derivation (Equation 15) of Equation 14 from (considering relation
):
(15)
(15)
Accordingly, by applying mathematical operations, it is finally possible to obtain government subsidies for renewable energy companies, which is presented in Equation (16):
(16)
(16) Notably, Equation (16) is an extended model of Equation (1) that is presented in this paper. By the help of this equation, the effect of parameters such as CO2 emission limit on the amount of government subsidies can be examined.
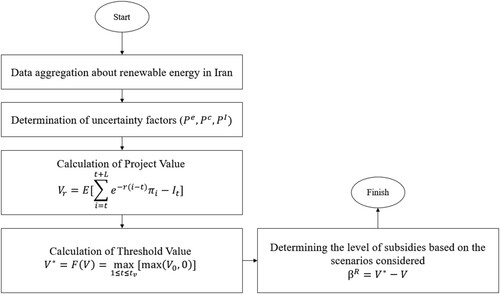
shows the flowchart of the method and steps of model implementation:
Figure 1. The flowchart of the proposed method.
4. Computational results
As mentioned, this paper examines the factors affecting the amount of dedicated subside by the Iranian government. To this end, in the following, the data related to Iran are used for renewable energy investment, and the impact of carbon dioxide emission factor. The data are presented in . Also, presents the key technical and economic parameters.
Table 2. Uncertainty factor parameters.
Table 3. Key technical and economic parameters of the project (https://www.satba.gov.ir/en/home).
To implement the proposed method based on the data used in Iran, the following criteria are used to analyse sensitivity.
- Price CO2
- Electricity prices
- Discount rate
Therefore, in the following, the results of coding the model equations in MATLAB software version 2019 are presented for both scenarios: with and without considering the cost of carbon dioxide emissions. and show the change in subsidy amount, threshold and project value based on the change in unit production capacity with and without carbon emission rights.
Figure 2. Unit production capacity without considering carbon emissions.
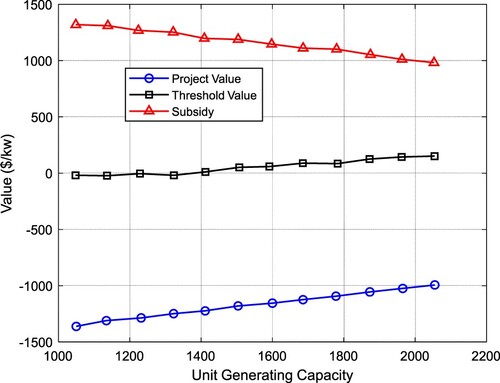
Figure 3. Unit generating capacity (with CO2 emission).
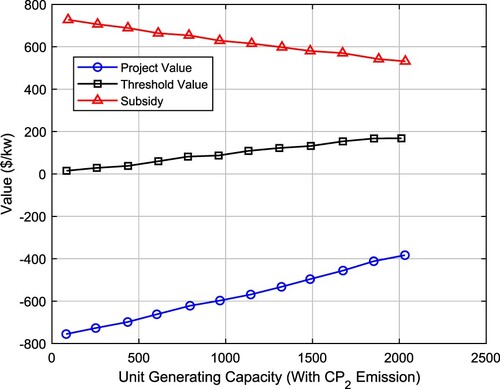
A comparison of and shows that, when the carbon emissions are not taken into account (i.e. the investor is not paid for producing less carbon than the threshold), the government will pay more subside. The biggest concern of the solar power generation investors is the waste of capital. Therefore, the calculated subsidy should encourage investors and prevent the overthrow of the investment. Under such a subsidy condition, investors can invest quickly. The subsidy calculated by the real options method is higher, as it may generate net costs and opportunity costs at the same time. Compared to both scenarios, implementing a commercial carbon emission scheme reduces the subsidy required regardless of the used method.
4.1. The effect of different parameters on the amount of subsidy, threshold and value of the project
To examine the changes in subsidies under the unit production capacity, we analyse the electricity market price, CO2 price, and discount rate. Thus, in the following figures, these factors are based on two scenarios with (i.e. to pay the investor for producing less carbon than the allowed threshold), and without (i.e. the investor is not paid for producing less carbon than the allowed threshold) considering CO2 emissions. Therefore, the analysis of electricity market price sensitivity in both scenarios is examined first. This is shown in and (according to Equations (1–3) and (13)).
Figure 4. The impact of electricity market prices in a state without considering carbon emissions.
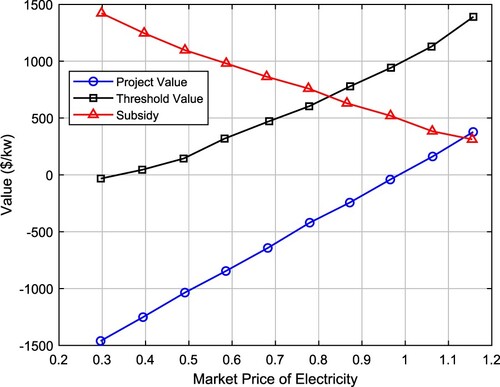
Figure 5. The impact of electricity market prices on carbon emission considerations.
and show that rising electricity market prices have prompted the government to pay subsidies. It also raises the price of the electricity market. Another factor that affects the amount of subside in relation to the price of the electricity market is the fluctuations of the electricity price. These fluctuations can directly affect the amount of subside. The outcomes given in refs (Sijm, Neuhoff, and Chen Citation2006; Chen et al. Citation2008) confirm the results of and . and show the effect of electricity price fluctuations on the amount of subside.
Figure 6. The impact of electricity market prices in the state without considering carbon emissions in the state of market price fluctuations.
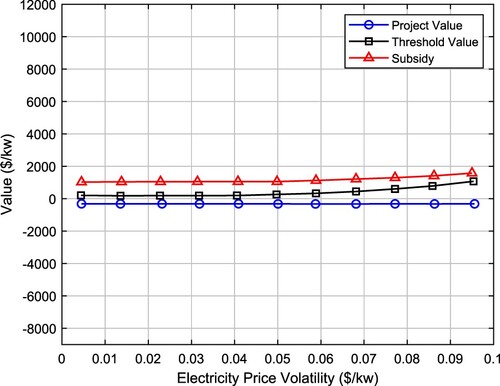
Figure 7. The effect of electricity market prices under the consideration of carbon emissions condition in the event of market price fluctuations.
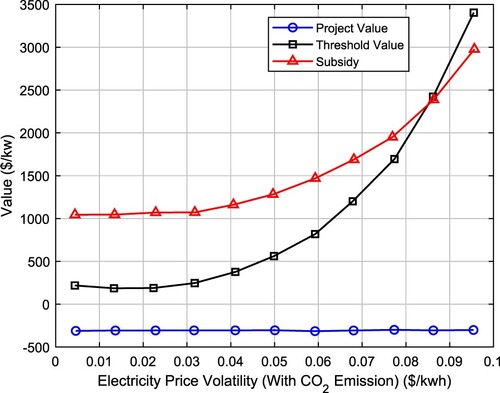
As shown in the comparison presented in and , it can be seen that electricity price fluctuations directly increase subsidy. Because it creates a concern among investors that these fluctuations can reduce the amount of profit and income from their investment. Therefore, this will increase government subsidy to keep investors motivated. On the other hand, and show that power fluctuations have no effect on the project value because the effect of electricity fluctuations has already been included in the project value and therefore these fluctuations will not affect the project value. Also, a comparison of and shows that, when the government pays investors for reducing carbon emissions, the slope of increasing subsidy for electricity fluctuations will increase. Because in the event of power fluctuations, the government will have to subsidise power generation units so that their profit margins are secured and they are willing to invest sustainably.
The important issue of this study of fluctuation rates is that, the rate of project price has always been relatively constant, and fluctuations have led to increased subsidies from the government side.
Finally, we examine the discount rate. The discount rate is a constant value which increases its amount of subsidy (Equations (1) to (3)), since it is applied exponentially in the objective function. Discount is a method of estimating the present value or current value of cash flows, which can be received at a specified time in the future. In other words, the theory and the logic of this method is based on the fact that ‘a dollar today is worth more than a dollar tomorrow’, which seems obvious for various reasons, including inflation and the cost of keeping money, etc. In fact, for a number of reasons, discount is a way of expressing the value of money that can be received in the future. Thus, the discount rate directly affects the amount of investment; in fact, the higher the rate, the lower the current value, which will naturally challenge the investor. Thus, as the discount rate increases, the investor will face the challenge of not making a profit from the project. Therefore, the government considers it necessary to increase the dedicated subsidies to increase the enthusiasm of investors in the projects and maintain them at a desirable level; this can be seen in .
Figure 8. Impact of discount rate on subsidy amount, threshold and project value.
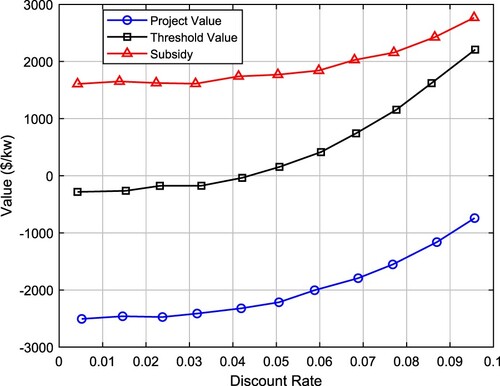
shows the effect of considering carbon dioxide emissions and their price as aids to the investor in obtaining the right to sell it.
Figure 9. Impact of discount rate considering carbon emissions.
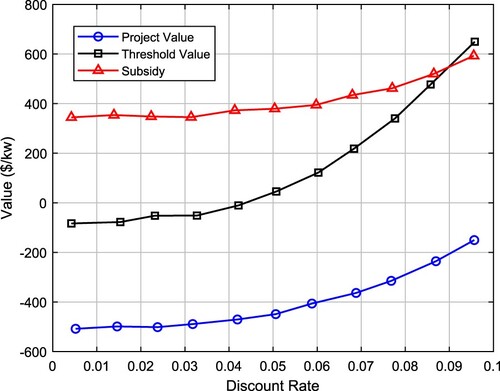
As expected, the consideration of carbon dioxide prices led to a reduction in subsidies for investors. This is because the increase in the discount rate is accompanied by an increase in sales of carbon dioxide emissions, which leads to a reduction in subsidies due to the sale fee. Because the discount rate itself increases the subsidy, the impact of carbon dioxide emissions has somewhat mitigated this increase; this can be concluded by comparing and . The obtained results from and can be verified using outcomes in refs (Luo et al. Citation2014; Sarkar Citation2012).
Next, the effect of fluctuations in CO2 emissions and CO2 prices is examined. This is shown in by considering the fluctuations.
Figure 10. Impact of CO2 price fluctuations on subsidy amount, threshold and project value.
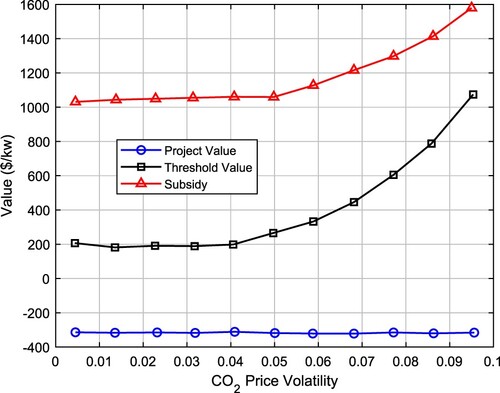
As can be seen in , the fluctuations in the price of carbon dioxide have increased the amount of subsidy. The point that we have made in these studies is that increasing the sale of carbon dioxide emissions leads to a reduction in government subsidies to shareholders. But when the price of carbon dioxide fluctuates, the amount of subsidy also increases due to reduced investor interest.
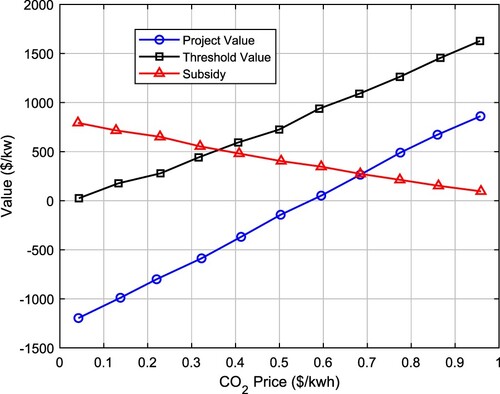
As mentioned in this paper, equation (16) (which is the extension of equations (1) to (3)), can examine the effect of CO2 emission threshold on the amount of government subsidy; this is shown in . The results given in ref (Zhang, Zhou, Ding, et al. Citation2016) clearly confirm the outcomes of .
Figure 11. The impact of CO2 emission reduction price.
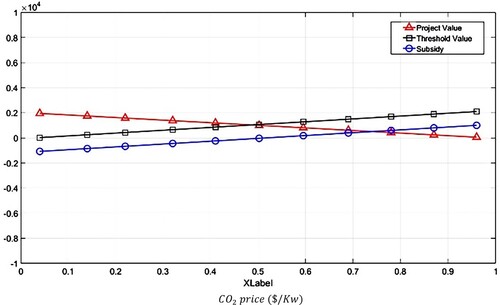
shows, how the intended subsidy varies with CO2 price changes. It is also observed that increasing the price of CO2 reduces subsidy. Because, an increase in CO2 rates will reduce the investment risk due to higher profit margins, and as a result, the government will need to provide less subsidy to investors. Accordingly, the average reduction rate is equal to 14.36%. Therefore, it can be concluded that the price of carbon dioxide gas is inversely proportional to the cost of subsidy.
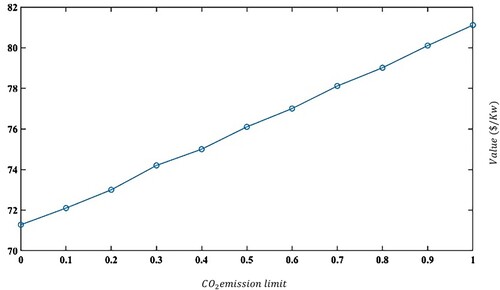
Finally, with the help of equation (15), the final profit of a renewable production unit can be calculated based on the rate of reduction of CO2 emission threshold. In this regard, in , the final profit for a production unit with a nominal capacity of 1 MW is depicted based on the CO2 emission threshold. As can be seen in , the final profit of this production unit is increased with the reduction of CO2 emissions as much as possible; this can be advantageous for the renewable energy production units to be more profitable. Bear in mind, the calculations shown in are based on the purchase rate of electricity in Iran from solar renewable units (https://www.satba.gov.ir/fa/guidance/guidance/guidance1-).
Figure 12. The effect of CO2 emission threshold value on the profitability of a company with a nominal production of 1 MW in Iran.
It is worth mentioning that the results obtained in this article have been confirmed by several institutions in Iran (https://moe.gov.ir/Rules_and_Regulations_Issue/برق, http://en.tbtb.ir).
compares the obtained main results, for the implementation of the project in Iran based on the estimated costs. This table shows the amount of subsidy obtained using the two methods NPV (net present value of the project) (Fleten et al. Citation2016) and RO (return on assets) (Liu et al. Citation2021) for both cases of considering the carbon emission price and not considering it.
Table 4. Main results (dollars per kilowatt).
It is important to note that this method has limitations. Indeed, the presented model is used when the data is continuous and will not perform well when the data is discrete. Also, the presented model is useful for countries whose governments have the plan to reduce greenhouse gas emissions and are willing to pay for it and provide subsidies to reduce CO2, it does not apply to governments that do not provide subsidies.
5. Discussion and conclusion
In this paper, an extended model is proposed for optimising the dedicated subsides for the production of renewable energies by taking the effect of CO2 price, conditions and Iranian regulation factors into consideration. To this end, the effects of factors such as CO2 price (i.e. the payment to the investors for the emission of CO2 less than the allowed threshold), electricity price, the discount rate of the dedicated subside by the Iranian government, were examined. Then, Two indicators, namely project value and threshold value, were used to obtain the desired level of subsidy. By using this model the optimal level of subsidy can reach the desired, and less erroneous level. By using the sensitivity analysis, Subsidy dynamics under the influence of various changes in unit production capacity, electricity market price, CO2 price and investment cost were obtained. The proposed extended model was prepared for the experimental evaluation of determining the optimal subsidy for a PV solar energy project in Iran; the analyses showed excellent results. First, the results show a favourable level of subsidies in two business plans of considering carbon emission and not considering its emission. Carbon emission justification scheme, which may benefit renewable energy investors, helps with reducing subsidies. Second, the subsidy calculated by the real option method is higher than the method calculated by the NPV method because the first method can calculate and spend the net cost and the opportunities simultaneously. Thus, the subsidy calculated through real options method is more beneficial. Third, increasing the unit production capacity, and electricity market price, can reduce subsidies by reducing the distance between the project amount and the threshold amount. Yet, the increase in the investment cost may lead to the increase in subsidy cost. The fluctuations in the electricity and CO2 price, may lead to the increase in subsidy, however, the fluctuations in investment costs may decrease the subsidy cost a little. Fifth, subsidies are easily influenced by related factors when considering a carbon trading scheme. In fact, with the help of the extended model for calculating the amount of dedicated subsidy by the Iranian government, it was concluded that increasing the price of CO2 will reduce the amount of dedicated subsidy, and this could be a positive step towards purchasing carbon emissions from the Iranian government. Also, in this paper, for the first time, with the help of the extended model, the profit rate of a production unit based on the CO2 emission limit was obtained. The results showed that, with the help of this factor, renewable production sites can be brought closer to profitability. According to this conducted study, the following suggestions are presented for the macro policy makings of the Iranian government:
- First, the Iranian government should not only be involved in the cost of research, development, and increasing the installed capacity to advance technological progress; but should also take the necessary measures to maintain the stability of the solar market, solar modules, and other components.
- Second, it is suggested to create an integrated global carbon trading market as soon as possible.
- Thirdly, since the investors competition can reduce their decision-making flexibility and threshold value. Thus, it is suggested to promote competition in the renewable energy industry.
Considering the existence of uncertainty in project costs, including maintenance and operational costs, its impact on the NPV value of the project and its justification is tangible. Therefore, considering the uncertainty in the project costs, the stable box optimisation method has been used to control the model and analyse it based on the model results. This model is developed based on the robust optimisation model presented by Ben Tal and Nemirovsky. Consider the following deterministic linear optimisation model.
(17)
(17)
The non-deterministic linear optimisation model, which includes a set of linear optimisation problems, is defined as follows.
(18)
(18)
In this model, parameters c and A are assumed to be variables in the non-deterministic set U. The vector x is a stable feasible solution for problem (18), if it can satisfy all the constraints with non-deterministic parameters belonging to the set U. The stable model of problem (18) is defined as follows.
(19)
(19)
The optimal solution of problem (19) will be the stable optimal solution for problem (17). This optimal solution satisfies the constraints of the problem for all possible data in the set U and guarantees the optimality of the objective function so that even in the worst case it does not exceed . Problem (19) is a semi-infinite linear optimisation problem and is considered infeasible from the computational point of view. However, for convex sets, it seems that the model (19) will become a convex polynomial problem that will be computationally feasible. In order to describe the robust model corresponding to model (19), the parameters of operating costs are assumed to be non-deterministic. It is assumed that each of these uncertain parameters can change within a defined bounded framework. The general form of this framework can be defined as follows:
(20)
(20) where
is the nominal value,
is the tth parameter of the vector ξ (it is an n-dimensional vector). Also, 2 positive values of
and ρ indicate the degree of uncertainty and the level of uncertainty, respectively. According to the above explanation, the stable model will correspond to the following model:
(21)
(21)
(22)
(22)
(23)
(23)
(24)
(24)
In the above controlled model, ρ represents the uncertainty rate. According to the results of the analysis, the impact of the uncertainty rate (operating costs) on the results of the proposed model is as described in .
Table 5. The effect of uncertainty rate on model results.
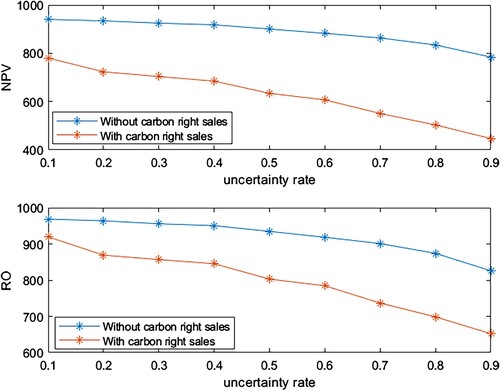
According to the results of the above table, it can be seen that with the increase in the uncertainty rate, due to the increase in operational costs and the decrease in net profit, the amount of NPV and RO has decreased in two cases with/without the sale of carbon rights. This shows that with a 90% increase in operating costs, the amount of NPV has decreased by 17.09% in the case of not selling carbon rights and by 41.26% in the case of selling carbon rights. shows the trend of NPV and RO changes in different uncertainty rates.
Figure 13. Changes in NPV and RO value of the project at different rates of uncertainty.
Also, the standard deviation resulting from the implementation of the robust box method in controlling operating costs is as described in .
Figure 14. Standard deviation of robust box method in NPV results.
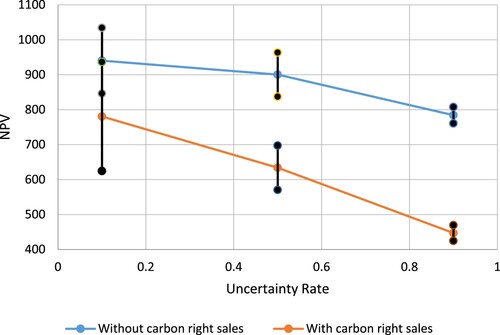
Based on the results of , it can be seen that although the higher uncertainty rate has led to a further decrease in the NPV value. But its standard deviation value is less than the definite state. Therefore, the higher the uncertainty rate, the lower the standard deviation of the results compared to the real world.
| Nomenclature | ||
| = | discount rate | |
| = | Project lifetime | |
| = | Tax | |
| = | Value added tax | |
| = | VAT rate (%) | |
| = | Corporate income tax (%) | |
| = | Cash flow per year | |
| = | Time investment cost | |
| = | Production cost in renewable power plants | |
| = | Income from the sale of electricity in time | |
| = | Income from non-sale of carbon dioxide emission allowances in time | |
| = | The cost of operation and maintenance of equipment in time | |
| = | Electric energy market price in time | |
| = | CO2 cost in time | |
| = | Unit investment cost in time | |
| = | Size of the electricity market | |
| = | Operation and maintenance unit in time | |
| = | Expressing the production capacity of the unit in time | |
| = | The amount of energy produced by the renewable energy plant | |
| = | The amount of energy production | |
| = | Expressing the amount of household-service energy consumption | |
| = | Installed electrical energy production equipment from renewable energies | |
| = | Aging rate of power generation equipment | |
| = | The ratio of the allowed amount of CO2 emission in the total CO2 emission | |
| = | The value of the investment belongs to the investors | |
| = | Optimal level of government subsidy required for renewable energy investment over the entire life of the project | |
| = | Threshold amount of investment movement | |
| = | Value project (expectation from the project) | |
Disclosure statement
No potential conflict of interest was reported by the author(s).
References
- Batlle, C. 2011. “A Method for Allocating Renewable Energy Source Subsidies among Final Energy Consumers.” Energy Policy 39 (5): 2586–2595. doi:10.1016/j.enpol.2011.02.027.
- Benalcazar, P., A. Suski, and J. Kamiński. 2020. “The Effects of Capital and Energy Subsidies on the Optimal Design of Microgrid Systems.” Energies 13 (4): 955. doi:10.3390/en13040955.
- Casisi, Melchiorre, Alberto De Nardi, Piero Pinamonti, and Mauro Reini. 2015. “Effect of Different Economic Support Policies on the Optimal Synthesis and Operation of a Distributed Energy Supply System with Renewable Energy Sources for an Industrial Area.” Energy Conversion and Management 95: 131–139. doi:10.1016/j.enconman.2015.02.015.
- Chen, W., and W. Liu. 2006. “Numerical Simulation of the Airflow and Temperature Distribution in a Lean-to Greenhouse.” Renewable Energy 31 (4): 517–535. doi:10.1016/j.renene.2005.04.015.
- Chen, Yihsu, Jos Sijm, Benjamin F. Hobbs, and Wietze Lise. 2008. “Implications of CO2 Emissions Trading for Short-Run Electricity Market Outcomes in Northwest Europe.” Journal of Regulatory Economics 34 (3): 251–281. doi:10.1007/s11149-008-9069-9.
- Cifor, Angela, Paul Denholm, Erik Ela, Bri-Mathias Hodge, and Adam Reed. 2015. “The Policy and Institutional Challenges of Grid Integration of Renewable Energy in the Western United States.” Utilities Policy 33: 34–41. doi:10.1016/j.jup.2014.11.001.
- Economy Watch. 2010. “Iran Export”. https://dotic.ir/cat/142
- Fleten, Stein-Erik, Kristin Linnerud, Peter Molnár, and Maria Tandberg Nygaard. 2016. “Green Electricity Investment Timing in Practice: Real Options or Net Present Value?” Energy 116: 498–506. doi:10.1016/j.energy.2016.09.114.
- Li, T., A. Li, and X. Guo. 2020. “The Sustainable Development-Oriented Development and Utilization of Renewable Energy Industry – a Comprehensive Analysis of MCDM Methods.” Energy 212: 118694. doi:10.1016/j.energy.2020.118694.
- Liu, Qian, Yan Sun, Linyao Liu, and Mengcheng Wu. 2021. “An Uncertainty Analysis for Offshore Wind Power Investment Decisions in the Context of the National Subsidy Retraction in China: A Real Options Approach.” Journal of Cleaner Production 329: 129559. doi:10.1016/j.jclepro.2021.129559.
- Luo, Chunlin, Mingming Leng, Jian Huang, and Liping Liang. 2014. “Supply Chain Analysis Under a Price-Discount Incentive Scheme for Electric Vehicles.” European Journal of Operational Research 235 (1): 329–333. doi:10.1016/j.ejor.2013.11.021.
- Martelli, E., M. Freschini, and M. Zatti. 2020. “Optimization of Renewable Energy Subsidy and Carbon Tax for Multi Energy Systems Using Bilevel Programming.” Applied Energy 267: 115089. doi:10.1016/j.apenergy.2020.115089.
- Sarkar, S. 2012. “Attracting Private Investment: Tax Reduction, Investment Subsidy, or Both?” Economic Modelling 29 (5): 1780–1785. doi:10.1016/j.econmod.2012.05.030.
- Scarlat, Nicolae, Jean-François Dallemand, Fabio Monforti-Ferrario, Manjola Banja, and Vincenzo Motola. 2015. “Renewable Energy Policy Framework and Bioenergy Contribution in the European Union – an Overview from National Renewable Energy Action Plans and Progress Reports.” Renewable and Sustainable Energy Reviews 51: 969–985. doi:10.1016/j.rser.2015.06.062.
- ShahNazari, Mahdi, Adam McHugh, Bryan Maybee, and Jonathan Whale. 2014. “The Effect of Political Cycles on Power Investment Decisions: Expectations Over the Repeal and Reinstatement of Carbon Policy Mechanisms in Australia.” Applied Energy 130: 157–165. doi:10.1016/j.apenergy.2014.05.040.
- Sijm, J., K. Neuhoff, and Y. Chen. 2006. “CO2 Cost Pass-Through and Windfall Profits in the Power Sector.” Climate Policy 6 (1): 49–72. doi:10.1080/14693062.2006.9685588.
- Srivastava, A., S. Van Passel, and E. Laes. 2018. “Assessing the Success of Electricity Demand Response Programs: A Meta-Analysis.” Energy Research & Social Science 40: 110–117. doi:10.1016/j.erss.2017.12.005.
- Toolabi Moghadam, Ali, Bahram Bahramian, Farid Shahbaazy, Ali Paeizi, and Tomonobu Senjyu. 2023. “Stochastic Flexible Power System Expansion Planning, Based on the Demand Response Considering Consumption and Generation Uncertainties.” Sustainability 15 (2): 1099. doi:10.3390/su15021099.
- Toolabi Moghadam, Ali, Esmaeil Sarani, Mehrdad Rezaie, Ebrahim Sheykhi, Mahdi Azimian, and Adil Hussein Mohammed. 2022. “Optimal Planning and Bidding Strategy for Wind Farms in Joint Balancing and Day-Ahead Energy Markets.” IET Renewable Power Generation 16 (15): 3299–3310. doi:10.1049/rpg2.12582.
- Toolabi Moghadam, Ali, Farideh Soheyli, Sareh Sanei, Ehsan Akbari, Hossein Khorramdel, and Mojtaba Ghadamyari. 2022. “Bi-Level Optimization of the Integrated Energy Systems in the Deregulated Energy Markets Considering the Prediction of Uncertain Parameters and Price-Based Demand Response Program.” Energy Science & Engineering 10 (8): 2772–2793. doi:10.1002/ese3.1166.
- Wang, Z., and W. Fan. 2021. “Economic and Environmental Impacts of Photovoltaic Power with the Declining Subsidy Rate in China.” Environmental Impact Assessment Review 87: 106535. doi:10.1016/j.eiar.2020.106535.
- Weibel, S., and R. Madlener. 2015. “Cost-Effective Design of Ringwall Storage Hybrid Power Plants: A Real Options Analysis.” Energy Conversion and Management 103: 871–885. doi:10.1016/j.enconman.2015.06.043.
- Zare, S., and A. Tavakolpour-Saleh. 2021. “Modeling, Construction, and Testing of a Diaphragm Thermoacoustic Stirling Engine.” Energy Conversion and Management 243: 114394. doi:10.1016/j.enconman.2021.114394.
- Zare, S., A. R. Tavakolpour-Saleh, A. Aghahosseini, and R. Mirshekari. 2022. “Thermoacoustic Stirling Engines: A Review.” International Journal of Green Energy, 1–23. doi:10.1080/15435075.2021.2021414.
- Zhang, Mingming, Dequn Zhou, Hao Ding, and Jingliang Jin. 2016. “Biomass Power Generation Investment in China: A Real Options Evaluation.” Sustainability 8 (6): 563. doi:10.3390/su8060563.
- Zhang, M., D. Zhou, and P. Zhou. 2014. “A Real Option Model for Renewable Energy Policy Evaluation with Application to Solar PV Power Generation in China.” Renewable and Sustainable Energy Reviews 40: 944–955. doi:10.1016/j.rser.2014.08.021.
- Zhang, M. M., D. Q. Zhou, P. Zhou, and H. T. Chen. 2017. “Optimal Design of Subsidy to Stimulate Renewable Energy Investments: The Case of China.” Renewable and Sustainable Energy Reviews 71: 873–883. doi:10.1016/j.rser.2016.12.115.
- Zhang, M. M., D. Q. Zhou, P. Zhou, and G. Q. Liu. 2016. “Optimal Feed-in Tariff for Solar Photovoltaic Power Generation in China: A Real Options Analysis.” Energy Policy 97: 181–192. doi:10.1016/j.enpol.2016.07.028.