
 ?Mathematical formulae have been encoded as MathML and are displayed in this HTML version using MathJax in order to improve their display. Uncheck the box to turn MathJax off. This feature requires Javascript. Click on a formula to zoom.
ABSTRACT
As one of the largest sources of CO2 emissions, the integration of non-carbon fuels in coal-fired power plants will significantly impact the global decarbonisation strategy. Hydrogen is a potential non-carbon fuel, and ammonia is a promising hydrogen carrier fuel. In this study, the effect of ammonia co-firing in a low-rank coal-fired power plant is thermodynamically modelled and evaluated in Aspen Plus V12.1. The integrated co-firing system is modelled in two different cases. The first case is made to maintain the combustion process, resulting in constant excess oxygen content in the flue gas. The second case is to minimise the fan modification in the power plant by maintaining the maximum air flow rate. The results show that increasing fraction of ammonia reduced CO2 and SOx emissions due to the decreasing coal fraction. NOx emission proportionally changes with the furnace temperature, which increases at constant excess oxygen case and decreases at constant airflow case. It was also shown that both cases’ boiler efficiency is relatively similar on the same ammonia fraction. The thermodynamic analysis provides an initial assessment of the implementation of ammonia co-firing in coal-fired power plants as an effort of decarbonisation in the energy sector.
| Nomenclature | ||
| Symbols | ||
| = | furnace area | |
| = | average emissivity furnace wall-flame system | |
| = | coefficient of average radiation temperature | |
| = | Higher Heating Value | |
| = | Moisture | |
| = | adibatic flame temperature | |
| = | thermal efficiency constant | |
| = | Partial pressure | |
| Subscript | ||
| = | As received | |
| = | Adiabatic flame | |
| = | Acid dew point | |
| = | dry | |
| = | Average gas | |
| = | Furnace exit gas temperature | |
| Abbreviation | ||
| HE | = | heat exchanger |
| WW | = | water wall |
| RH | = | reheater |
| ECO | = | economiser |
| PSH | = | primary superheater |
| SSH | = | secondary super heater |
| SEP | = | Vapour–liquid separator |
| SPLT | = | Split |
| MX | = | mixer |
| HPH | = | High-pressure heater |
| LPH | = | Low pressure heater |
| HPP | = | High-pressure pump |
| LPP | = | Low-pressure pump |
| HPT | = | High-pressure turbine |
| IPT | = | Intermediate pressure turbine |
| LPT | = | Low-pressure turbine |
1. Introduction
The growing concern about climate change emphasises the importance of a global transition to lower greenhouse gas (GHG) emissions (Pegels and Altenburg Citation2020). The global response to climate change threats was reflected in the Conference of the Parties 21 (COP21), also known as the Paris Agreement, in 2015, which resulted in a resolution to limit global temperature rise. Seven years after COP21, the COP27 in Sharm El Sheikh, Egypt. in 2022 was held to evaluate implementation. The realisation of a decarbonised society is a significant issue that is being widely debated, and the pressure to decarbonise is increasing in all fields, including the energy sector. Carbon dioxide (CO2) is the most prominent greenhouse gas (GHG) that affects our climate by generating a greenhouse effect that traps thermal radiation in the Earth’s atmosphere, raising temperatures and fostering adverse impacts such as melting ice caps, rising oceans, and plant loss (IPCC Citation2018). If emissions continue to climb until 2050, studies anticipate a world average temperature increase of around 1°C leading to 1.5°C (IPCC Citation2018).
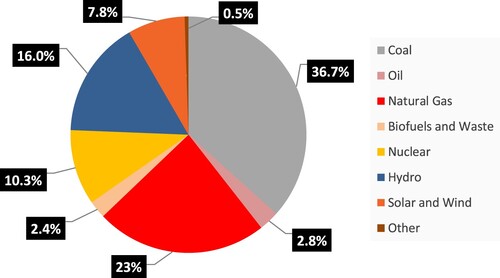
The energy sector is the most significant contributor to GHGs (EPA Citation2016). Currently, electricity generation by coal combustion, is by far the most dominant use of coal worldwide () accounting for approximately 36.7% of electricity generation or 9914448 GWh (Zhongyang and Michalis Citation2017; IEA Citation2021). Given its significant contribution to global emissions, power generation has a lower decarbonisation difficulty than other energy services (Davis et al. Citation2018). Therefore, the non-carbon fuel integration in the coal-fired power plant as one of the major power generation facilities will significantly impact the global decarbonisation strategy. From an economic and technical point of view, the integration of non-carbon fuel shall be performed gradually, allowing the existing facilities to be used with modifications.
Figure 1. Electricity production in the world (IEA Citation2021).
Among non-carbon fuels, hydrogen has a number of benefits, including high combustion performance, a broad range of production and utilisation methods, and high conversion efficiency (IEA Citation2019; Nikolaidis and Poullikkas Citation2017; Møller et al. Citation2017). While hydrogen has a very high gravimetric energy density (a lower heating value of 120 MJ/kg), it has an incredibly low volumetric energy density of only 0.0108 MJ/L (ambient conditions). As a result, hydrogen must be stored efficiently in various ways, including compressed, liquid, hydrides, adsorption, and reformed fuels.
Liquid hydrogen, methyl-cyclohexane, and ammonia have been studied as hydrogen carriers; techniques for utilisation are already developed (Juangsa et al. Citation2018; Iki et al. Citation2015; Valera-Medina et al. Citation2018; Valera-Medina et al. Citation2015). Ammonia has significant advantages in the well-established storage system and its direct utilisation as a fuel in the combustion system. The International Energy Agency (IEA) report on the strategies for renewable energy utilisation in the industrial sector also concluded that ammonia is one of the most attractive energy carriers with significant economic advantages (Philibert Citation2017). In addition, ammonia has the least cost for transportation either by ship or pipeline (The Royal Society Citation2020). Thus, ammonia carries great potential with promising applications in energy systems due to its high gravimetric and volumetric hydrogen densities, excellent storability, and carbon-free (Aziz, TriWijayanta, and Nandiyanto Citation2020).
Aside from being a potential fuel in the combustion system, ammonia has been used as one of the most important chemical commodities with a mature storage and global distribution network, with increasing importance to critical sectors of global society such as fertiliser production (Wan et al. Citation2021; Elishav et al. Citation2020; The Royal Society Citation2020). In terms of production, ammonia can also be produced exclusively from renewable energy sources, commonly known as green ammonia, triggering exploration as a route to the transition of ammonia as the next sustainable fuel solution for power generation (Flórez-Orrego, Maréchal, and de Oliveira Junior Citation2019).
Combustion of ammonia is basically the oxidation reaction of ammonia, resulting in nitrogen (N2) and water (H2O), as shown in reaction (1). Practically, oxygen content in the air is generally used for oxidiser, resulting in the reaction shown in reaction (2).
(1)
(1)
(2)
(2)
However, ammonia combustion has been known to have a higher possibility of NOx emissions increase. The alternative reaction that can occur during the combustion reaction of ammonia shows that NO species can be produced from ammonia combustion. The following reaction is a simple explanation of how NO can be formed during ammonia combustion, while a details explanation is currently being studied in order to reduce the formation of NOx during ammonia combustion.
(3)
(3)
In terms of the decarbonisation target, ammonia can help to reduce greenhouse gas emissions from coal-fired power plants through co-firing. While coal is a significant source of carbon dioxide (CO2) emissions, ammonia does not produce CO2 when burned. Using ammonia as a fuel source, power plants can reduce their carbon footprint and help achieve decarbonisation goals. Co-firing ammonia with coal in power plants also can help to diversify the fuel source. Ammonia is a fuel that can be produced from various feedstocks, including natural gas, renewable energy sources, and coal. Power plants can reduce their dependence on coal by incorporating ammonia into the fuel mix.
A number of studies of process simulation of ammonia-coal co-firing have been reported Kim, Kwak, and Yang (Citation2021) conducted a process simulation of ammonia-coal co-firing at an 870 MWe supercritical high-rank coal-fired power plant with constant excess oxygen and found that moisture loss reduces boiler efficiency. 600 MWe of high-rank coal-power plant has been simulated by Xu et al. (Citation2022). Xu et al. has result of decrease in the flue gas temperature under the excess air constant scenario. The flow rate of air must be reduced to maintained the excess air. Zhang et al. (Citation2020).
Several experiments of ammonia-coal co-firing have been performed and reported. Ammonia and coal combustion in the horizonal test furnace with capacity of 1 MWth has been done and resulted that the injection positions were found to effect NOx emissions (Yamamoto et al. Citation2018). Because the minimum NOx emissions are comparable to coal combustion without ammonia injection, it was assumed that ammonia served as a CO2-reducing agent as well as a fuel for effective heat release. IHI company has successfully conducted the experiment of ammonia co-combustion in pulverised coal boiler (Nagatani et al. Citation2020). Experimental results were obtained using a 10 MWth vertical facility and the experiment was carried out until the ammonia co-firing rate was 20 cal.%. It has been suggested that ammonia co-firing could reduce NOx emissions compared to coal firing by controlling operating conditions such as ammonia injection velocity or air ratio (Nagatani et al. Citation2020). Tamura et al. (Tamura et al. Citation2020) studied ammonia utilisation in a 1.2 MWth coal-fired furnace and concluded that ammonia could be burnt in a coal-fired boiler without ammonia slip. Various ammonia injection methods have been considered, and sidewall injection has been found to increase NOx emission due to less residence time for NOx reduction. At the large-scale system, Chugoku Electric Power has successfully demonstrated ammonia co-firing in Japan’s Mizushima power plant unit 2 with 156 MW output with a co-firing rate of 0.6% until 0.8% (Yoshizaki Citation2019). The experiment reduced CO2 emissions, and the metal temperature of heat exchangers, such as those in the superheater and reheater, remained relatively constant when compared to coal firing. The ammonia was completely burned and complied with the environmental standard (Yoshizaki Citation2019).
In this work, thermodynamic analysis is performed on ammonia-coal cofiring in coal-fired power plant to provide overall energy balance and initial estimation on ammonia fuel utilisation in coal-fired power plant decarbonisation. The boiler system of a commercial 220 MWe coal-fired power plant unit was selected as a research project to fill the above research objective. The simulation is carried out with Aspen PLUS V12.1 to understand and draw conclusions about the macro side of ammonia co-firing. The ammonia co-firing rate is varied in two cases, constant excess oxygen and constant airflow rate, in order to find the appropriate coal-fired power plant modification. The acid dew point temperature of the flue gas also estimated to confirm and evalutating Xu et al. (Citation2022).
The first part of this study focuses on the flue gas characteristics of ammonia co-firing in a low-rank coal-fired power plant until 100% of ammonia. The 220 MW of coal-fired power plant with lignite A coal is used as the object of the study. The conditions are similar to study by Xu et al. (Citation2022), which focused on pressured ammonia combustion eventhogh the coal and capacity used is different. Xu et al. (Citation2022) used 600 MW of coal-fired power plant with Subbituminous B coal as fuel. Radiation heat transfer at the boiler is simulated based on the Gurvich method. Boiler efficiency based on ASME PTC 2008 method (ASME Citation2008) is also be evaluated in order to develop an appropriate scenario of the ammonia co-firing in low-rank coal-fired power plant. Furthermore, the flue gas characteristics and boiler efficiency are compared to the previous study.
2. Method
2.1. General system
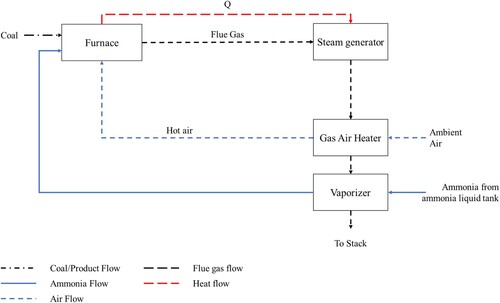
shows the basic schematic diagram of the ammonia co-firing system. Three main processes are involved: furnace, steam generator, and gas air heater. Coal and ammonia were combusted in furnace and mixed with hot air. The flue gas from the combustion was utilised as feed of the steam generator. In addition, the flue gas was fed into a gas air heater to raise the temperature of the surrounding air. The ammonia has higher HHV than low-rank coal; therefore, the flue gas was heated the liquid ammonia from atmospheric tank in vapouriser as heat recovery. The ammonia that is injected into the boiler must be a gas phase, so there will be no phase change. In the atmospheric tank, the ammonia is still in the liquid phase. Therefore, a vapouriser is needed. The ammonia is also pressured at 0.2 MPa based on Xu et al. (Xu et al. Citation2022). The tangential burner boiler with a dimension of 12,400 mm × 12,080 mm with a furnace height of 50,000 mm is used. The combustion mode is a premix, where the coal and ammonia is mixed in one injection.
Figure 2. Schematic diagram of the ammonia co-firing system.
2.2. Detailed system
This section explains a detailed system based on the process flow diagram shown in . The system was evaluated through a theoretical calculation and software modelling using Aspen PLUS ver. 12.1 (Aspen Technology, Inc.). To establish the model of the system, the following assumption were employed during the calculation, (1) the combustion process was divided into three sequential steps: pyrolysis of coal, burning, and ash removal; (2) all the blocks were in steady state operation; (3) air, ammonia, and coal were homogeneously mixed in the reactor; (4) elements of O, H, N, and S were vapourised into gas phase, and element of C was converted to pure carbon in the process of coal pyrolysis, while ash did not take part in the chemical reaction during combustion process; (5) carbon was reacted completely; (6) Radiation heat from furnace was used for wall tube completely and secondary superheater partially, (7) no pressure loss and heat loss.
Figure 3. Detailed boiler system of ammonia coal co-firing.
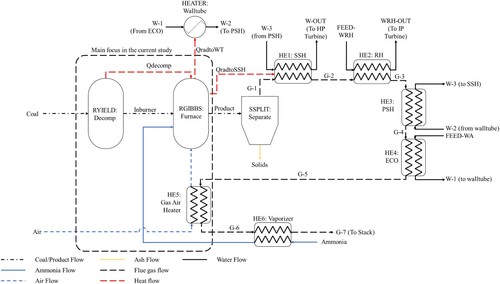
Firstly, the coal was decomposed in the DECOMP block (Ryield) by specifying the yield distribution according to the dry basis of coal ultimate analysis, proximate analysis, and dry basis of the heat of coal combustion. Using Fotran block, the decomposition products of coal, i.e. H2O, N2, O2, S, H2, Cl2, C, and Ash were calculated. Simultaneously, the heat of coal breakdown was transferred to the BURN block.
The BURN block (RGibbs) was used to simulate the combustion process of ammonia and coal. RGibbs calculates chemical and phase equilibrium by minimising the system’s Gibbs free energy. The main products of coal-ammonia combustion were H2O, N2, O2, S, H2, C (solid), CO, CO2, Cl2, HCl, NO, NO2, SO2, SO3, and NH3. Radiation heat from the wall tube and secondary superheater were carried to the BURN block.
In Aspen Plus, the RGibbs reactor uses a Gibbs energy minimisation method to model chemical reactions. To calculate NOx formation from combustion reaction, the RGibbs reactor takes into account the reaction mechanism, thermodynamic properties, and transport properties of the species involved in the combustion process. In general, the formation of NOx (NO and NO2) from combustion reactions is strongly influenced by the temperature and oxygen concentration. Overall, RGibbs reactor in Aspen Plus uses a combination of thermodynamic, kinetic, and transport models to predict the formation of NOx from combustion reactions. Similar method of utilising RGibbs reactor to predict NOx has been done by some researchers in many process simulations of fuel combustion, such as oxy-fuel combustion of coal firing (Pei et al. Citation2013; Odeh, Okpaire, and Oyedoh Citation2021), syngas combustion (Ziółkowski et al. Citation2021), ammonia combustion (Juangsa and Aziz Citation2019), ammonia-coal combustion (Xu et al. Citation2022).
The total radiation was divided into wall tube and secondary superheater (Wang et al. Citation2011). The Gurvich method was used to calculate the total radiation at co-firing as shown as at EquationEquation (4)(4)
(4) , where
is average emissivity furnace wall-flame system,
is thermal efficiency constant,
is furnace area,
is average gas temperature, and
is Stefan–Boltzmann constant (Y. Zhang, Li, and Zhou Citation2016).
(4)
(4)
was calculated by EquationEquation (5)
(5)
(5) , where
is the coefficient of average radiation temperature caused by the effect of soot blowing and heat loss to the atmosphere and
is the furnace exit gas temperature.
and
were iterated until it satisfied the heat mass balance (Bhambare, Mitra, and Gaitonde Citation2007; Olaleye Citation2015).
(5)
(5) Then, the ash and gas were separated in the SEPARATE Block (SSplit). The flue gas heated the feed water, and the flue gas then flowed to the Gas-Air Heater to heat the ambient air. After the ambient air was heated, the flue gas was used as heat recovery for heating the liquid ammonia.
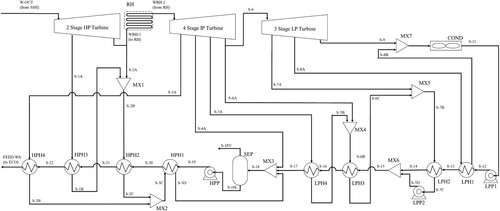
Furthermore, the steam generator system is shown in . Deaerator is modelled as MX3 and SEP. W-OUT from SSH was fed into two stages HP turbine, then to RH. Four stages IP turbine and three stages LP turbine were used at this power plant. Meanwhile, Four LPH and four HPH were used to recover the heat.
Figure 4. Detailed steam generator system of ammonia coal co-firing.
3. Results and discussion
3.1. Simulation model
The proximate and ultimate analysis of the coal used is shown in . Meanwhile, the stream data are shown in . Aspen used the dry-based HHV. Equation (6) is used to change HHV as received to HHV dry based (Aspen Technology Citation2013).
(6)
(6)
Table 1. The proximate and ultimate analyses of the pulverised coal.
Table 2. The stream data.
shows the simulation result at 100% coal combustion. The total radiation is about 240 MW due to the temperature of AIRHOT (362°C) and temperature of PRODUCT as TFGET is set about 1200°C (Wang et al. Citation2011; LAPI ITB Citation2015). The simulation results of the specified coal-fired power plant were compared with the design specifications to verify the validity of the simulation approach. In , numerous important boiler and steam generator data are presented, including the temperature of the input and outlet flue gas in the GAH, the gross power output, and the net plant heat rate.
Table 3. Simulation results at 100% coal.
Table 4. Comparison of the design specifications and the simulation results.
The maximum relative deviation was 3.75% which occurred on the temperature of GAH outlet flue gas. These deviations occurred due to no heat loss and pressure loss assumption at the boiler. Significant property parameter variations of flue gas were all within the allowable range, showing that the modelling technique and simulation procedure properly reflected the actual boiler system operation (Zhou et al. Citation2018; Si et al. Citation2017).
3.2. Effect evaluation on flue gas properties
The airflow rate and air-to-fuel ratio are shown in . It is found that the airflow rate needed is increased when the ammonia composition in fuel is increased. This phenomenon occurred because the theoretical air needed for the ammonia combustion is higher than the coal. Ammonia combustion has a theoretical air-to-fuel ratio of 6.06, while coal combustion has a theoretical air-to-fuel ratio of 5.65. The AFR of coal used Equation in ASME PTC 4.1 as shown in EquationEquation (7)(7)
(7) (ASME Citation1998). Meanwhile, the AFR of the ammonia used stoichiometric calculation from EquationEquation (2)
(2)
(2) . This finding differs from the previous ones (Xu et al. Citation2022; Kim, Kwak, and Yang Citation2021) because the coal used is different. This study used low-rank coal, whereas previous studies used high-rank coal. It has also been found that at 100% ammonia, the airflow rate required is only 9% higher than for coal-firing.
(7)
(7)
Table 5. Airflow rate and air to fuel ratio at constant excess oxygen scenario.
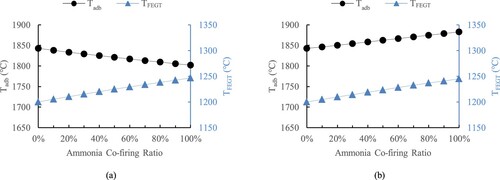
As the rate of ammonia co-firing increases, the adiabatic flame temperature decreases in a constant excess oxygen scenario because ammonia has a lower adiabatic flame temperature than coal. Meanwhile, due to a lack of air, it rises in the airflow rate constant scenario. Following iteration, it was discovered that the temperature of the furnace exit gas increased, as shown in in both scenarios. In the constant excess oxygen scenario, the overall air flow rate is increased with a higher ammonia cofiring ratio. Since the overall radiation is a function of adiabatic flame temperature, an increasing fraction of ammonia results in overall radiation in the constant excess oxygen scenario. In addition, with a higher mass flow rate of flue gas, the flue gas temperature decrease is lower, leading to a higher temperature furnace. Therefore, the furnace exit gas temperature increases even though the adiabatic temperature decreases. Meanwhile, in the constant airflow rate scenario, the increasing adiabatic flame temperature results in a higher furnace exit temperature with a constant mass flow rate of flue gas.
Figure 5. Adiabatic and furnace exit gas temperature with different ammonia co-firing rates. (a) Constant Excess Oxygen; (b) Constant Airflow Rate.
Ammonia co-firing affected significantly the compositions, thermal properties, and flow rates of the flue gas because of the changes in changes in the composition of the fuel stream. The total emission rates of flue gas are shown in and and the NOx and SOx emissions in ppm are shown in . Meanwhile, presents the mole fractions of nitrogen, oxygen, carbon dioxide, and water vapour in the flue gas.
Figure 6. NOx and SOx emission in ppm. (a) Constant Excess Oxygen Scenario; (b) Constant Airflow Rate Scenario.
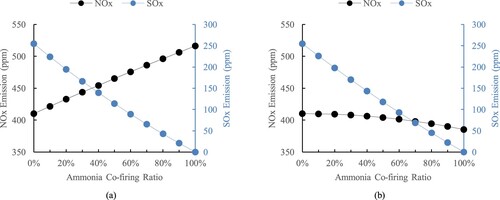
Figure 7. Mole fractions of nitrogen, oxygen, carbon dioxide, and water vapour in the flue gas. (a) Constant Excess Oxygen Scenario; (b) Constant Airflow Rate Scenario.
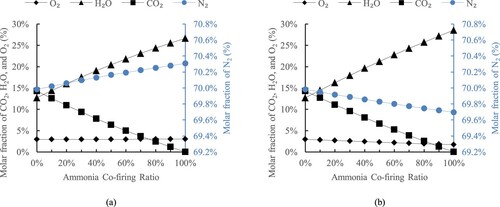
Table 6. The mass flow rate of the entire flue gas and the principal components of the flue gas at the furnace exit under the constant excess oxygen scenario (in tonne/hour).
Table 7. The mass flow rate of the entire flue gas and the principal components of the flue gas at the furnace exit under the constant airflow rate scenario (in tonne/hour).
The CO2 mass flow rate and mole fraction decreased in both ammonia co-firing scenarios, with the decrease rate likely being the same in both. However, the constant airflow rate scenario has a more decreased rate of CO2 than the constant excess oxygen scenario. It is caused by less oxygen at the constant airflow rate scenario. NOx emission is significantly affected by fuel-nitrogen (fuel-N) and temperature of combustion. Since ammonia carries a significant amount of nitrogen, an increase in NOx emissions is a natural cause for concern. The NOx emission increased in constant excess oxygen and decreased in the constant airflow rate scenario. Compared with the experimental by Tamura et al. (Citation2020), the NOx emission increase in constant excess O2. Consequently, the ASPEN Plus simulation can be considered accurate. The constant airflow rate scenario has less NOx emission than the constant excess oxygen scenario due to the lower excess oxygen. Lowering the excess oxygen is one of the strategies to reduce the NOx emissions (Doyle Citation2009; EPA Citation1999). The lower excess oxygen also resulted in less fuel NOx from the coal, as shown in research by Lee, Eddings, and Jeon (Citation2012). Therefore, the NOx is decreased in the constant airflow rate scenario. The SOx emission decreases in both scenarios due to the S carrier (i.e. coal) is decreased.
When using ammonia as a fuel at a 100% co-firing ratio, the amount of H2O in the flue gas increases dramatically. In the base case, the H2O content is 12.7%, but it rises to 26.7% in the constant excess oxygen scenario and 28.6% in the constant airflow rate scenario, representing increases of 110.2% and 125.2%, respectively. This increase is due to the higher hydrogen content in NH3 compared to coal, which leads to more H2O formation after fuel oxidation. In the constant airflow rate scenario, the excess oxygen level drops to 1.69% from 2.97%. This indicates that ammonia combustion in the boiler can be achieved without modifying the fan. When ammonia is fired with coal in a constant airflow rate, the amount of nitrogen (N2) in the flue gas decreases even though ammonia has high nitrogen content. This is because the chemical reaction of ammonia with oxygen produces a mixture of nitrogen and water vapour with a nitrogen to water ratio of 1–3. However, the N2 content increases in the constant excess oxygen scenario. This is due to the higher amount of N2 in the air.
The higher the percentage of ammonia co-firing, the higher the temperature rise occurs at each different position of the boiler (). The increase of each position has a rising trend from G1 to G6. However, the trend is lower because the ammonia vapourised by flue gas increases when the co-firing rate increases at G7. The increase in temperature is caused by the increase of specific heat capacity at constant pressure at each boiler position () and an increase in flue gas flow rate ( and )
Figure 8. The temperature of the flue gas stream at different positions in the boiler system. (a) Constant Excess Oxygen Scenario; (b) Constant Airflow Rate Scenario.
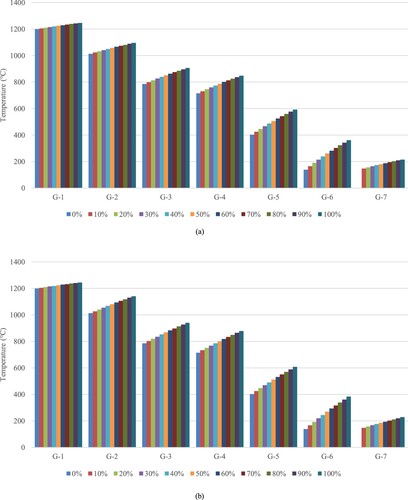
Figure 9. The heat capacity of flue gas stream at different positions in the boiler system. (a) Constant Excess Oxygen Scenario; (b) Constant Airflow Rate Scenario.
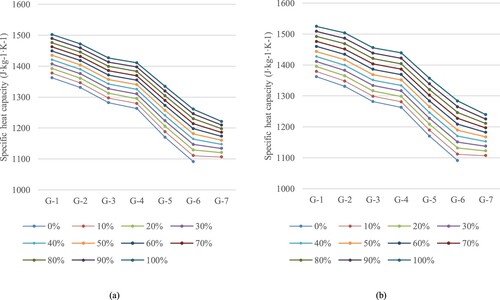
It is found that Specific heat capacity at constant pressure (Cp) in the constant airflow rate scenario is higher than Cp in the constant excess oxygen scenario, as shown in . An increase of Cp is caused by the increase of ammonia and water concentration at flue gas that has higher Cp than other gases content. Therefore, even though the mass rate of flue gas is lower in the constant airflow rate scenario than in the constant excess oxygen scenario, the increase in temperature of flue gas is greater in the constant airflow rate scenario.
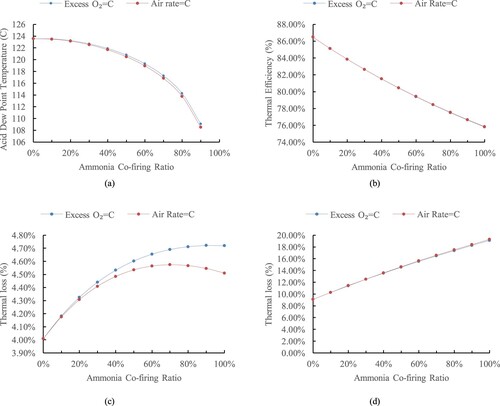
Furthermore, the acid dew point of the flue gas is analyzed. The increase of H2O in flue gas might improve the acid dew point of the flue gas. However, the SOx content decreases ( and ), and the stack temperature increases, as shown in (G6 for 0% ammonia and G7 for ammonia co-firing). The decrease in SOx content might lead to a decrease in the acid dew point of the flue gas. As shown in EquationEquation (7)(7)
(7) , the Verhoff and Branchero equation is used to predict the acid dew point of H2SO4. The acid dew point of H2SO4 is used because it has at least 20°C higher dew point temperature than HNO3 and H2SO3 (Zarenezhad and Aminian Citation2011), and Verhoff and Branchero equation is used due to its consistency (Wei et al. Citation2017).
(8)
(8)
(a) is shown the acid dew point temperature of the flue gas in both scenarios. The impact of sulphuric acid vapour is more considerable than water vapour. With an increase in ammonia co-firing for low-rank coal boilers, it is possible that the acid dew point problem may not occur. This result is different from Xu et al. (Xu et al. Citation2022) due to the difference in the coal rank used. Xu et al. used high-rank coal, which led to decreased stack temperature due to its high HHV. This result also concludes that ammonia co-firing is more appropriate for utilisation at low-rank coal-fired power plants.
Figure 10. (a) Acid dew point temperature (b) Overall boiler efficiency; (c) Stack losses due to dry flue gas; (d) Stack losses due to water from fuel.
3.3. Effect evaluation of ammonia co-firing on boiler efficiency
This section discusses the effect of ammonia co-firing on boiler efficiency. The boiler efficiency is calculated based on HHV of coal and ammonia, resulting in decreases when the ammonia co-firing rate is higher. The constant airflow rate scenario has slightly better performance than the constant excess oxygen scenario, as shown in (b). The boiler efficiency of both cases is relatively similar as the result of the increased gas flow rate in the constant excess oxygen scenario, while the stack temperature increase in the constant air flowrate scenario. Therefore, it is found that both scenarios can be used in coal power plants. If the fan used in the power plant is a variable speed fan, the constant excess oxygen scenario is better than the constant airflow rate scenario. The constant airflow rate scenario has a challenge of complete combustion due to lower excess oxygen. Based on the calculation, the losses in the boiler are mainly due to stack losses and water from fuel losses.
The thermal stack losses, which represents the losses due to dry flue gas, have a parabolic trend, as shown in (c). It is caused by a increase of H2O content in the flue gas as the ammonia fraction increases, leading to decrease of dry flue gas flow rate. Meanwhile, the stack temperature is higher at higher fraction of ammonia, especially for constant excess O2 scenario. As the result, the parabolic trend of thermal stack losses is formed by the balance between increasing stack temperature and decreasing flue gas flow rate. The maximum loss of excess oxygen occurs on a 90% ammonia co-firing ratio. Meanwhile, the maximum loss occurs on a 70% ammonia co-firing ratio at the constant airflow rate scenario. This is caused by the H2O emission of the constant airflow rate being higher than the constant excess oxygen. This result differs from Kim et al (Kim, Kwak, and Yang Citation2021). Kim et al. have a result of a decrease of stack loss at 0% until 30% ammonia co-firing ratio. Kim et al. used coal with a higher HHV, that is also higher than the HHV of ammonia, resulted in a decreasing trend of stack temperature as ammonia fraction increases. Meanwhile, the stack temperature rises in this study is caused by a lower HHV of coal that is lower than that of ammonia.
Meanwhile, the losses due to water from the fuel are shown in (d). This result is similar to Kim et al. The loss due to water from the fuel increases as the ammonia co-firing rate increases. This is because the hydrogen content of ammonia is higher, by about 17% (Cheddie Citation2012), than that of coal, resulting in higher water content in the flue gas when the fuel is oxidised.
4. Conclusion
Simulation and comparative studies of ammonia-coal co-firing and low-rank coal power plant unit were carried out. The systematic results on the emission rate, thermal properties of the flue gas stream, and boiler system efficiency were obtained. When ammonia is co-fired with coal, CO2 emissions from conventional coal-fired power plants are reduced. The SOx emission decreased in both scenarios. Meanwhile, the NOx emission increased in the constant excess oxygen scenario and decreased in the constant airflow rate scenario. The emission content of H2O increases in both scenarios as NH3 has a higher content of hydrogen than coal. Constant excess oxygen scenario needs more airflow rate due to higher AFR of ammonia. Therefore, even though the N2 emission from NH3 oxidation is only 25%, the N2 emission increases in a constant excess oxygen scenario. Meanwhile, the N2 emission is decreased at a constant airflow rate scenario. It is also found that the ammonia co-firing at low-rank coal-fired power plants may not have a problem with acid dew point temperature due to the higher temperature of the stack.
The temperature of flue gas is affected by the proportion of ammonia used in the co-firing process. As the ammonia ratio increases, the temperature of the flue gas at the same point in the system also rises. This is due to changes in the heat capacity and flow rate of the flue gas.
The boiler efficiency of a CFPP remains similar at different ammonia co-firing ratios. Each scenario can be used depend on the power plant capability. The CFPP has variable speed fan is suggested to used the constant excess oxugen scenario to achieve complete combustion of the fuel. If the variable speed fan cannot achieve the constant excess oxygen scenario or the power plant does not have variable speed fan, the air flowrate constant scenario can be used. However, the complete combustion of the fuel must be considered if used the constant airflow rate scenario. In general, it is more practical to operate a coal-fired power plant with the same excess oxygen levels as in its original coal-fired configuration when co-firing with ammonia. In addition, the off design simulation of the power plant must be considered and the computational fluid dynamic of the boiler must be examined to ensure the ammonia co-firing.
Supplemental Material
Download MS Word (393 KB)Disclosure statement
No potential conflict of interest was reported by the author(s).
Additional information
Funding
References
- ASME. 1998. ASME PTC 4.1 Performance Test Code Fired Steam Generators. New York: American Society of Mechanical Engineers.
- ASME. 2008. ASME PTC 4-2008 Fired Steam Generators. New York: American Society of Mechanical Engineers.
- Aspen Technology. 2013. Aspen Plus: Getting Started Modeling Processes with Solids. MA: Aspen Technology, Inc.
- Aziz, Muhammad, Agung TriWijayanta, and Asep Bayu Dani Nandiyanto. 2020. “Ammonia as Effective Hydrogen Storage: A Review on Production, Storage and Utilization.” Energies 13 (12): 3062. doi:10.3390/en13123062.
- Bhambare, K. S., Sushanta K. Mitra, and U. N. Gaitonde. 2007. “Modeling of a Coal-Fired Natural Circulation Boiler.” Journal of Energy Resources Technology, Transactions of the ASME 129 (2): 159–167. doi:10.1115/1.2719209.
- Cheddie, Denver. 2012. “Ammonia as a Hydrogen Source for Fuel Cells: A Review.” Hydrogen Energy – Challenges and Perspectives, doi:10.5772/47759.
- Davis, Steven J., Nathan S. Lewis, Matthew Shaner, Sonia Aggarwal, Doug Arent, Inês L. Azevedo, Sally M. Benson, et al. 2018. “Net-Zero Emissions Energy Systems.” Science 360 (6396), doi:10.1126/science.aas9793.
- Doyle, Brian. 2009. “Oxygen Based NOx Control.” In NOx Emissions Course.
- Elishav, Oren, Bar Mosevitzky Lis, Elisa M. Miller, Douglas J. Arent, Agustin Valera-Medina, Alon Grinberg Dana, Gennady E. Shter, and Gideon S. Grader. 2020. “Progress and Prospective of Nitrogen-Based Alternative Fuels.” Chemical Reviews 120 (12): 5352–5436. doi:10.1021/acs.chemrev.9b00538.
- EPA. 1999. Nitrogen Oxides (NOx), Why and How They Are Controlled. http://www.epa.gov/ttncatc1/dir1/fnoxdoc.pdf.
- EPA. 2016. Global Greenhouse Gas Emissions. Washington, DC: EPA.
- Flórez-Orrego, Daniel, François Maréchal, and Silvio de Oliveira Junior. 2019. “Comparative Exergy and Economic Assessment of Fossil and Biomass-Based Routes for Ammonia Production.” Energy Conversion and Management 194: 22–36. doi:10.1016/j.enconman.2019.04.072.
- IEA. 2019. “The Future of Hydrogen.” The Future of Hydrogen, no. June. doi:10.1787/1e0514c4-en.
- IEA. 2021. “Electricity.” Fuels & Technologies. https://www.iea.org/fuels-and-technologies/electricity.
- Iki, Norihiko, Osamu Kurata, Takayuki Matsunuma, Takahiro Inoue, Masato Suzuki, Taku Tsujimura, and Hirohide Furutani. 2015. “Micro Gas Turbine Firing Kerosene and Ammonia.” Proceedings of the ASME Turbo Expo 8: 1–22. doi:10.1115/GT2015-43689.
- IPCC. 2018. Global Warming of 1.5 C. An IPCC Special Report on the Impacts of Global Warming of 1.5°C above Pre-Industrial Levels and Related Global Greenhouse Gas Emission Pathways, in the Context of Strengthening the Global Response to the Threat of Climate Change, edited by V.P. Masson-Delmotte, H.-O. Zhai, D. Pörtner, J. Roberts, P.R. Skea, A. Shukla, W. Pirani, et al. Intergovernmental Panel on Climate Change. doi:10.1038/291285a0.
- Juangsa, Firman Bagja, and Muhammad Aziz. 2019. “Integrated System of Thermochemical Cycle of Ammonia, Nitrogen Production, and Power Generation.” International Journal of Hydrogen Energy, doi:10.1016/j.ijhydene.2019.05.110.
- Juangsa, Firman Bagja, Lukman Adi Prananto, Zahrul Mufrodi, Arief Budiman, Takuya Oda, and Muhammad Aziz. 2018. “Highly Energy-Efficient Combination of Dehydrogenation of Methylcyclohexane and Hydrogen-Based Power Generation.” Applied Energy 226: 31–38. doi:10.1016/j.apenergy.2018.05.110.
- Kim, Seong-il, Hyung-geun Kwak, and Won Yang. 2021. “Process Simulation of the Effect of Ammonia Co-Firing on the Supercritical Boiler System for Reduction of Greenhouse Gas.” Journal of The Korean Society of Combustion 26 (4): 1–12. doi:10.15231/jksc.2021.26.4.001.
- LAPI ITB. 2015. Report PLTU Pangkalan Susu-Sumut.
- Lee, Byoung Hwa, Eric G. Eddings, and Chung Hwan Jeon. 2012. “Effect of Coal Blending Methods with Different Excess Oxygen on Unburned Carbon and NOx Emissions in an Entrained Flow Reactor.” Energy and Fuels 26 (11): 6803–6814. doi:10.1021/ef300562t.
- Møller, Kasper T, Torben R Jensen, Etsuo Akiba, and Hai wen Li. 2017. “Hydrogen – A Sustainable Energy Carrier.” Progress in Natural Science: Materials International 27 (1): 34–40. doi:10.1016/j.pnsc.2016.12.014.
- Nagatani, Genichiro, Hiroki Ishi, Takamasa Ito, Emi Ohno, and Yoshitomo Okuma. 2020. “Development of Co-Firing Method of Pulverized Coal and Ammonia to Reduce Greenhouse Gas Emissions.” IHI Engineering Review 53 (1): 1–10. https://www.ihi.co.jp/ihi/technology/review_library/review_en/2020/_cms_conf01/__icsFiles/afieldfile/2021/01/14/Vol53No1_F.pdf.
- Nikolaidis, Pavlos, and Andreas Poullikkas. 2017. “A Comparative Overview of Hydrogen Production Processes.” Renewable and Sustainable Energy Reviews 67: 597–611. doi:10.1016/j.rser.2016.09.044.
- Odeh, A. O., L. A. Okpaire, and E. A. Oyedoh. 2021. “Process Simulation of Oxy-Fuel Combustion for A 120 MW Coal-Fired Power Plant Using Aspen Plus.” International Journal of Natural Sciences Research 9 (1): 26–38. doi:10.18488/journal.63.2021.91.26.38.
- Olaleye, Akeem Kehinde. 2015. “Modelling and Operational Analysis of Coal-Fired Supercritical Power Plant Integrated With Post-Combustion Carbon Capture Based on Chemical Absorption Under Uk Grid Requirement Faculty of Sciences and Engineering School of Engineering.” 258.
- Pegels, Anna, and Tilman Altenburg. 2020. “Latecomer Development in a ‘Greening’ World: Introduction to the Special Issue.” World Development 135: 105084. doi:10.1016/j.worlddev.2020.105084.
- Pei, Xiaohui, Boshu He, Linbo Yan, Chaojun Wang, Weining Song, and Jingge Song. 2013. “Process Simulation of Oxy-Fuel Combustion for a 300 MW Pulverized Coal-Fired Power Plant Using Aspen Plus.” Energy Conversion and Management 76: 581–587. doi:10.1016/j.enconman.2013.08.007.
- Philibert, Cédric. 2017. Renewable Energy for Industry. Paris: International Energy Agency. https://iea.blob.core.windows.net/assets/48356f8e-77a7-49b8-87de-87326a862a9a/Insights_series_2017_Renewable_Energy_for_Industry.pdf.
- Si, Ningning, Zhigang Zhao, Sheng Su, Pengshuai Han, Zhijun Sun, Jun Xu, Xiaoning Cui, et al. 2017. “Exergy Analysis of a 1000 MW Double Reheat Ultra-Supercritical Power Plant.” Energy Conversion and Management 147: 155–165. doi:10.1016/j.enconman.2017.05.045.
- Tamura, Masato, Takahiro Gotou, Hiroki Ishii, and Dirk Riechelmann. 2020. “Experimental Investigation of Ammonia Combustion in a Bench Scale 1.2 MW-Thermal Pulverised Coal Firing Furnace.” Applied Energy 277. doi:10.1016/j.apenergy.2020.115580.
- The Royal Society. 2020. Ammonia: Zero-Carbon Fertiliser, Fuel and Energy. The Royal Society. KBR Inc. https://royalsociety.org/-/media/policy/projects/green-ammonia/green-ammonia-policy-briefing.pdf.
- Valera-Medina, A., S. Morris, J. Runyon, D. G. Pugh, R. Marsh, P. Beasley, and T. Hughes. 2015. “Ammonia, Methane and Hydrogen for Gas Turbines.” Energy Procedia 75: 118–123. doi:10.1016/j.egypro.2015.07.205.
- Valera-Medina, A., H. Xiao, M. Owen-Jones, W. I. F. David, and P. J. Bowen. 2018. “Ammonia for Power.” Progress in Energy and Combustion Science 69: 63–102. doi:10.1016/j.pecs.2018.07.001.
- Wan, Zhijian, Youkun Tao, Jing Shao, Yinghui Zhang, and Hengzhi You. 2021. “Ammonia as an Effective Hydrogen Carrier and a Clean Fuel for Solid Oxide Fuel Cells.” Energy Conversion and Management 228: 113729. doi:10.1016/j.enconman.2020.113729.
- Wang, Ligang, Yongping Yang, Changqing Dong, Zhiping Yang, and Gang Xu. 2011. “Thermodynamic Calculation and Simulation of Power Plant Boiler Based on Aspen Plus.” Asia-Pacific Power and Energy Engineering Conference, APPEEC. doi:10.1109/APPEEC.2011.5749132.
- Wei, Wei, Fengzhong Sun, Yuetao Shi, and Lei Ma. 2017. “Theoretical Prediction of Acid Dew Point and Safe Operating Temperature of Heat Exchangers for Coal-Fired Power Plants.” Applied Thermal Engineering 123: 782–790. doi:10.1016/j.applthermaleng.2017.05.051.
- Xu, Yishu, Huakun Wang, Xiaowei Liu, Jingji Zhu, Jingying Xu, and Minghou Xu. 2022. “Mitigating CO2 Emission in Pulverized Coal-Fired Power Plant via Co-Firing Ammonia: A Simulation Study of Flue Gas Streams and Exergy Efficiency.” Energy Conversion and Management 256: 115328. doi:10.1016/j.enconman.2022.115328.
- Yamamoto, Akira, Masayoshi Kimoto, Yasushi Ozawa, and Saburo Hara. 2018. “Basic Co-Firing Characteristics of Ammonia with Pulverized Coal in a Single Burner Test Furnace.” 2018 AIChE Annual Meeting, 1–14. https://aiche.confex.com/aiche/2018/meetingapp.cgi/.
- Yoshizaki, Tsukasa. 2019. “Test of the Co-Firing of Ammonia and Coal at Mizushima Power Station.” Journal of the Combustion Society of Japan 61 (198): 309–312. doi:10.20619/jcombsj.61.198_309.
- Zarenezhad, Bahman, and Ali Aminian. 2011. “Accurate Prediction of the Dew Points of Acidic Combustion Gases by Using an Artificial Neural Network Model.” Energy Conversion and Management 52 (2): 911–916. doi:10.1016/j.enconman.2010.08.018.
- Zhang, Juwei, Takamasa Ito, Hiroki Ishii, Sakiko Ishihara, and Toshiro Fujimori. 2020. “Numerical Investigation on Ammonia Co-Firing in a Pulverized Coal Combustion Facility: Effect of Ammonia Co-Firing Ratio.” Fuel 267: 117166. doi:10.1016/j.fuel.2020.117166.
- Zhang, Yanguo, Qinghai Li, and Hui Zhou. 2016. Theory and Calculation of Heat Transfer in Furnaces. Theory and Calculation of Heat Transfer in Furnaces. London: Elsevier Inc. doi:10.1016/c2013-0-13233-3
- Zhongyang, L., and A. Michalis. 2017. Low-Rank Coals for Power Generation, Fuel and Chemical Production. Duxford: Woodhead Publishing.
- Zhou, Jing, Chenhao Zhang, Sheng Su, Yi Wang, Song Hu, Liang Liu, Peng Ling, Wenqi Zhong, and Jun Xiang. 2018. “Exergy Analysis of a 1000 MW Single Reheat Supercritical CO2 Brayton Cycle Coal-Fired Power Plant.” Energy Conversion and Management 173: 348–358. doi:10.1016/j.enconman.2018.07.096.
- Ziółkowski, Paweł, Paweł Madejski, Milad Amiri, Tomasz Kuś, Kamil Stasiak, Navaneethan Subramanian, Halina Pawlak-Kruczek, Janusz Badur, Łukasz Niedźwiecki, and Dariusz Mikielewicz. 2021. “Thermodynamic Analysis of Negative CO2 Emission Power Plant Using Aspen Plus, Aspen Hysys, and Ebsilon Software.” Energies 14 (19): 1–27. doi:10.3390/en14196304.