
 ?Mathematical formulae have been encoded as MathML and are displayed in this HTML version using MathJax in order to improve their display. Uncheck the box to turn MathJax off. This feature requires Javascript. Click on a formula to zoom.
ABSTRACT
Coffee is the second most consumed beverage in the world. Spent coffee grounds (SCGs) are promising raw material for pyrolysis. The Kissinger-Akahira-Sunose model (KAS) and Ozawa-Flynn Wall (OFW), determined the pyrolysis activation energy to be 142.40 and 66.08 kJ/mol, respectively. The pyrolysis products were bio-oil with a 22.5% yield and a calorific power of 28.91 MJ/kg. The bio-oil composition was 50.86% fatty acids, 31.65% linear hydrocarbons, and 11.31% aromatics, as determined by GC-MS. The total phenolic content (TPC) was 362 ± 44 mg GA g−1, with DPPH activity of 24.8 ± 2% inhibition and antioxidant activity of 108.5 ± 13.6 mg L−1 of Trolox equivalents. The results showed that bio-oil could be used as a biofuel and a source of chemical compounds.
Introduction
In the last decade, 86% of global emissions have come from the use of fossil fuels to produce 43,849 TWh of energy (Friedlingstein et al. Dec. Citation2020; Ritchie and Roser Citation2017). These emissions affect the environment and economics, creating political dependency. To overcome this evident dependence on fossil fuels and their significant emission of CO2 (Ritchie and Roser Citation2017), it is necessary to diversify energy sources (Owen and Kruijsen Citation2013). For this reason, multiple applicable methodologies to take advantage of waste (biomass) have been developed and have become promising sources of energy production. According to their purpose, it is necessary to study the experimental conditions for transforming biomass into energy (Gnansounou and Alves Citation2019).
Brazil supplied 32.7% of the world's coffee exports in the same coffee year, Vietnam 19.3%, and Colombia 9.9%. These countries accounted for the majority of coffee exports in the year. A growing awareness of the environmental impacts of residues from the coffee industry is evidenced by several scientific studies examining the value chains of coffee byproducts within the circular economy (Lee et al. May Citation2021; Li et al. Citation2014). One of the most valuable organic wastes is spent coffee grounds (SCGs), a byproduct of the coffee brewing process, which represents 10% by weight of fresh coffee (Rodríguez and Zambrano Citation2010). The average global consumption of coffee in 2016 was 1.07 kg per capita (Torga and Spers Citation2020), and in Colombia, in 2021, it was estimated that 13.5 million 60-kg bags would be produced (Ministerio de Agricultura y Desarrollo Rural Citation2017). Clearly, a large portion of the residues generated by the coffee industry end up in landfills, but the numbers are startling (Durán-Aranguren et al. Citation2021).
There are multiple reports of the use of spent coffee grounds as biomass. This residue is used as a reagent for removing lead ions from drinking water (Tokimoto et al. Citation2005) and indirect generation power cells (Jang et al. Citation2015). The latest report demonstrates that its energy density is higher than the traditional use of coal due to its high heteroatom content (Jang et al. Citation2015). The use of coffee residues to generate biofuels includes anaerobic digestion to obtain bio methane (10% of methane with a higher heating value up to 28.24 MJ/kg) (Luz et al. Citation2017) or highly complex processes to obtain bioalcohol (ethanol, isobutanol, and methyl butanols) through genetic engineering of Bacillus subtilis (Kim et al. Citation2020). One alternative process for coffee waste is pyrolysis.
Pyrolysis is a process in which organic material is heated, and its temperature is raised in the absence of oxygen by means of controlled temperature rates (Demirbaş and Arin Citation2002). This process is used to obtain bio-oil, biogas, and biochar (Mohan et al. Citation2006). Although historical uses of pyrolysis date back to the production of charcoal from wood, the resulting gaseous phase was not exploited since only the resulting solid fraction, in this case, carbon, was of interest (CH2MHILL Citation2009). Pyrolysis was also used to generate black smoke from tires used to produce chemicals and carbon electrodes (CH2MHILL Citation2009). However, the latest approaches utilise residues to obtain lighter compounds (Jang et al. Citation2015; Luz et al. Citation2017).
Specifically, the pyrolysis of spent coffee grounds has been documented on several occasions, such as the slow pyrolysis of dry spent coffee grounds at 450 °C and a heating rate of 50 °C/min during a residence time of 2 h obtained 28% bio-oil and 28% biochar (Vardon et al. Citation2013); the biofuel characteristics of SCG biochar, such as high carbon composition (80.35%), low oxygen content (12.43%); high fuel ratio (6.75) and low H/C (0.44) O/C (0.12) ratios as a result of pyrolysis with optimised parameters. The composition of spent coffee grounds in the percentage of mass, the energy density of the bio-oil, and the mass balance for slow pyrolysis of spent coffee grounds was also documented (Vardon et al. Citation2013). The use of two heating rates (10 and 60 °C/min) showed a change in the position of the peaks at higher temperatures in the thermal behaviour of the sample with a higher heating rate even though the process steps are similar (Li et al. Citation2014). The contributions of the authors are mainly related to the future uses of spent coffee ground pyrolysis products, specifically the potential of bio-oil for biodiesel production considering the high presence of palmitic and linoleic acids in its composition determined by GC–MS and FTIR analysis (Li et al. Citation2014).
This study used Colombian spent coffee grounds as biomass feedstock to scale up laboratory batch pyrolysis reactors to obtain bio-oil as a primary product and biochar as a secondary product. The purpose of this study is to determine and characterise whether the obtained bio-oil is a promising biofuel and a suitable material for refinement into chemical compounds with high added value for preventing free radical formation. By using the isoconversional method, TGA evaluated the bioenergy potential of coffee grounds from Colombia. The comparisons of this study are expected to be of great value to both industry and academia.
Materials and methods
Sampling and raw material preparation: Six kilograms of spent coffee ground (SCGs) were collected at different coffee shops in Bogotá, Colombia. The biomass was subsequently,dried (humidity ≤ 10%) (Vardon et al. Citation2013; Chaiya Citation2011) and stored in resealable plastic bags under a vacuum.
Characterisation of spent coffee grounds: The elemental and proximal analysis was performed to characterise the SCGs. Proximal analysis was carried out under the Van Soest method (Van Soest et al. Citation1991): The soluble fraction (non-structural carbohydrates, pectin, mucilage, tannins, lipids, and proteins) was extracted with an excess of a neutral detergent solution prepared with disodium phosphate (4.5 g/L), sodium tetraborate (6.81 g/L), α-amylase (0.25 g/L), sodium EDTA (18.6 g/L), sodium lauryl sulfate (30 g/L) and sodium sulfite (5 g/L). The solution was allowed to act on the sample dry for 1 h at 100 °C, with a pH of 7.00 ± 0.05.
The extracted fraction was separated from the neutral detergent insoluble fiber (NDF) by filtration. A solution in excess acid detergent was prepared with 20 g/L cetyltrimethylammonium bromide and 98 g/L H2SO4 which allowed the extraction of the hemicellulose when heated for 1 h at 100 °C. The extracted fraction was separated from the acid-insoluble detergent fibers (ADF) by filtration.
Cellulose was extracted by treating the ADF fraction with sulfuric acid for 3 h at room temperature. The filtration residue, called ADL, corresponds to the lignin associated with the inorganic elements. The hemicellulose and cellulose contents were calculated as the difference between the NDF and ADF fractions and the ADF and ADL fractions, respectively. The lignin content is equal to the difference between the ADL fraction and the mineral content determined after calcination at 550 °C (Van Soest et al. Citation1991).
Elemental analysis was determined as C (Carbon) and H (Hydrogen) O(Oxygen)and S (Sulphur) under the ASTM D3178 standard using an elemental analyser (Flash 2000, Thermo Fisher Scientific K. K, Waltham, MA, USA), according to previous reports (Parikh et al. Citation2007). N (Nitrogen) was determined by Kjeldahl ASTM D 3590 (digestion of the sample with H2SO4 in a digester and distillation, followed by titration).
The humidity was determined using a thermobalance PCE ref. MB-120C. The particle size was determined by a sieving analysis (ASTM C136). Thermogravimetric analysis (TGA) was conducted according to ASTM E 1131-21 using a Discovery SDT 650 – TA Instrument. Approximately 5 mg of the sample was placed on a platinum tray, and the temperature ranged between 25 and 1500 °C. The duration of the analysis was between 1 and 3 h, and the resulting TGA curves were evaluated at 5 heating rates of 2, 5, 7, 10 and 15 °C/min under an inert atmosphere with a N2 flowrate (Vyazovkin et al. Citation2011; Baroni et al. Citation2016).
Model fitting of kinetic parameters: With the thermogravimetry results and using the integral and differential isoconversional methods of Kissinger-Akahira-Sunose-Kas and Ozawa-Flynn-Wall described in the literature (Baroni et al. Citation2016; Rueda-Ordñez et al. Citation2015), two models were proposed to describe the activation energy of the SCGs.
Pyrolyzer: The pyrolyzer consists of a system with an electronic control system Maxthermo MC 5438 (G), electrical resistance (B, 1.6 kW) and a reactor body (AISI 316) capacity of 1 L (A), a pipeline for the outlet of condensable compounds (C), a condenser of 4.5 L (D), an outlet valve for condensed compounds (C), and a drain valve (E). The equipment is shown in . Noncondensable gas was filtered by a carbon-activated filter (F). Pressure in the system was registered by a manometer (H).
Figure 1. Schematic of the pyrolyzer design by Universidad Santo Tomás.
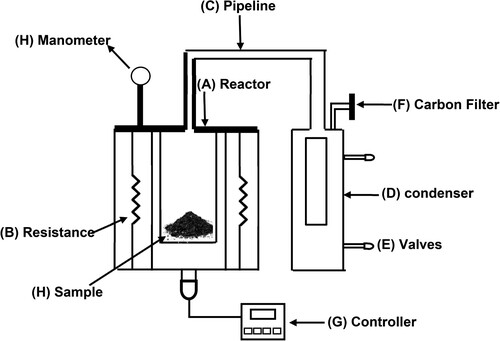
Pyrolysis of the raw material: The sample for every assay (H) was introduced into the pyrolysis chamber (A), valve (E) was closed, and 2.5 L of water was added to the condenser (D). The reactor was closed with the cap (I). Finally, the process parameters were entered through the PLC controller (a), which started the process. At the end of the process, the condenser was cooled (20 °C), the lid was removed (d) to collect the ashes from the pyrolysis chamber, and the condensed compound outlet valve (g) was opened to extract them. Once extracted, their weight was recorded for later analysis.
Experimental design: A sample of 200 g of SCGs at was introduced introduced into the pyrolysis chamber at an initial temperature of approximately 17 °C (ambient temperature). The heating rates were 15 and 30 °C/min, and the final temperatures were 400 and 500 °C, respectively, to obtain fast pyrolysis conditions for acquiring high quality bio-oil from cellulosic substrate using high heating rates (Vardon et al. Citation2013; Li et al. Citation2014; Kan et al. Citation2014). A factorial-type experiment was conducted by duplicated assays. Finally, the residence time after the final temperature was 3 h for all assays.
Pyrolysis process performance: The yield of the process was calculated by the relationship between the weight of the initial biomass and the weight of the products (bio-oil, biochar, or biogas) obtained (Vardon et al. Citation2013; Krause et al. Citation2019; Bok et al. Citation2012).
Characterisation of the condensed compounds:
Fuel analysis: The calorific power was determined using the ASTM D5865/D5865M-19 method in a Leco Ref. AC 350 calorimeter.
Gas chromatography (GC–MS): The bio-oil was treated as described by Gómez et al. with slight modifications (Gomez et al. Citation2021). The chemical profiles of the bio-oils were obtained using a gas chromatograph coupled to a Shimadzu QP-2020 mass spectrometer and equipped with a Shimadzu AOC-20i automatic injection port. The identityof the compounds was selected based on a comparison of their mass spectra with spectra from the NIST mass spectral library, selecting the compounds with more than 95% similarity. The content of compounds was measured by their relative peak areas. Quantification with a calibration curve was not performed, but the relative quantification of each compound in the chromatogram was made.
Infrared analysis (FTIR): Agilent Cary 630 FTIR equipment equipped with Agilent MicroLab software was used. The liquid transmittance measurement mode was used.
Determination of the total phenolic content (TPC): The Folin–Ciocalteu test was used to determine TPC using the procedure described by Loo et al. (Citation2007) with slight modifications.
DPPH free radical scavenging activity: The antioxidant activity was determined according to the (DPPH) method proposed by Brand-Williams et al. (Citation1995) with some modifications.
Evaluation of antioxidant activity by FRAP: The ferric-reducing antioxidant power of the samples was measured using the method described by Benzie and Strain (Citation1996) with slight modifications.
Results and analysis
Characterisation of spent coffee grounds: The composition of the elemental spent coffee grounds obtained by means of the analysis on a dry basis in comparison with the values reported for this biomass is shown in .
Table 1. Results of the elemental analysis and comparison on a dry basis with the reported values.
According to the results shown in , carbon (C) and oxygen (O) are the predominant elements in the composition of SCGs. Although the fractions obtained are close to the values reported by various authors (Vardon et al. Citation2013; Li et al. Citation2014; Kan et al. Citation2014; Bok et al. Citation2012; Matrapazi and Zabaniotou Citation2020), differences may be due to origin, brands, production process, and coffee quality. However, for all reports, the carbon content is higher than 47%, so the pyrolysis process could transform spent coffee grounds into biochar (Fuertes et al. Citation2010).
Proximal analysis of SCGs is shown in . The values for lignin, cellulose and hemicellulose vary in relation to the reported values by (Vardon et al. Citation2013; Li et al. Citation2014; Kan et al. Citation2014; Bok et al. Citation2012; Matrapazi and Zabaniotou Citation2020). Such variance may be linked to the brand, quality, origin, and production process of the coffee. The amount of hemicellulose is almost double that of lignin and cellulose; this benefits the pyrolysis process considering the easy degradation of hemicellulose (Yang et al. Citation2007) and the generation of aromatic components used in the manufacture of synthetic fibres, solvents, organic chemicals, and plasticisers (Yang et al. Citation2019).
Table 2. Proximal analysis and comparison.
A particle size between 190 and 300 µm was determined. These sizes are between the values reported by (Li et al. Citation2014; Bok et al. Citation2012). The initial moisture of the SGCs was 65%; it was then reduced to 10%, which is close to double the reported values (Chaiya Citation2011). The difference from the objective value (5%) could affect the thermal degradation of the biomass (Xiong et al. Citation2013; CitationGray et al.).
presents the results of TGA, and its respective DTG is shown in . According to the TGA and DTG curves, the comportment of the biomass with the different heating rates maintains the same trend. Additionally, the appearance of three zones can be observed. The first zone corresponds to the evaporation of the moisture present in the biomass (Polat and Sayan Citation2020) from 30 °C to 180 °C together with mass loss values close to 11%. The second zone, which occurred between 140 and 370 °C, forms the active pyrolytic zone (Polat and Sayan Citation2020). In this event, approximately 50% of the mass is lost with the decomposition of carbohydrates and lipids (Magdziarz and Werle Citation2014), including hemicellulose. Its decomposition temperature ranges from 220 °C to 315 °C. this is attributed to the amorphous structure or soluble regions of the material, which make it easy to hydrolyze. Resulting in low resistance to decomposition, in which the molecules are less compact and susceptible to hydrolysis, the open hydroxyl, or other type of bonds are open and ready to be decomposed in form of vapour water or other compounds (Yang et al. Citation2006; Zhao et al. Citation2012; Zhang et al. Citation2021). Considering that there are also reasonable levels of proteins, lipids, nitrogenous compounds, and nonstructural carbohydrates in biomass that can provide higher quality bio-oil (Fan et al. Citation2023), Chen W-H et al. presented that carbohydrates, proteins, and lipids degrade at temperatures of 164-497, 209-309, and 200-635 °C, respectively (Chen et al. Citation2018).
Figure 2. Thermogravimetric analysis (TGA) of spent coffee grounds at different heating rates.
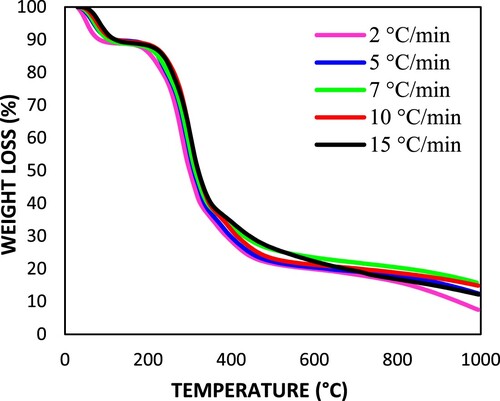
Figure 3. Differential thermogravimetric analysis (DTG) of spent coffee grounds at different heating rates.
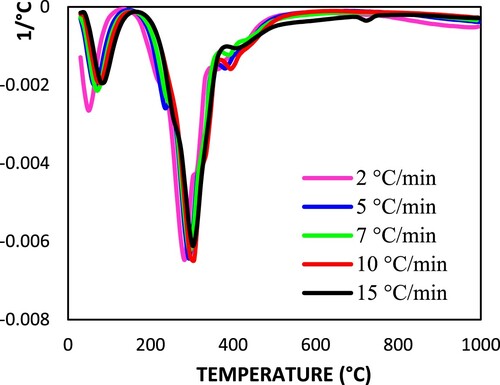
Another compound present in this event is cellulose; its decomposition temperature range is 315–390 °C. However, contrary to hemicellulose, it presents high resistance to hydrolysis because it is a long polymer of glucose without branches and crystalline (Yang et al. Citation2006). Finally, the third zone, between 344 and 410 °C and with a mass loss close to 14%, is closely related to the lignin content, whose thermal degradation is slow (< 0.15% in weight/°C) as a consequence of the strong reticulation that exists between the three types of benzene-propane of which it is composed. The strong reticulation is related with the connected network of Lignin. Which has a different level and variable cell wall degradability (Yang et al. Citation2006; Zhang et al. Citation2011). Their degradation temperatures are in the range of 160 °C to 900 °C (Chen et al. Citation2017), which generates a section with a flat trend at the end of the curve, similar to a complete stage of combustion with lower weight changes (Polat and Sayan Citation2020; Brachi et al. Citation2021).
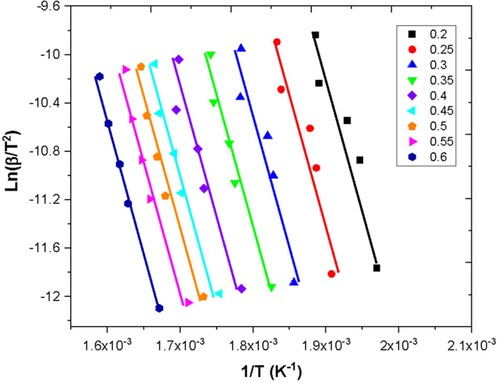
In addition to providing general information about overall reaction kinetics, thermogravimetry can also provide accurate kinetic parameters based on experimental results (CitationTian et al.). As previously stated, model-free methods that use multiple heating rates can provide a more reliable estimate of activation energy changes during pyrolysis. To obtain reasonable activation energy changes during the pyrolysis of Colombian coffee grounds, two model-free kinetic approaches (KAS and FWO) were used. Figures and show the linearisation of the KAS and OFW methods, respectively, to obtain the activation energy showing typical behaviours of the isoconversion methods, especially due to the apparent parallelism between all the regressions (Baroni et al. Citation2016).
Figure 4. Application of the KAS method to obtain the activation energy Ea.
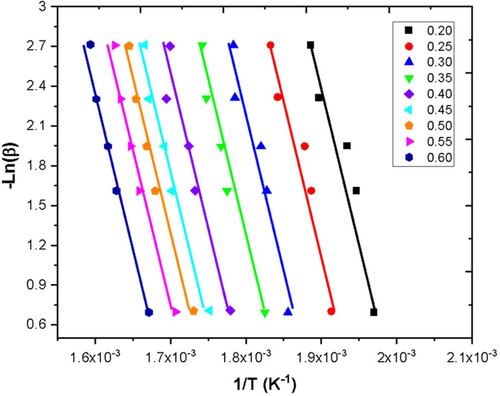
Figure 5. Application of the OFW method to obtain the activation energy Ea.
lists the activation energies obtained for different conversions. The models showed high correlation coefficients, indicating a good fit. According to the information provided, degradation on mixed biomass hemicellulose-cellulose displayed lower activation energies at temperatures between 250–300 °C for conversion fractions of 35–50%. The activation energies calculated by the KAS and FWO methods were almost identical, as demonstrated in . Both methods show a similar behaviour throughout the weight loss. Figures and represent the normalised conversion for the selected range of temperatures (200–370 °C) from the TGA results, including moisture evaporation until 180 °C, active pyrolysis (180–370 °C), and passive pyrolysis (Polat and Sayan Citation2020). In this way, the pyrolysis process will achieve a high percentage of thermal decomposition of the proposed biomass (spent coffee grounds). The isoconversional methods obtained from TGA present an approximated relation to what was observed in the pyrolyzer considering the kinetics and decomposition of the biomass.
Figure 6. Activation energy vs. reaction progress α.
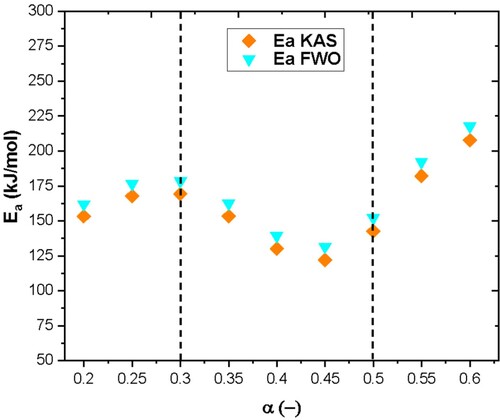
Figure 7. Conversion profiles of the thermal decomposition of SCGs as a function of temperature for five heating rates and the selected range of temperature for analysis.
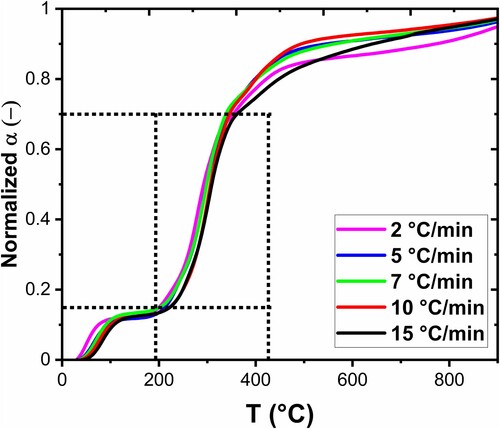
Figure 8. Normalized conversion profiles of the selected range of thermal decomposition of SCGs as a function of temperature for five heating rates.
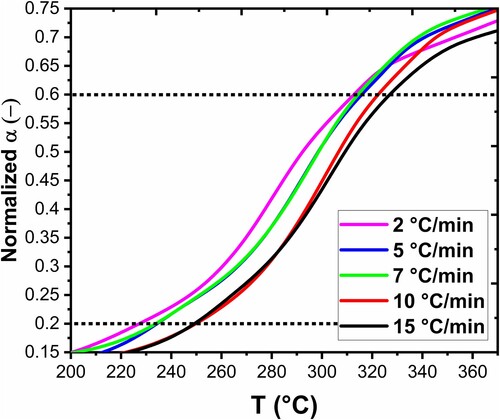
Table 3. Calculated E and A by the KAS and FWO methods
shows the mean values of the activation energy for each isoconversional method applied to the biomass during the fraction of conversion of 20–60%. Analogous to , the KAS method returns slightly lower activation energy values compared with the values obtained with the OFW method, and the type of precision of the OFW method may be related to its mathematical approach and crude approximation of the temperature integral (Starink Citation2003; Burnham and Dinh Citation2007). In contrast, the activation energies obtained in this study are very similar to those obtained for mixtures of sewage sludge and coffee grounds (Chen et al. Citation2017).
Table 4. Comparison of the activation energy between this work and other reports.
Pyrolysis process yield
The yield of each of the tests after weighing the obtained condensates is shown in . According to the results of each test, it can be observed that in the four cases, the oil yield ranges between 14% and 22%, and there was a greater oil production (22.46%) in the test that had conditions of 400 °C as the final temperature and a 15 °C/min ramp.
Table 5. Yield of pyrolysis tests (%).
The best yield under these conditions may be the effect of the total nondegradation of the lignin because, as observed in the tests that used 500 °C, it is a slow thermal degradation and results in a greater generation of charcoal (Yang et al. Citation2006). Likewise, the superiority in oil production using 400 °C agrees with the results obtained in the thermogravimetric analysis, in which the range of 280 °C to 350 °C is the best period of thermal degradation.
Regarding the impact of the heating ramp, it can be observed that it acts inversely at the selected temperatures because at 400 °C, the ramp of 15 °C/min was more efficient, while at 500 °C, the ramp of 30 °C/min had a greater performance. This may be a consequence of thermal cracking because it has a greater volatile effect at higher speeds after 350 °C (Chaiya Citation2011). In this case, oil production decreases due to the generation of secondary thermal cracking (Williams and Reed Citation2003).
Compared with the reported values, the yields obtained are close to those reported of 27% and 25% (Mohan et al. Citation2006). Their difference may be the result of factors such as different variables: in the case of Vardon et al. (Citation2013), the final temperature is 450 °C, the ramp is 50 °C/min, and the residence time is 2 h. For Chaiya (Citation2011), the main differentiating element is the configuration of the reactor because the one used in this study is a fluidized bed, with the added nitrogen flow rate as another variable.
Techno-economic models for the assessment of the conversion of biomass to valuable fuel products via fast pyrolysis and bio-oil upgrading have been studied with a cost of $0.21 l per liter to produce the bio-oil (Anex et al. Citation2010). Others calculate the capital cost of a bio-oil production facility with a capacity of 500 dry tonnes/day (Kumar and Sarkar Citation2011), and the total cost is $58 million. This cost could vary depending on the location of the plant around the world. The cost of SCG-biochar was found to be competitive at $7.22 per kilogram. The developed biofuel showed great potential for energy applications due to its high biochar yields, favourable fuel properties, and cost effectiveness (Lee et al. Citation2021).
Characterisation of the condensed compounds
Higher calorific power
The results obtained by the sample-test are broken down in . All samples exceeded 28 MJ/kg as a result of the high carbon content of the raw material. The calorific power corresponding to the condensables obtained in the test (400-15) is considerably low compared to the values obtained by the other tests in contrast to its high performance in oil production. Among these, the one obtained at 500 and 15 °C/min stands out, whose calorific value is higher than those obtained under the conditions of 400 °C – 30 °C/min and 500 °C – 30 °C/min for at least 1,0 MJ/kg. In general, the oil obtained at 500 °C shows a greater capacity to release energy, which may be related to the decrease in the fraction of cellulose derivatives and its high oxygen content at higher pyrolysis temperatures (Trinh et al. Citation2013).
Compared to the 32,3 MJ/kg reported (Vardon et al. Citation2013), the calorific value obtained is lower. This may be due to the difference between the process variables since, to obtain the reference value, the heating ramp used was 50 °C/min, and the final temperature was 450 °C (Vardon et al. Citation2013).
Oil composition study
Infrared analysis (FTIR): The typical FTIR spectrum of bio-oil from spent coffee grounds is shown in . The presence of a large and intense band of intermolecular O–H hydrogen bonds that stretches the vibration at 3350 cm−1, in-plane bending at 1246 cm−1, and out-of-plane bending at 668 cm−1 are indicators of the associated OH groups. The infrared spectra show that the absorption bands between the 3100 and 3018 cm−1 regions (aromatic C–H stretching vibration) indicate the aromaticity of bio-oils.
Figure 9. Fourier transform infrared (FTIR) spectroscopy for spent coffee ground bio-oil. Source: Elaborated by the author.
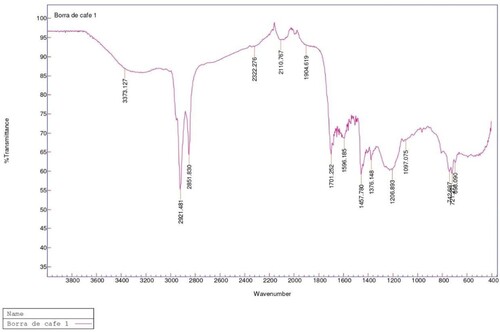
The presence of paraffinic compounds is evidenced by the absorption bands of 2918–2850 cm−1 arising from the C–H stretching vibration and by the 1450 and 1375 cm−1 bands of C–H bending of the methyl and methylene groups. The presence of olefinic compounds is confirmed by the band at 1645 cm−1, which represents the double bond, C = C stretching vibration. Identification work on spent coffee ground bio-oil reported aliphatic peaks, including C – H stretching (3000−2800 cm –1) and C–H bending (1465 cm –1, 1375 cm−1). A broad peak from 3400 to 3000 cm−1 and multiple sharp peaks from 1300 to 1100 cm−1 can be observed. C–O and O-H of carboxylic or alcohol groups were also noted, probably due to stretching, a finding consistent with compounds identified by GC–MS (Vardon et al. Citation2013).
It can be stated that the information obtained by FTIR is consistent. However, it does not allow specific identity to the bio-oil compounds to be granted. For this reason, it is necessary to conduct gas chromatography analysis coupled with mass spectrometry to identify the volatile and semivolatile fractions of bio-oil.
Gas chromatography analysis coupled to mass spectrometry
shows a typical chromatogram for bio-oil from spent coffee grounds.
Figure 10. Test chromatogram 500 °C – 30 °C/min. Source: Elaborated by the author.
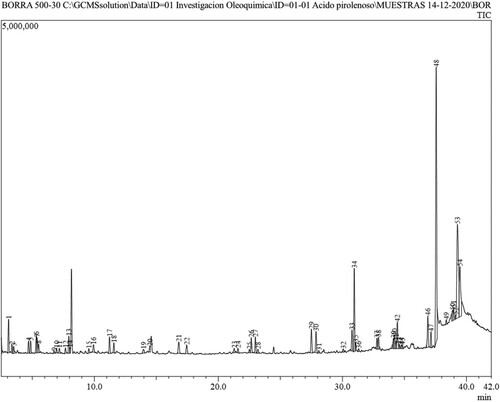
The chromatogram for 55 compounds of the bio-oil can be observed. presents the composition of the oil by family of compound, hydrocarbon, aromatic, acid and derivative, alcohol, and others. The largest number of components is fatty acids at 50.82%, highlighting palmitic acid at 27.7%, linoleic acid at 15.3%, and stearic acid at 6.8% of the total composition.
Figure 11. Families of bio-oil compounds from spent coffee grounds. Source: Elaborated by the author.
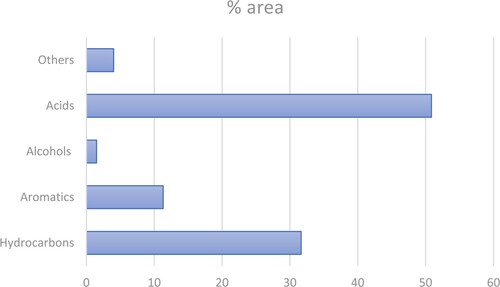
summarises the percentage composition by family of compounds.
The nonfractionated SCB bio-oil is characterised by its large number of acids and derivatives and linear and aromatic hydrocarbons. It is different from walnut shell pyroligneous acid and phenols, which represent 62.86% of the total amounts, followed by ketones (8.18%), organic acids (8.02%), and furan derivatives (1.77%). Generally, phenols and organic acids are the main components of walnut shell pyroligneous acids (Wei et al. Citation2010).
In general, the composition of bio-oil from spent coffee grounds is different compared to wood-yielding materials, given its high content of aromatic and linear hydrocarbons compared to bio-oils reported to be richer in phenolic compounds, for example, in guadua (Gomez et al. Citation2021), oak, pine, and cedar (Kim et al. Citation2013) bio-oils.
Compared to other bio-oils from SCGs, our study differs in the composition reported by (Vardon et al. Citation2013), with 10% linear and branched hydrocarbons, 4.3% cyclic aromatic hydrocarbons, 12.8% linear and branched oxygenates, and 17% cyclic oxygenates, but there is coincidence in the low proportion of nitrogenous compounds, less than 2% in both SCG bio-oils. Differences can be attributed to different reaction conditions and source materials.
Another report (Krause et al. Citation2019) of the composition of SCG bio-oil by GC–MS reported 30.4% acids, 3% alcohols, 7% esters, 1% ethers, 21% ketones, 12.6% nitrogenous compounds, and 17.5% phenols. In general, a marked difference is observed between bio-oil composition studies of SCGs.
Study of antioxidant capacity: Currently, the oxidative stability of biofuels is a barrier that has delayed greater sponsorship and mass commercialisation despite their growing demand, and this problem continues, for which reason studies on oxidative stability are still required (Moniru Citation2017), for example, developing techniques to improve the oxidative stability of biodiesel (Hazrat Citation2021). Some researchers (Kerkel et al. Citation2021) have reported the use of natural hydrophilic antioxidants in lipophilic biofuels without the need for classical surfactants, demonstrating the usefulness of natural antioxidants such as gallic acid, which exhibit significantly better antioxidant properties than their synthetic counterparts.
Some researchers (Geller et al. Citation2008) have reported the usefulness of antioxidants on the physical properties of biofuels for industrial boilers. The addition of antioxidants to the biofuel minimised changes in physical properties, such as film formation, changes in viscosity and specific gravity, and sedimentation.
Bio-oils can be used for power generation (García-Péres et al. Citation2007); however, their high acidity, low thermal stability, low calorific value, high viscosity, and poor lubrication characteristics limit their use as fuel for transport. There is currently no technology available to fully convert these bio-oils into transportation fuels. Therefore, there is an urgent need to develop new approaches to use some bio-oil fractions as additives or diluents for transportation fuels.
An example of these approaches may be the preparation of bio-oil/biodiesel blends, which may be an effective way to improve the oxidation stability of biodiesel, most likely due to the action of molecules such as phenols with antioxidant properties. The addition of bio-oils (less than 4%) with antioxidant properties to biodiesel improves its stability by up to 475%, which is enough to meet the European standard requirement (García-Pérez et al. Citation2010).
On the other hand, bio-oil containing antioxidants has been shown to prolong shelf life by reducing viscosity changes (Udomsap et al. Citation2011). In general, it can be said that the chemical and physical instability of pyrolysis crude oils produced by the liquefaction of lignocellulose constitutes a practical bottleneck for the storage and transport of bio-oils and for conversion to advanced biofuels.
Continued studies and technological innovations are required to enable efficiency and widespread implementation (Rosendahl Citation2017). This research contributes to the study of the antioxidant activity of bio-oil from SCGs as a base contribution for future research in this field. The study of the antioxidant activity of the oil offered an equivalent TPC in gallic acid (GA) with a concentration of 362 ± 44 mg GA g−1 by the Folin–Ciocalteu (FC) test.
The result is relatively high compared to the 242 ± 40 GA g−1 obtained in the TPC test of bio-oil obtained from wood biomass (CitationRover et al.). The result in our assay is particularly high if the absence of phenols in the composition of bio-oil obtained is considered; however, the result can be explained by the wealth of aromatic compounds and fatty acids and their derivatives that together exceed 60% of the total content of the bio-oil and, as nonphenolic compounds, can react with the FC reagents and are detected by the spectrophotometer. Therefore, they can increase the response with GA concentration (Way et al. Citation2020). For this reason, the method is considered nonspecific, as it relies on the selective oxidation of similar readily oxidizable substances that, when present, contribute to the apparent total phenol content.
Regarding the DPPH free radical scavenging activity, the free radical 2,2-diphenyl-1-picrylhydrazyl is one of the few nitrogen-containing organic radicals that is reduced in the presence of hydrogen-donating antioxidants, leading to the formation of DPPH-H (diphenylhydrazine) (Mathew et al. Citation2015), which is not a radical, due to the ability of the DPPH radical to form bonds with hydrogen atoms. Discolouration occurs due to the decreasing concentration of DPPH radicals in the solution (Aksoy et al. Citation2013). Therefore, the discolouration of DPPH is an indication of the radical scavenging activity of the analysed bio-oil samples. In this test, the colour changes from purple to yellow after reduction, which is quantified by the decrease in absorbance over time.
The percentage of inhibition determined is an indication of the antioxidant capacity of the bio-oil samples evaluated, with a DPPH activity of 24.8 ± 2% inhibition. This is compared to the 23.97% and 31.39% inhibition of the fractions obtained for bio-oil from slow pyrolysis of palm nut shells (Rabiu et al. Citation2019), which in this case presented a high concentration of catechol and its derivatives, hydroxy benzoic acid (43.31%), benzaldehyde (21.99%), 4-hydroxy-3,5-dimethoxy- (2.60%), and hydroquinone (1.67%).
Recent studies have shown that conjugated polyunsaturated chains (e.g. carotenes) are responsible for inhibiting free radical activity. For example, carotenoids that are based on structures of this type have excellent peroxyl radical scavengers (Sánchez et al. Citation2019), which is the case for the composition of SCG bio-oil that reveals a significant percentage of aromatic molecules derived from benzene, naphthalene, and indeno.
The result of the antioxidant activity by the FRAP method showed 108.5 ± 13.6 mg equivalents of Trolox L−1 solution. This indicates, in general, that bio-oil may have great potential to be used in different applications, in which redox mechanisms are the most relevant. These results are promising given the search for natural antioxidants to replace synthetic antioxidants in recent years (Kerkel et al. Citation2021). Certain synthetic antioxidants, such as butylated hydroxyanisole (BHA), butylated hydroxytoluene (BHT), and tertiary butylhydroxyquinone (TBHQ), are restricted due to side effects (e.g. carcinogenicity) (Valentão et al. Citation2002). Future research may allow adequate fractionation that enhances its antioxidant activity and determines its specific utility in biofuels and biolubricants (Chandrasekaran et al. Citation2016). Thus, the results of the ethanolic fraction are very promising due to its relatively high antioxidant activity.
Conclusions
For the present research, spent coffee grounds were used as raw material for the production of biochar and bio-oil by the fast pyrolysis reaction. Based on this process, an elemental analysis was conducted for the spent coffee grounds, and the results were 48.7% C, 6.5% H, 40.9% O, 2.1% N, and 0.1% S. The results showed that the pyrolysis reaction offers a maximum yield of 22.5% bio-oil at 400 °C/15 min, with a calorific value of 28.9 MJ/kg. Additionally, the activation energy at 5 heating rates was determined. A maximum biochar yield of 23.4% was found at 500 °C/30 min with a 30.3 MJ/kg calorific value.
The composition of the bio-oil was 50.86% fatty acids, 31.65% hydrocarbons, and 11.31% aromatics, and the other compounds were distributed among alcohols, nitriles, and ketones. The study of the antioxidant activity of the oil offered an equivalent total phenolic content (TPC) with a concentration of 362 ± 44 mg GA g−1 and DPPH activity of 24.8 ± 2% inhibition, and the antioxidant activity by the FRAP method showed 108.5 ± 13, 6 milligram equivalents of Trolox per L of solution. The results show that biochar and bio-oil have potential as biofuels due to their high calorific power. They are also promising materials for refinement to obtain chemical compounds of high added value, and they are even useful as inhibitors of free radicals. For the future perspective of the study, other optimisation parameters can be adopted to analyse the compensation of products such as slow pyrolysis or based on the response surface methodology of the central composite design (RSM-CCD) model.
Acknowledgements
The authors would like to thank the Universidad Santo Tomás, Bogotá Colombia, for funding the project. The authors also thank the Universidad Tecnológica de Pereira for the logistical support for evaluating the antioxidant capacity tests and characterising the bio-oil.
Disclosure statement
No potential conflict of interest was reported by the author(s).
References
- Aksoy, L., E. Kolay, Y. Ağılönü, Z. Aslan, and M. Kargıoğlu. 2013. “Free Radical Scavenging Activity, Total Phenolic Content, Total Antioxidant Status, and Total Oxidant Status of Endemic Thermopsis Turcica.” Saudi Journal of Biological Sciences 20 (3): 235–239. https://doi.org/10.1016/j.sjbs.2013.02.003.
- Anex, R. P., A. Aden, F. K. Kazi, J. Fortman, R. M. Swanson, M. M. Wright, J. A. Satrio, R. C. Brown, D. E. Daugaard, and A. Platon. 2010. “Techno-economic Comparison of Biomass-to-Transportation Fuels via Pyrolysis, Gasification, and Biochemical Pathways.” Fuel 89 (SUPPL. 1): S29–S35. https://doi.org/10.1016/j.fuel.2010.07.015.
- Ballesteros, L. F., J. A. Teixeira, and S. I. Mussatto. 2014. “Chemical, Functional, and Structural Properties of Spent Coffee Grounds and Coffee Silverskin.” Food and Bioprocess Technology 7 (12): 3493–3503. https://doi.org/10.1007/s11947-014-1349-z.
- Baroni, ÉDG, K. Tannous, Y. J. Rueda-Ordóñez, and L. K. Tinoco-Navarro. 2016. “The Applicability of Isoconversional Models in Estimating the Kinetic Parameters of Biomass Pyrolysis.” Journal of Thermal Analysis and Calorimetry 123 (2): 909–917. https://doi.org/10.1007/s10973-015-4707-9.
- Benzie, I. F. F., and J. J. Strain. 1996. “The Ferric Reducing Ability of Plasma (FRAP) as a Measure of ‘Antioxidant Power’: The FRAP Assay.” Analytical Biochemistry 239 (1): 70–76. https://doi.org/10.1006/abio.1996.0292.
- Bok, J. P., H. S. Choi, Y. S. Choi, H. C. Park, and S. J. Kim. Nov. 2012. “Fast Pyrolysis of Coffee Grounds: Characteristics of Product Yields and Biocrude oil Quality.” Energy 47 (1): 17–24. https://doi.org/10.1016/j.energy.2012.06.003.
- Brachi, P., V. Santes, and E. Torres-García. 2021. “Pyrolytic Degradation of Spent Coffee Ground: A Thermokinetic Analysis Through the Dependence of Activation Energy on Conversion and Temperature.” Fuel 302: 120995. https://doi.org/10.1016/j.fuel.2021.120995.
- Brand-Williams, W., M. E. Cuvelier, and C. Berset. 1995. “Use of a Free Radical Method to Evaluate Antioxidant Activity.” LWT - Food Science and Technology 28 (1): 25–30. https://doi.org/10.1016/S0023-6438(95)80008-5.
- Burnham, A. K., and L. N. Dinh. 2007. “A Comparison of Isoconversional and Model-Fitting Approaches to Kinetic Parameter Estimation and Application Predictions.” Journal of Thermal Analysis and Calorimetry 89: 479–490. https://doi.org/10.1007/s10973-006-8486-1.
- CH2MHILL. 2009. Waste to Energy Review of Alternatives.
- Chaiya, C. 2011. “Production Of Bio-Oil from Coffee Residue Using Pyrolysis Process.” Proceedings of the world congress on engineering and computer science, 2, 19–21.
- Chandrasekaran, S. R., D. Murali, K. A. Marley, R. A. Larson, K. M. Doll, B. R. Moser, J. Scott, and B. K. Sharma. 2016. “Antioxidants from Slow Pyrolysis Bio-Oil of Birch Wood: Application for Biodiesel and Biobased Lubricants.” ACS Sustainable Chemistry and Engineering 4 (3): 1414–1421. https://doi.org/10.1021/acssuschemeng.5b01302.
- Chen, W. H., Y. S. Chu, J. L. Liu, and J. S. Chang. Mar. 2018. “Thermal Degradation of Carbohydrates, Proteins and Lipids in Microalgae Analyzed by Evolutionary Computation.” Energy Conversion and Management 160: 209–219. https://doi.org/10.1016/J.ENCONMAN.2018.01.036.
- Chen, Jiacong, Jingyong Liu, Yao He, Limao Huang, Shuiyu Sun, Jian Sun, KenLin Chang, Jiahong Kuo, Shaosong Huang, and Xunan Ning. 2017. “Investigation of co-Combustion Characteristics of Sewage Sludge and Coffee Grounds Mixtures Using Thermogravimetric Analysis Coupled to Artificial Neural Networks Modeling.” Bioresource Technology 225: 234–245. https://doi.org/10.1016/j.biortech.2016.11.069.
- Demirbaş, A., and G. Arin. May 2002. “An Overview of Biomass Pyrolysis.” Energy Sources - Energy Source 24: 471–482. https://doi.org/10.1080/00908310252889979.
- Durán-Aranguren, D. D., Sebastian Robledo, Eduardo Gomez-Restrepo, Jorge W. Arboleda Valencia, and Natalia A. Tarazona. Dec. 2021. “Scientometric Overview of Coffee By-Products and Their Applications.” Molecules 26 (24): 7605. https://doi.org/10.3390/MOLECULES26247605.
- Fan, Q., P. Fu, C. Song, and Y. Fan. Jan. 2023. “Valorization of Waste Biomass Through Hydrothermal Liquefaction: A Review with Focus on Linking Hydrothermal Factors to Products Characteristics.” Industrial Crops and Products 191: 116017. https://doi.org/10.1016/J.INDCROP.2022.116017.
- Friedlingstein, P., M. O'Sullivan, M. W. Jones, R. M. Andrew, J. Hauck, A. Olsen, G. P. Peters, et al. Dec. 2020. “Global Carbon Budget 2020.” Earth System Science Data 12 (4): 3269–3340. https://doi.org/10.5194/essd-12-3269-2020.
- Fuertes, A. B., M. C. Arbestain, M. Sevilla, J. A. Maciá-Agulló, S. Fiol, R. López, R. J. Smernik, W. P. Aitkenhead, F. Arce, and F. Macias. 2010. “Chemical and Structural Properties of Carbonaceous Products Obtained by Pyrolysis and Hydrothermal Carbonisation of Corn Stover.” Australian Journal of Soil Research 48: 618–626.
- García-Péres, M., A. Chaala, H. Pakdel, D. Kretschmer, and C. Roy. 2007. “Characterization of bio-Oils in Chemical Families.” Biomass and Bioenergy 31 (4): 222–242.
- García-Pérez, M., T. T. Adams, J. W. Goodrum, K. Das, and D. P. Geller. 2010. “DSC Studies to Evaluate the Impact of bio-oil on Cold Flow Properties and Oxidation Stability of bio-Diesel.” Bioresource Technology 101 (15): 6219–6224.
- Geller, D. P., T. T. Adams, J. Goodrum, and J. Pendergrass. 2008. “Storage Stability of Poultry fat and Diesel Fuel Mixtures: Specific Gravity and Viscosity.” Fuel 87 (1): 92–102.
- Gnansounou, E., and C. M. Alves. 2019. “Chapter 8 - Integrated Sustainability Assessment of Biofuels.” In Biofuels: Alternative Feedstocks and Conversion Processes for the Production of Liquid and Gaseous Biofuels (Second Edition), edited by A. Pandey, C. Larroche, C.-G. Dussap, E. Gnansounou, S. K. Khanal, and S. Ricke, 197–214. Academic Press. https://doi.org/10.1016/B978-0-12-816856-1.00008-7.
- Gomez, J. P., J. P. A. Velez, M. A. Pinzon, J. A. M. Arango, and A. P. Muriel. 2021. “Chemical Characterization and Antiradical Properties of Pyroligneous Acid from a Preserved Bamboo, Guadua Angustifolia Kunth.” Brazilian Archives of Biology and Technology 64. https://doi.org/10.1590/1678-4324-2021190730.
- Gray, Murray R., William H. Corcoran, and George R. Gavalas. Pyrolysis of a Wood-Derived Material. Effects Of Moisture and Ash Content.
- Hazrat, M. A. 2021. “Techniques to Improve the Stability of Biodiesel: A Review.” Environmental Chemistry Letters 19 (3): 2209–2236.
- Jang, H., J. D. Ocon, S. Lee, J. K. Lee, and J. Lee. 2015. “Direct Power Generation from Waste Coffee Grounds in a Biomass Fuel Cell.” Journal of Power Sources 296: 433–439. https://doi.org/10.1016/j.jpowsour.2015.07.059.
- Jin, L., H. Zhang, and Z. Ma. 2018. “Study on Capacity of Coffee Grounds To Be Extracted oil, Produce Biodiesel and Combust.” Energy Procedia 152: 1296–1301. https://doi.org/10.1016/j.egypro.2018.09.185.
- Kan, T., V. Strezov, and T. Evans. Jan. 2014. “Catalytic Pyrolysis of Coffee Grounds Using NiCu-Impregnated Catalysts.” Energy & Fuels 28 (1): 228–235. https://doi.org/10.1021/ef401511u.
- Kerkel, F., D. Brock, D. Touraud, and W. Kunz. 2021. “Stabilization of Biofuels with Hydrophilic, Natural Antioxidants Solubilized by Glycerol Derivatives.” FUel 284: 119055.
- Kim, K. H., T. S. Kim, S. M. Lee, D. H. Choi, H. Y. Yeo, I. G. Choi, and J. W. Choi. 2013. “Comparison of Physicochemical Features of Biooils and Biochars Produced from Various Woody Biomasses by Fast Pyrolysis.” Renewable Energy 50: 188–195. https://doi.org/10.1016/j.renene.2012.06.030.
- Kim, E.-J., D. Seo, and K.-Y. Choi. 2020. “Bioalcohol Production from Spent Coffee Grounds and Okara Waste Biomass by Engineered Bacillus Subtilis.” Biomass Conversion and Biorefinery 10 (1): 167–173. https://doi.org/10.1007/s13399-019-00402-8.
- Krause, M. C., A. C. Moitinho, L. F. R. Ferreira, R. L. de Souza, L. C. Krause, and E. B. Caramão. 2019. “Production and Characterization of the Bio-Oil Obtained by the Fast Pyrolysis of Spent Coffee Grounds of the Soluble Coffee Industry.” Journal of the Brazilian Chemical Society 30 (8): 1608–1615. https://doi.org/10.21577/0103-5053.20190059.
- Kumar, A., and S. Sarkar. Jan. 2011. “Biohydrogen Production from Bio-oil.” Biofuels: Alternative Feedstocks and Conversion Processes, 481–497. https://doi.org/10.1016/B978-0-12-385099-7.00022-X.
- Lee, Xin Jiat, Hwai Chyuan Ong, Wei Gao, Yong Sik Ok, Wei Hsin Chen, Brandon Han Hoe Goh, and Cheng Tung Chong. May 2021. “Solid Biofuel Production from Spent Coffee Ground Wastes: Process Optimisation, Characterisation and Kinetic Studies.” Fuel 292: 120309. https://doi.org/10.1016/J.FUEL.2021.120309.
- Li, X., V. Strezov, and T. Kan. 2014. “Energy Recovery Potential Analysis of Spent Coffee Grounds Pyrolysis Products.” Journal of Analytical and Applied Pyrolysis 110: 79–87. https://doi.org/10.1016/j.jaap.2014.08.012.
- Loo, A. Y., K. Jain, and I. Darah. 2007. “Antioxidant and Radical Scavenging Activities of the Pyroligneous Acid from a Mangrove Plant, Rhizophora Apiculata.” Food Chemistry 104 (1): 300–307. https://doi.org/10.1016/j.foodchem.2006.11.048.
- Luz, F. C., S. Cordiner, A. Manni, V. Mulone, and V. Rocco. 2017. “Anaerobic Digestion of Coffee Grounds Soluble Fraction at Laboratory Scale: Evaluation of the Biomethane Potential.” Applied Energy 207: 166–175. https://doi.org/10.1016/j.apenergy.2017.06.042.
- Magdziarz, A., and S. Werle. Jan. 2014. “Analysis of the Combustion and Pyrolysis of Dried Sewage Sludge by TGA and MS.” Waste Management 34 (1): 174–179. https://doi.org/10.1016/j.wasman.2013.10.033.
- Mata, T. M., A. A. Martins, and N. S. Caetano. 2018. “Bio-refinery Approach for Spent Coffee Grounds Valorization.” Bioresource Technology 247: 1077–1084. https://doi.org/10.1016/j.biortech.2017.09.106.
- Mathew, S., Z. A. Zakaria, and N. F. Musa. 2015. “Antioxidant Property and Chemical Profile of Pyroligneous Acid from Pineapple Plant Waste Biomass.” Process Biochemistry 50 (11): 1985–1992. https://doi.org/10.1016/j.procbio.2015.07.007.
- Matrapazi, V. K., and A. Zabaniotou. 2020. “Experimental and Feasibility Study of Spent Coffee Grounds Upscaling via Pyrolysis Towards Proposing an eco-Social Innovation Circular Economy Solution.” Science of the Total Environment 718: 137316.
- Ministerio de Agricultura y Desarrollo Rural. 2017. “Estadísticas Agronet.” pp. 3–5.
- Mohan, D., C. U. Pittman, and P. H. Steele. 2006. “Pyrolysis of Wood/Biomass for bio-oil: A Critical Review.” Energy & Fuels 20: 848.
- Moniru, I. M. 2017. “Influence of Poly(Methyl Acrylate) Additive on Cold Flow Properties of Coconut Biodiesel Blends and Exhaust gas Emissions.” Renewable Energy 101: 702–712.
- Owen, A., and J. Kruijsen. 2013. “The Transition to Future Energy.” In Future Energy: Improved, Sustainable and Clean Options for our Planet, 2nd ed., vol. 2, 667–677. Boston: Elsevier. https://doi.org/10.1016/B978-0-08-099424-6.00030-2
- Parikh, J., S. A. Channiwala, and G. K. Ghosal. 2007. “A Correlation for Calculating Elemental Composition from Proximate Analysis of Biomass Materials.” Fuel 86 (12–13): 1710–1719.
- Polat, S., and P. Sayan. Mar. 2020. “Assessment of the Thermal Pyrolysis Characteristics and Kinetic Parameters of Spent Coffee Waste: A TGA-MS Study.” Energy Sources Part A: Recovery, Utilization, and Environmental Effects, 1–14. https://doi.org/10.1080/15567036.2020.1736693.
- Rabiu, Z., N. Mahmud, R. Hasham, and Z. Akmar Zakaria. 2019. “Characterization and Antioxidant Properties of Ethyl Acetate Fractions from Pyroligneous Acid Obtained by Slow Pyrolysis of Palm Kernel Shell.” Malaysian Journal of Fundamental and Applied Sciences 15 (5): 644–650.
- Ritchie, H., and M. Roser. 2017. “Fossil fuels,” Our world in data. https://ourworldindata.org/fossil-fuels.
- Rodríguez, N., and D. Zambrano. 2010. “Los Subproductos del Café: Fuente de Energía Renovable.” Cenicafé (0120–0178): 4–6.
- Rosendahl, L. 2017. Direct Thermochemical Liquefaction for Energy Applications. Woodhead Publishing. https://doi.org/10.1016/B978-0-08-101029-7.00006-0.
- Rover, M. R., L. Johnson, B. Lamsal, Y.-J. Lee, and B. Shanks. Analysis of Sugars and Phenolic Compounds in Bio-Oil.
- Rueda-Ordñez, Y. J., E. De Godois Baroni, L. K. Tinoco-Navarro, and K. Tannous. 2015. “Modeling the Kinetics of Lignocellulosic Biomass Pyrolysis.” In Innovative Solutions in Fluid-Particle Systems and Renewable Energy Management. https://doi.org/10.4018/978-1-4666-8711-0.ch004.
- Sánchez, N. F. S., R. S. Coronado, and B. H. C. Claudia Villanueva Cañongo. 2019. Antioxidant Compounds and Their Antioxidant Mechanism, no. tourism.
- Starink, M. J. 2003. “The Determination of Activation Energy from Linear Heating Rate Experiments: A Comparison of the Accuracy of Isoconversion Methods.” Themochimia Acta 404 (1–2): 163–176. https://doi.org/10.1016/S0040-6031(03)00144-8.
- Tian, Bin, et al. Coupling Pyrolysis and Gasification Processes for Methane-Rich Syngas Production: Fundamental Studies on Pyrolysis Behavior and Kinetics of a Calcium-Rich High-Volatile Bituminous Coal.
- Tokimoto, T., N. Kawasaki, T. Nakamura, J. Akutagawa, and S. Tanada. 2005. “Removal of Lead Ions in Drinking Water by Coffee Grounds as Vegetable Biomass.” Journal of Colloid and Interface Science 281 (1): 56–61. https://doi.org/10.1016/j.jcis.2004.08.083.
- Torga, G. N., and E. E. Spers. 2020. “Perspectives of Global Coffee Demand.” In Coffee Consumption and Industry Strategies in Brazil, edited by L. F. de Almeida, and B. Spers, 21–49. Elsevier. https://doi.org/10.1016/B978-0-12-814721-4.00002-0.
- Trinh, T. N., P. A. Jensen, K. Dam-Johansen, N. O. Knudsen, and H. R. Sørensen. Mar. 2013. “Influence of the Pyrolysis Temperature on Sewage Sludge Product Distribution, Bio-Oil, and Char Properties.” Energy & Fuels 27 (3): 1419–1427. https://doi.org/10.1021/ef301944r.
- Udomsap, P., Y. H. Yein, J. T. Hok Hui, B. Yoosuk, S. B. Yusuf, and S. Sukkasi. 2011. “Towards Stabilization of bio-oil by Addition of Antioxidants and Solvents, and Emulsification with Conventional Hydrocarbon Fuels.” 2011 international conference & utility exhibition on power and energy systems: issues and prospects for Asia (ICUE). https://ieeexplore.ieee.org/document/6497720/authors#authors
- Valentão, P., E. Fernandes, F. Carvalho, P. B. Andrade, R. M. Seabra, and M. L. Bastos. Aug. 2002. “Antioxidative Properties of Cardoon (Cynara Cardunculus L.) Infusion Against Superoxide Radical, Hydroxyl Radical, and Hypochlorous Acid.” Journal of Agricultural and Food Chemistry 50 (17): 4989–4993. https://doi.org/10.1021/jf020225o.
- Van Soest, P. J., J. B. Robertson, and B. A. Lewis. 1991. “Methods for Dietary Fiber,Neutral Detergent Fiber, and Nonstarch Polysaccharides in Relation to Animal Nutrition.” Journal of Dairy Science 74: 3583–3597.
- Vardon, Derek R., Bryan R. Moser, Wei Zheng, Katie Witkin, Roque L. Evangelista, Timothy J. Strathmann, Kishore Rajagopalan, and Brajendra K. Sharma. Oct. 2013. “Complete Utilization of Spent Coffee Grounds to Produce Biodiesel, bio-oil, and Biochar.” ACS Sustainable Chemistry and Engineering 1 (10): 1286–1294. https://doi.org/10.1021/sc400145w.
- Vyazovkin, S., A. Burnham, J. Criado, L. Pérez-Maqueda, C. Popescu, and N. Sbirrazzuoli. 2011. “ICTAC Kinetics Committee Recommendations for Performing Kinetic Computations on Thermal Analysis Data.” Thermochimica Acta 520 (1–2): 1–19.
- Way, M. L., J. E. Jones, D. S. Nichols, R. G. Dambergs, and N. D. Swarts. 2020. “A Comparison of Laboratory Analysis Methods for Total Phenolic Content of Cider.” Beverages 6 (3), https://doi.org/10.3390/beverages6030055.
- Wei, Q., X. Ma, Z. Zhao, S. Zhang, and S. Liu. 2010. “Antioxidant Activities and Chemical Profiles of Pyroligneous Acids from Walnut Shell.” Journal of Analytical and Applied Pyrolysis 88 (2): 149–154. https://doi.org/10.1016/j.jaap.2010.03.008.
- Williams, P. T., and A. R. Reed. Dec. 2003. “Pre-formed Activated Carbon Matting Derived from the Pyrolysis of Biomass Natural Fibre Textile Waste.” Journal of Analytical and Applied Pyrolysis 70 (2): 563–577. https://doi.org/10.1016/S0165-2370(03)00026-3.
- Xiong, S., J. Zhuo, B. Zhang, and Q. Yao. 2013. “Effect of Moisture Content on the Characterization of Products from the Pyrolysis of Sewage Sludge.” Journal of Analytical and Applied Pyrolysis 104: 632–639. https://doi.org/10.1016/j.jaap.2013.05.003.
- Yang, Y., Z. Luo, S. Li, and W. Wang. 2019. “Catalytic Pyrolysis of Hemicellulose to Produce Aromatic Hydrocarbons.” Bioresources 14 (3): 5816–5831.
- Yang, H., R. Yan, H. Chen, D. Ho Lee, and C. Zheng. 2007. “Characteristics of Hemicellulose, Cellulose and Lignin Pyrolysis.” Fuel 86: 1781–1788. https://doi.org/10.1016/j.fuel.2006.12.013.
- Yang, H., R. Yan, H. Chen, C. Zheng, D. H. Lee, and D. T. Liang. Jan. 2006. “In-Depth Investigation of Biomass Pyrolysis Based on Three Major Components: Hemicellulose, Cellulose and Lignin.” Energy & Fuels 20 (1): 388–393. https://doi.org/10.1021/ef0580117.
- Zhang, Y., T. Culhaoglu, B. Pollet, C. Melin, D. Denoue, Y. Barrière, S. Baumberger, and V. Méchin. 2011. “Impact of Lignin Structure and Cell Wall Reticulation on Maize Cell Wall Degradability.” 16th int. symp. wood, fiber pulping chem. - proceedings, ISWFPC, vol. 2, pp. 942–948.
- Zhang, H., L. Han, and H. Dong. 2021. “An Insight to Pretreatment, Enzyme Adsorption and Enzymatic Hydrolysis of Lignocellulosic Biomass: Experimental and Modeling Studies.” Renewable and Sustainable Energy Reviews 140 (12), https://doi.org/10.1016/j.rser.2021.110758.
- Zhao, X., L. Zhang, and D. Liu. Jul. 2012. “Biomass Recalcitrance. Part I: The Chemical Compositions and Physical Structures Affecting the Enzymatic Hydrolysis of Lignocellulose.” Biofuels, Bioproducts and Biorefining 6 (4): 465–482. https://doi.org/10.1002/BBB.1331.