
 ?Mathematical formulae have been encoded as MathML and are displayed in this HTML version using MathJax in order to improve their display. Uncheck the box to turn MathJax off. This feature requires Javascript. Click on a formula to zoom.
ABSTRACT
Electricity is one of the essential requirements for the economic development of a country. In Ethiopia, more than half of the total population does not have access to electric power. Micro-hydropower (MHP) is one of the most feasible renewable energy options for providing reliable electricity to rural areas. However, in low-income countries such as Ethiopia, the high price of a purpose-made turbine to generate electricity from MHP resources is difficult. This paper presents the feasibility study of a pump as a turbine (PAT) for MHP applications with and without impeller blade modification. The analysis was conducted in terms of initial investment cost, the net present value, payback periods, and the cost of energy. Decreasing blade thickness, blade tip rounding, adjusting blade inlet angle, and blade grooving, then comparing the result with PAT without modification and cross-flow turbine are the modification techniques considered in this research. Based on the projected system lifetime, the equivalent cost of power for the PAT and cross-flow turbines are 0.065 and 0.100 $/kWh respectively. The cross-flow turbine's payback period is 6.04 years, which is significantly longer than the PATs payback period of 3.42 years. From the entire study, it can be concluded that the MHP coupled with PAT provides a lower payback period and cheaper power production. Whereas, impeller blade modification has no significant advantage from the economic point of view. Generally, the impeller modification cost needs to be less than or equal to 25% of the initial cost of the PAT to use the less cost advantage of the PAT.
1. Introduction
Energy consumption is directly proportional to the amount of economic growth. In Ethiopia, the energy consumption is 45 kWh/capita which is the lowest when compared to the mean of 578 for Africa and 2752 kWh/capita for the world (Chandrasekharam and Chandrasekhar Citation2012; Evans Citation2012). The national electric access rate is also around 51.09% and less than 10% of the rural communities are connected to the national grid (Access to electricity Citationn.d.; Girma Citation2016). People in rural areas use traditional energy sources such as biomasses and dry cells to fulfil the energy demand causing environmental and economic problems (Getnet Zewde Citation2016; Gurung et al. Citation2011). However, the country has large water resources and has a reasonably high-installed capacity of 80 MW of standalone micro and Pico-hydropower plants (Degefu, He, and Zhao Citation2015). The natural topology of the country is also well suited to create storage reservoirs at relatively low costs and with little environmental and social disruption.
MHP plants are known for their potential to supply rural areas in developing countries with environmentally sound, affordable, and adequate energy, which will lead to an increase in employment opportunities, improvement of the ecological environment, poverty alleviation, improvement of living and cultural standards and economic development (Kengne Signe, Hamandjoda, and Nganhou Citation2017). Unlike Large hydropower, the reservoirs of MHP do not cover a large amount of space and there is no significant displacement of communities from their original home place. However, the share of MHP in the national energy pool is insignificant. The main reason is the corresponding purpose-made turbines are not affordable (Bozorgi et al. Citation2013).
Previous studies have focused on performance analysis and performance improvement of the PAT and a few studies are focused on the economic analysis. De Marchis et al. (Citation2016) explored the economic benefit of PATs to produce energy from the fluid line instead of conventional pressure dissipation devices. The result of the analysis showed that the use of PATs can be attractive in economic and energy recovery terms, considering the lower capital cost, when compared to traditional turbines. Motwani, Jain, and Patel (Citation2013) carried out a cost analysis of PAT and Francis turbine as a prime mover to improve the performance characteristics, intended to be compatible with economical way. The comparison is done according to overall efficiency, initial investment cost, life cycle cost analysis, and cost of electricity generation. The output of the study shows the cost of electricity generation for the Francis turbine is more expensive than the PAT.
The cost of electro-mechanical components in MHP plants is relatively higher than the large hydro systems, which varies from 35-40% of the total cost of the plant (Motwani, Jain, and Patel Citation2013). The cost can be brought down by using PAT instead of purpose-made turbines. Regarding the cost of PAT and generator, different authors have presented different approaches. Ramos, Borga, and Simão (Citation2009) considered the cost of a PAT to vary between 200–400 €/kW for nominal power lower than 40 kW. Carravetta et al. (Citation2013) planned the cost of the PAT and the generator to be 230 and 115 €/kW respectively. De Marchis et al. (Citation2014) used a cost per power unit of 2000 €/kW for PAT plus generator. In the research of (Chacón et al. Citation2019), a cost model, which estimates the cost per kW of the centrifugal PATs coupled with induction generators with the number of magnetic poles has been used.
Pumps-as-Turbines (PaTs) are investigated as a potential energy recovery and pressure regulating technology in (Rossi et al. Citation2019), with a case study of the Egna municipality WDN, a city in northern Italy. Based on WDN operating data, a unique analytical approach is used to choose PaTs and forecast machine performance under changing operating situations. For modelling two different set-up configurations and installations, a MATLAB Simulink model is created.
The study in Ali et al. (Citation2023), proposed a novel strategy for developing Pakistan's energy by creating small-hydropower utilising Pump-As-Turbine (PAT), a type of renewable energy with a lower environmental impact that has not previously been used in Pakistan.
The study in Qian et al. (Citation2016) carried out a performance evaluation of an axial-flow pump with adjustable guide vanes in turbine mode. The pump as turbine (PAT) was chosen to replace the conventional turbine to lower the initial capital cost and payback period.
A prototype of an axial pump was developed to assess the pump's parameters, such as head and efficiency, in the pump mode in Zhao et al. (Citation2020), which was used to confirm the simulation approach.
The goal of the work in Kan et al. (Citation2023) is to analyze the energy loss characteristics and flow dynamics of an axial-flow PAT in both pump and turbine operating modes. In order to offer an energy loss intensity model in the cylindrical coordinate system, it employs the numerical simulation approach and makes use of the entropy production theory. This model quantitatively provides the spatial variation pattern for energy losses in pump and turbine operating modes.
A few research works were extensively conducted for the economic analysis of PAT for power-generating applications. Whereas, the economic analysis of PAT with impeller modification is not studied yet. This paper aims to conduct a detailed economic analysis of PAT with and without impeller blade modification for power-generating applications by considering a small village having 23 householders in the base year 2022. The economic analysis is conducted based on initial investment cost, net present value, payback period, and the cost of energy.
The major contributions of this paper are:
A comprehensive economic analysis of pump as a turbine (PAT) with and without impeller blade modification for power-generating applications.
When the PAT is used instead of a purpose-built turbine, up to 15% of the original investment cost can be saved.
The findings of the study show that the MHP coupled with PAT provides a lower payback period and cheaper power production.
The proposed PAT has various advantages over the traditional hydro-turbines which include low costs, low complexity, quick delivery, simplicity of replacement of parts, simple installation, availability in a wide range of standard diameters, and mass manufacture for a wide range of heads and flow rates.
2. Materials and method
To prove the economic feasibility of PAT application in MHP development the net present value (NPV), payback periods (PBP), and the cost of energy (Ec) were evaluated. Information, such as initial investment costs (IIC), maintenance costs (Mc), and feed-in tariffs were considered to be able to draw more general conclusions.
Major assumptions made in the economic assessment are: –
The expected life of the power plant is 30 years (Girma Citation2016).
The lifespan of the PAT is considered 15 years (Kramer, Terheiden, and Wieprecht Citation2018).
The PAT cost has been calculated according to the BEP of the PAT.
The maintenance cost of the MHP system is assumed to be 5% of the total capital cost per the project duration, PATs are known for their lower maintenance cost (De Marchis et al. Citation2016).
The salvage value of the basic components of the system is 15% of the initial investment cost (Nasir Citation2019).
360 operating days per year (five days are leaving for maintenance work).
The discount rate was assumed to be 12% (this is the current interest rate of the country),
Maximum PAT efficiency is considered as 65.5% (Nasir et al. Citation2022).
2.1. Potential assessment of the candidate sites
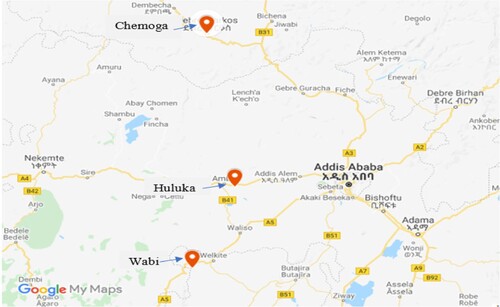
According to the mean annual water surplus of the country, the most promising sites are found in the western part of the country, since suitable topographic conditions and constant flows are found most commonly (Meder and Bubenzer Citation2011). Three sites i.e. Chemoga, Huluka, and Wabi as shown in are found in the western part of the country are selected as candidate sites.
Figure 1. Location of candidate sites.
The recorded mean annual flow presented in was analysed using the flow duration curve analysis technique. The probability that a recorded flow will be equalled or exceeded (% of the time) can be calculated using the Weibull plotting position given by Equation (1) (Koteia et al. Citation2016), this gives a steep curve as shown in .
(1)
(1) where:
= is the Exceedance probability
Figure 2. Flow duration curve of the three sites.
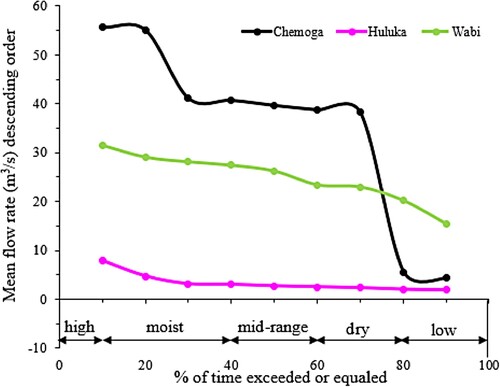
Table 1. Mean annual flow descending order of Chemoga, Huluka, and Wabi Rivers.
= is the ordering number,
for maximum flow rate.
= is the number of mean flows (dimensionless).
Among the three candidates, at dry conditions and low flows, the Wabi river is found to be the best one as shown in . In addition to these Wabi is selected for practical reasons to visit the field and to meet the respective teams for interviews and discussions, besides, unavailability of electricity is a big problem in the area. The topography is also suitable for hydropower generation. Therefore, the hydraulic data of Wabi river and the topographical information of the place are considered in the research.
2.1.1. Power capacity of the selected site
Accurate measurement of head and flow is very important to calculate the energy potential, the system’s pipeline size, turbine type, rotational speed, and generator size. The net head of the site is determined at the bottom of the penstock, by subtracting friction loss from the gross head using Equation (2).
(2)
(2) where
is the actual head available at the inlet of the PAT,
is the gross head, and
is the total friction loss through the piping system, which is defined as Equation (3).
(3)
(3) Head loss in the penstock (
) is the major loss through the pipe and can be calculated from the Darcy-Weisbach equation (Nasir Citation2019).
(4)
(4) The Darcy friction factor (
) can be determined from the standard Moody diagram, or by solving from the Blasius (Equation (5)), Swamee-Jain (Equation (6)), or Haaland equations (Equation (7)) (Brown Citation2017).
(5)
(5)
(6)
(6)
(7)
(7) where Re is the Reynolds number. In Equations (6) and (7), r is the relative roughness of the penstock.
The result of the Darcy friction factor solved using the mentioned methodologies is summarised in .
Table 2. Calculation of Darcy friction factor (f).
The loss coefficient for pipe components (minor loss) (i.e. elbow, valve, and fittings) can be solved by using Equation (8). Screening and velocity losses are also considered using Equation (9).
(8)
(8)
(9)
(9) Now, considering all possible system losses, taking the average Darcy friction factor f = 0.02, friction loss, and net head as a function of flow rate were tabulated in .
Table 3. Head losses as a function of flow rate.
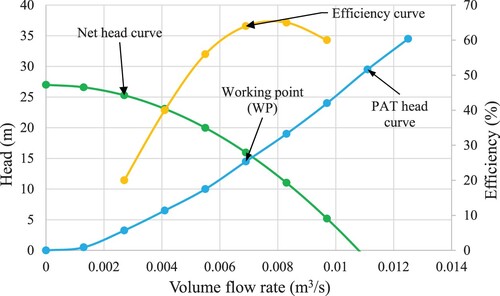
The working point is the net head flow corresponding to the PAT function, taking into account the head losses in the pipe system. To determine this point, the intersection points of the net head curve with the PAT characteristic curve (Nasir et al. Citation2022) shown in give the working point of the PAT in the designed system.
Figure 3. Performance characteristics of the Piping system.
After solving the net head of the system, the power capacity in the PAT is given as (Kengne Signe et al. Citation2017):
(10)
(10) where
= Power generated in the PAT’s shaft [
],
= the design flow rate [m3/s],
= gravitational acceleration [m/s2],
= net head [
],
= PAT efficiency [%].
2.1.2. Load estimation
Predicting the power demand (generator load) of the consumers connected to the PAT is especially important for isolated operations (Maalawi Citation2020). A small village with twenty-three householders is considered for this work. The loading table presented in shows the total power requirements over the day for lighting, radio, and phone charger.
Table 4. Peak load calculation of power demand.
The maximum power demand is the sum of the total power of selected devices. The maximum power demand as shown in is equals to 494.5 W. An increase in power demand during the lifetime of the project can usually be expected. Considering additional twenty-five percent power demand for future applications and power losses i.e. the total power demand of the area becomes 620.0 W. The demand for electrical power based on the number of populations and their activities can also be determined by using Equation (11) (Kengne Signe et al. Citation2017):
(11)
(11) where
is future needs of electrical power,
is the lifetime of the project,
electrical power needs per household, Po is the current population number of the area, α is the annual growth rate of the population (Population growth (annual %)-Ethiopia, Citation2020), and m is the average number of persons per household.
2.2. Profitability analysis
Every project needs to profitability evaluation to make sure that it is feasible or not. In addition to the evaluation of initial investment cost the profitability of micro-hydro power using the pump as a turbine is conducted in terms of net present value (NPV) payback period (PBP), and the cost of energy.
2.2.1. Initial investment cost (IIC)
The initial costs are extremely site-specific and can be divided into electromechanical (PAT + generator with the piping system) and civil work. In terms of the civil work, ten percent of the electro-mechanical cost is allocated since the designed plant requires a weir that serves as a waterway. To complete the economic assessment, the profitability analysis is conducted based on the net present value (NPV) and the payback period (PBP) was carried out.
2.2.2. Net present value (NPV)
NPV is the difference between the present value of cash inflows and the present value of cash outflows (represents the investment cost of the project) over a period of time. The present value of cash inflow is defined by Equation (12) by considering the time value of money.
(12)
(12) The mathematical expression of the net present value is expressed in Equation (13). In which,
is cash flow (revenues-cost within the specified year),
is the number of periods,
= internal rate of return (interest/discount rate), and
is initial investment cost. If
is greater than or equal to zero, the project is profitable. From , the present value of cash inflow is greater than the present value of cash outflow. Therefore, it can be concluded that the proposed project is profitable in terms of the net present value.
(13)
(13)
Table 5. Net cash in/out outflow.
According to the information from the Ethiopian Electric Utility (EEU), the current tariff for electricity is $0.06/kWh which includes all components of the electricity bill such as the cost of power, distribution, and taxes. The Annual revenue expressed in $/year can be calculated as the product of the energy cost and the yearly energy production (YEP) subtracting the maintenance cost () (see Equation 14). Considering a continuous service for 360 days per year the annual revenue is 654.70 USD.
(14)
(14)
2.2.3. Payback period (PBP)
The payback Period (PBP) was used in this study to determine the period needed to recover the initial investment cost (Chacón et al. Citation2019). To estimate the payback period of the project, net present value curves are determined with a discount rate of = 12%. This is the intersection of NPV curve and abscissa as shown in . The exact value of PBP can be calculated as the ratio between the total installation cost and annual revenue using Equation (15). It has to be highlighted that for MHP projects, the PBP has to be lower than 10 years to be considered economically viable if it is greater than or equal to 10 years the project were discarded (Chacón et al. Citation2019; De Marchis et al. Citation2014). The results of the payback period evaluation presented in shows the economic benefits of the project, with an attractive payback period of approximately 3.42 years.
(15)
(15)
Figure 4. Payback period of the project.
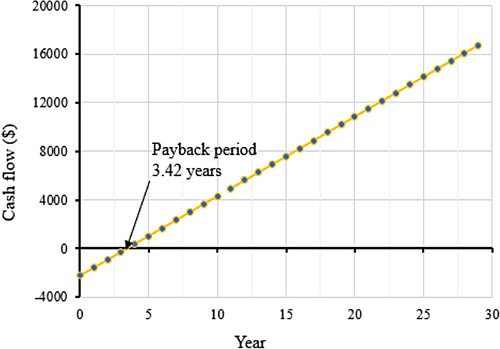
Table 6. Economic feasibility of PAT: Cost and payback analysis.
2.3. Cost of impeller modification
In this study, decreasing blade thickness, blade tip rounding, adjusting blade inlet angle, and blade grooving modification techniques with respective efficiency of 66.89%, 68.34%, 69.58%, and 70.06% are analysed, and then compare the result with the initial PAT (pump without modification) (Nasir et al. Citation2022). Intuition, comparison, analogical, parametric, and analytical methods are the main techniques that serve for estimating the cost of impeller modifications. Among the five listed methods, the analytical method is found to be the most accurate one. In which both direct and indirect costs are considered. The cost of materials, cost of labour, and cost of the machinery (including tool and energy costs) are used to calculate the total cost to improve performance (Vijayaramanath et al. Citation2009).
The listed modification techniques do not charge the material cost, since the modification is done on the initial blades. So, labour and machinery costs are calculated to estimate the total cost.
Face milling and slotting are used to decrease blade thickness and grooving respectively. The labour cost for machining can be calculated by using Equation (16) (Adithan Citation2007). Regarding the machinery cost, the cost of multi-axis machinery (including tax, tool cost, and power cost) is in the range of $75-$120 per hour (CNC Machining Cost Calculation, (Citationn.d.).
(16)
(16) where
is total operation time, the sum of basic machining time and allowances.
The basic formula used for determining the machining time (T) is:
(17)
(17) where L = length of total tool travel in mm, it is the sum of the length of the job and added table travel.
(18)
(18) where, D = cutter diameter W = width of the workpiece
for milling cutters, feed per revolution equals feed per tooth times the number of teeth on the cutter (Adithan Citation2007). A cutter with 2 teeth number is suggested for face milling and a cutter with 3 teeth number is suggested for slotting when the surface roughness is considered (Kaining Shi et al. Citation2019).
In Equation (19), N is the angular velocity of the workpiece in rpm. It is defined as follows.
(19)
(19) where, S is the cutting speed of the tool in metres per minute, average cutting speeds and feeds per tooth for various materials are given in and .
Table 7. Feed per tooth of cutters.
Table 8. Cutting speed of different materials.
In Equation (16), time allowances include personal allowances (5% for males and 7% for females, fatigue allowances 5%, and contingency allowances less than 5% of basic machining time). The average hourly labour wage in Ethiopia is 1.5 USD (Ethiopia 2020). In all cases, the labour cost should be multiplied by six, because the impeller has six blades.
Surface grinding is a machining method used to round the blade tip and adjust blade inlet angles, estmation of time (T) in seconds for grinding is calculated by the general equation in Equation (16) (Adithan Citation2007). Specifically, for surface grinding, the machining time can be calculated as:
(20)
(20)
is the length of the workpiece + allowance/over travel (mm),
is the width of the workpiece (mm),
is the speed of the table in m/min (Equation (19)).
Most surface grinding operations use wheel speeds of 1,800–2,100 m/min (Girma Citation2015),
is feed mm/stock.
The number of passes (n) can be defined by Equation (21).
(21)
(21) where, d is the depth of stock to be removed (the length of the material to be removed) and t depth per cut (for finishing the depth of cut is from 0.15–0.025 mm) (James et al. Citation2013).
The cost of machinery includes the estimated power cost and maintenance charges for the tools, jigs, fixtures, and dies required in the production. The depreciation amount per year (D) of the machine can be calculated using Equation (22).
(22)
(22) where C is the initial cost of the machine, S is the scrap (or salvage) value, and n is the estimated life of the machine in years.
The estimated total cost is the sum of the labour costs and machinery costs since the cost of materials in this case is zero. lists the costs of the pump running as a turbine with and without impeller modification. The cost of a purpose-made turbine i.e. cross-flow turbine (mostly used in micro-hydropower systems in developing countries (Ali et al. Citation2023; Kan, Binama et al. Citation2022; Kan, Chen. et al. Citation2021; Kan, Xu et al. Citation2022; Kan, Yang, et al. Citation2021; Kan, Zang, et al. Citation2022; Ram Adhikari Citation2018; Simão et al. Citation2019) is also presented in the same table. The cost of energy for both PAT and cross-flow turbine can be calculated using Equation (23) (Motwani et al. Citation2013).
(23)
(23)
Table 9. Costs and payback period of PAT and cross-flow turbine.
where ALCC is the annual life cycle cost and Ae is the annual energy generation.
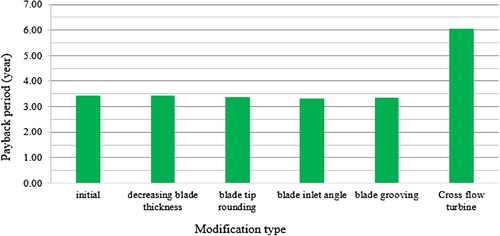
Blade tip rounding, blade inlet angle, and blade grooving have lower payback periods when compared with decreasing blade thickness and PAT without modification. Generally, the difference between the payback periods for the applied modification techniques is not significant as shown in . The payback period of a cross-flow turbine is 6.04 years, it much higher than the PATs payback period i.e. 3.42 years.
Figure 5. Payback periods for different modification techniques and cross-flow turbine.
The cost of energy in the case of a cross-flow turbine is 0.100 $/kWh while the average cost of energy for the pump running as a turbine is 0.062 $/kWh. Therefore, the cost of energy of the MHP coupled with PAT is decreased by 38%. From and , the payback period and the cost of energy for the PAT without impeller modification is 3.42 years and 0.0642 $/kWh respectively.
Figure 6. Payback period and cost of energy for impeller modification.
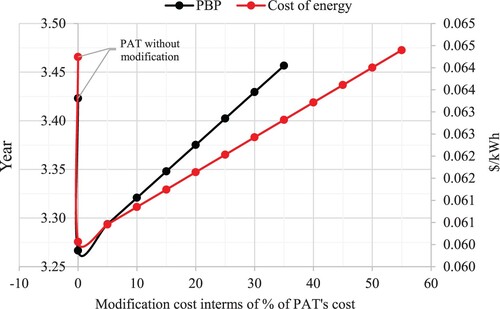
These values dramatically decreased to 3.27 years and 0.0601 $/kWh for impeller modification with zero cost. Practically, impeller modification with zero cost is not possible, therefore increasing the cost of modification from zero up to the maximum viable cost. shows if the modification cost is greater than 30% of PAT’s cost the project needs more payback period than PAT without modification. For the cost of energy, the modification cost should be less than 50% of the cost of PAT. Generally, the modification cost needs to be less than or equal to 25% of the initial cost of the PAT to use the less cost advantage of PAT.
3. Conclusion
This study presents the economic analysis of a PAT as a power generating application, considering the site located in south-west Ethiopia. The economic benefits of impeller modification are also analysed. The economic analysis indicators, implemented in this research show that the application of PAT for MHP projects plays an important role in decreasing the payback period and the cost of energy. This research study aims to figure out the cost of impeller modification, which makes the project more profitable. From the results achieved, the following can be concluded:
Based on the projected system lifetime, the energy generation cost and payback period of the MHP plant coupled with PAT are approximately 40% less than the cross-flow turbine. Furthermore, readily available maintenance knowledge in the local areas further reduces the operational cost.
Up to 15% of the initial investment cost can be saved when substituting PAT instead of using a purpose-made turbine.
To take advantage of PAT's lower cost advantage, impeller blade alteration should be implemented as cheaply as possible.
Overall, the results confirm that the MHP coupled with PAT has a positive impact to increase the viability of utilising MHP resources. Impeller modification has no remarkable advantage from an economic point of view. Future studies will be extended to identify other potential hydro-power resources like irrigation networks, to increase the total energy production. The application of more than one pump can also be considered in future works to expand the economic and environmental advantage to other villages.
Availability of data
The datasets generated during and/or analysed during the current study are not publicly available but are available from the corresponding author on reasonable request.
Disclosure statement
No potential conflict of interest was reported by the author(s).
Additional information
Funding
References
- Access to electricity (n.d.). (% of population) - actual values, historical data, forecasts and projections, World Bank January (2023). https://www.macrotrends.net/countries/ETH/ethiopia/electricity-access-statistics.
- Adithan, M. 2007. Process Planning and Cost Estimation.
- Ali, A., J. Yuan, H. Javed, Q. Si, I. Fall, I. E. Ohiemi, F. Ko, and R. U. Osman. 2023a. “Islam, Small hydropower generation using pump as turbine; a smart solution for the development of Pakistan’s energy.” Heliyon 9: e14993. https://doi.org/10.1016/j.heliyon.2023.e14993.
- Ali, A., J. Yuan, H. Javed, Q. Si, I. Fall, I. E. Ohiemi, F. K. Osman, and R. ul Islam. 2023b. “Small hydropower generation sing pump as turbine; a smart solution for the development of Pakistan's energy.” Heliyon 9 (4): e14993. https://doi.org/10.1016/j.heliyon.2023.e14993.
- Bozorgi, A., E. Javidpour, A. Riasi, and A. Nourbakhsh. 2013. “Numerical and experimental study of using axial pump as turbine in Pico hydropower plants.” Renewable Energy 53: 258–264. https://doi.org/10.1016/j.renene.2012.11.016.
- Brown, G. O. 2017. The History of the Darcy-Weisbach Equation for Pipe Flow Resistance. https://doi.org/10.1061/40650(2003)4.
- Carravetta, A., G. del Giudice, O. Fecarotta, and H. M. Ramos. 2013. “PAT design strategy for energy recovery in water distribution networks by electrical regulation.” Energies 6: 411–424. https://doi.org/10.3390/en6010411.
- Chacón, M. C., J. A. R. Díaz, J. G. Morillo, and A. McNabola. 2019. “Pump-as-turbine selection methodology for energy recovery in irrigation networks: Minimising the payback period.” Water (Switzerland 11), https://doi.org/10.3390/w11010149.
- Chandrasekharam, D., and V. Chandrasekhar. 2012. Clean Development Mechanism through Geothermal : Ethiopian Scenario, 21–23.
- CNC Machining Cost Calculation. (n.d.). https://www.rapiddirect.com/blog/cnc-machining-cost-calculation/.
- Degefu, D. M., W. He, and J. H. Zhao. 2015. “Hydropower for sustainable water and energy development in Ethiopia.” Sustainable Water Resources Management 1: 305–314. https://doi.org/10.1007/s40899-015-0029-0.
- De Marchis, M., C. M. Fontanazz, G. Freni, A. Messineo, B. Milici, E. Napoli, V. Notaro, V. Puleo, and A. Scopa. 2014. “Energy recovery in water distribution networks. Implementation of pumps as turbine in a dynamic numerical model.” Procedia Engineering 70: 439–448. https://doi.org/10.1016/j.proeng.2014.02.049.
- De Marchis, M., B. Milici, R. Volpe, and A. Messineo. 2016. “Energy saving in water distribution network through pump as turbine generators: Economic and environmental analysis.” Energies 9. https://doi.org/10.3390/en9110877.
- Evans, A. 2012.. Resources, risk and resilience : scarcity and climate change in Ethiopia, 57.
- Getnet Zewde, T. A. 2016. “Socio-Economic and Environmental Impacts of Micro-Hydro Power plants (Case Study on Jimma Zone-Shebe Sonbo Leku Woreda, Ethiopia).” International Journal of Engineering and Research Technology 5: 607–612. http://www.ijert.org.
- Girma, Z. 2015. “Techno-economic analysis of photovoltaic pumping system for rural water supply in Ethiopia.” International Journal of Sustainable Energy 36 (3): 277–295. https://doi.org/10.1080/14786451.2015.1017498.
- Girma, Z. 2016. “Techno-Economic Feasibility of Small Scale Hydropower in Ethiopia: The Case of the Kulfo River, in Southern Ethiopia.” J. Renew. Energy, 1–12. https://doi.org/10.1155/2016/8037892.
- Gurung, A., I. Bryceson, J. H. Joo, and S. E. Oh. 2011. “Socio-economic impacts of a micro-hydropower plant on rural livelihoods.” Scientific Research and Essays 6: 3964–3972. https://doi.org/10.5897/sre10.766.
- Hire In Ethiopi. 2020. https://www.skuad.io/hire-remote-team/ethiopia.
- James, J., B. John, and M. T. Sijo. 2013. Machining Time Required For Taper Grinding and Its Cost Analysis in G17-22U Grinding Machine, 3 1–5.
- Kaining Shi, L. K., Ning Liu, Sibao Wang, Chi Ma, Bo Yang, and Yi Lili. Study of Effect of Teeth Number on Cutting Force for Cutter Selection in the End Milling of TC4, ASME 2019 14th Int. Manuf. Sci. Eng. Conf. (n.d.). https://doi.org/10.1115/MSEC2019-2807.
- Kan, K., M. Binama, H. Chen, Y. Zheng, D. Zhou, W. Su, and A. Muhirwa. 2022a. “Pump as turbine cavitation performance for both conventional and reverse operating modes: A review.” Renewable and Sustainable Energy Reviews 168: 112786. https://doi.org/10.1016/j.rser.2022.112786.
- Kan, K., H. Chen, Y. Zheng, D. Zhou, M. Binama, and J. Dai. 2021a. “Transient characteristics during power-off process in a shaft extension tubular pump by using a suitable numerical model.” Renewable Energy 164: 109–121. https://doi.org/10.1016/j.renene.2020.09.001.
- Kan, K., Z. Xu, H. Chen, H. Xu, Y. Zheng, D. Zhou, A. Muhirwa, and B. Maxime. 2022ba. “Energy loss mechanisms of transition from pump mode to turbine mode of an axial-flow pump under bidirectional conditions.” Energy 257: 124630. https://doi.org/10.1016/j.energy.2022.124630.
- Kan, K., Z. Yang, P. Lyu, Y. Zheng, and L. Shen. 2021b. “Numerical study of turbulent flow past a rotating axial-flow pump based on a level-set immersed boundary method.” Renewable Energy 168: 960–971. https://doi.org/10.1016/j.renene.2020.12.103.
- Kan, K., Q. Zhang, Z. Xu, Y. Zheng, Q. Gao, and L. Shen. 2022bb. “Energy loss mechanism due to tip leakage flow of axial flow pump as turbine under various operating conditions.” Energy 255: 124532. https://doi.org/10.1016/j.energy.2022.124532.
- Kan, K., F. Zhao, H. Xu, J. Feng, H. Chen, and W. Liu. 2023. “Energy performance evaluation of an axial-flow pump as turbine under conventional and reverse operating modes based on an energy loss intensity model.” Physics of Fluids 35 (1), https://doi.org/10.1063/5.0132667.
- Kengne Signe, E. B., O. Hamandjoda, and J. Nganhou. 2017. “Methodology of Feasibility Studies of Micro-Hydro power plants in Cameroon: Case of the Micro-hydro of KEMKEN.” Scientific Energy Procedia 119: 17–28. https://doi.org/10.1016/j.egypro.2017.07.042.
- Koteia, R., W. AgyeiAgyareb, N. Kyei-Baffourc, T. Atta-Darkwad, and E. TakyiAtakora. 2016. “Estimation of flow-duration and low-flow frequency parameters for the Sumanpa Stream at Mampong- Ashanti in Ghana for the 1985-2009 period.” American Scientific Research Journal of Engineering Technology Science 15: 62–75.
- Kramer, M., K. Terheiden, and S. Wieprecht. 2018. “Pumps as turbines for efficient energy recovery in water supply networks.” Renewable Energy 122: 17–25. https://doi.org/10.1016/j.renene.2018.01.053.
- Maalawi, Y. 2020. Modeling, Simulation and Optimization of Wind Farms and Hybrid Systems/Economic Analysis of Stand-Alone Hybrid Wind/PV/Diesel Water Pumping System: A Case Study in Egypt. https://doi.org/10.5772/intechopen.89161.
- Meder, K., and P. O. Bubenzer. 2011. Application of Environment Assessment related to GIZ ECO Micro Hydropower Plants in the Sidama Zone / Ethiopia, Heidelberg.
- Motwani, K. H., S. V. Jain, and R. N. Patel. 2013. “Cost analysis of pump as turbine for pico hydropower plants-A case Study.” Procedia Engineering 51: 721–726. https://doi.org/10.1016/j.proeng.2013.01.103.
- Nasir, A. 2019. “Design and Simulation of Photo-voltaic Water Pumping System for Irrigation.” Advanced Applied Science 4: 59. https://doi.org/10.11648/j.aas.20190402.14.
- Nasir, A., E. Dribssa, M. Girma, and T. Demeke. 2022. “A Comparative Study of Impeller Modification Techniques on the Performance of the Pump as a Turbine.” International Journal of Rotating Machinery, 1–16. https://doi.org/10.1155/2022/1944753.
- Population growth (annual %)-Ethiopia. (2020). https://data.worldbank.org/indicator/SP.POP.GROW?locations=ET.
- Qian, Z., F. Wang, Z. Guo, and J. Lu. 2016. “Performance evaluation of an axial-flow pump with adjustable guide vanes in turbine mode.” Renewable Energy 99: 1146–1152. https://doi.org/10.1016/j.renene.2016.08.020.
- Ram Adhikari, D. 2018. The Design of High Efficiency Crossflow Hydro Turbines_ A Review and Extension _ Enhanced Reader.pdf. https://doi.org/10.3390/en11020267.
- Ramos, H. M., A. Borga, and M. Simão. 2009. “New design solutions for low-power energy production in water pipe systems.” Water Sci. Eng 2: 69–84. https://doi.org/10.3882/j.issn.1674-2370.2009.04.007.
- Rossi, M., A. Nigro, G. R. Pisaturo, and M. Renzi. 2019. “Technical and economic analysis of Pumps-as-Turbines (PaTs) used in an Italian Water Distribution Network (WDN) for electrical energy production.” Energy Procedia 158: 117–122. https://doi.org/10.1016/j.egypro.2019.01.055.
- Simão, M., M. Pérez-Sánchez, A. Carravetta, and H. M. Ramos. 2019. “Flow conditions for PATS operating in parallel: Experimental and numerical analyses.” Energies 12: 1–19. https://doi.org/10.3390/en12050901.
- Vijayaramanath, B., R. Kesavan, and C. Elanchezhian. 2009. Process Planning and Cost Estimation. 252. https://doi.org/10.13140/RG.2.2.29351.70568
- Zhao, Z., Z. Guo, Z. Qian, and Q. Cheng. 2020. “Performance improvement of an axial-flow pump with inlet guide vanes in the turbine mode. Proceedings of the Institution of Mechanical Engineers.” Part A: Journal of Power and Energy 234 (3): 323–331. https://doi.org/10.1177/0957650919858842.