
 ?Mathematical formulae have been encoded as MathML and are displayed in this HTML version using MathJax in order to improve their display. Uncheck the box to turn MathJax off. This feature requires Javascript. Click on a formula to zoom.
ABSTRACT
This paper presents a techno-economic analysis of the impact of distributed generation (DG) integration for power loss reduction and reliability of two 33 kV radial outgoing feeders at the Motta distribution substation in Ethiopia. Transient earth faults and permanent short-circuits were identified to be the most common causes of interruptions. The substation's system average interruption frequency index (SAIFI) is 806 and its system average interruption duration index (SAIDI) is 1394.145 for planned outages. This necessitates the pursuit of effective methods to increase the reliability of the distribution system. The results show that the distribution system is more reliable with the SAIFI and customer average interruption frequency index (CAIFI) reduced by 97.8%, SAIDI reduced by 76%, average service availability index (ASAI) increased by 14.38%, and average service unavailability index (ASUI) reduced by 76%, resulting in a total power loss reduction of 0.32 MW. The cost analysis was performed using the Monte Carlo (MC) reliability analysis and the DG net present cost analysis results in a payback period of less than five years indicating that the system is profitable.
1. Introduction
Electric power is produced by generation stations and transmitted over long distances to end-users such as industrial, commercial, and residential customer loads via distribution systems. The final structure that connects the distribution substation and the customers is the distribution system. Power outages experienced by customers are usually caused by the failure of a distribution system component. The majority of failures occur at the distribution system. There are numerous ways to improve distribution network reliability, such as the use of faster fault prediction techniques, fewer equipment failures for contingencies, and the installation of highly reliable protection equipment, such as reclosers, switches, and automation. Power losses and poor reliability of power systems affect end-user satisfaction. Currently, the Motta distribution substation in Ethiopia is experiencing frequent power outages and power interruptions. In Ethiopia, three systems control the transmission and distribution of electricity: generation, transmission, and distribution. The Ethiopian Electric Power Corporation (EEPCO) operates three transmission systems: 400, 230, and 132 kV (primary transmission lines), 66 and 45 kV (secondary transmission lines), and three distribution lines. Distribution transformers then reduce the voltage to 0.380 kV three-phase or 0.220 kV single phase required by the majority of users (Omotoso et al. Citation2022; Taye Citation2018). Power quality in electric distribution systems is becoming increasingly important. Customers expect a higher level of service from more sensitive electrical and electronic equipment. The effectiveness of a power distribution system is measured in terms of efficiency, service continuity or reliability, service quality in terms of voltage profile and stability, and power distribution system performance. The interconnection of a number of small generators directly to a distribution system or within a customer's facility is known as distributed generation (Agajie et al. Citation2021). Various studies on the impact of distributed generation on distribution system reliability have been conducted. Reliability indices are used to gauge a distribution system's dependability (Ayamolowo and Salau Citation2020; Hassan et al. Citation2021). In comparison to generation or transmission systems, distribution system reliability modelling and evaluation have historically received less attention. The system's overall capacity to deliver a sufficient supply of electrical energy is measured by the reliability of the power system. Investments pertaining to the electrical system's dependability are frequently evaluated in terms of their cost–benefit implications. Adequacy and security are the two main categories that they fall under (Guan et al. Citation2020). Distributed generation (DG) affects flicker, harmonics, short-circuit levels, islanding, reliability, and network protection in addition to power losses and low voltage profiles. In order to benefit society, electricity must be produced close to where it will be used. This reduces network losses, greenhouse gas emissions, market competition, and grid reliability (Addisu, Salau, and Takele Citation2021). Distributed generation using renewable energy sources is currently preferred for the production of clean power. Distribution systems are significantly impacted, with benefits like loss reduction, improved utility reliability, voltage support, and power quality (Salau, Nweke, and Ogbuefi Citation2021). Similarly, capacity release, deferment of new or upgraded transmission and distribution infrastructure, quick and easy installation thanks to prefabricated standardised components, lowers costs by not having to use long-distance transmission lines, and provides environmental friendliness where renewable sources are used (Jara Citation2016). The most direct contribution of DG to reliability is experienced at the customer side instead of the utility or system side. DG is associated with two types of technologies: (1) traditional energy technologies, and (2) renewable energy technologies. Base reliability is provided by the utility, and DGs boost reliability by providing local load during interruptions and improves system reliability by supplying loads for island-based operations. Due to the availability and capacity of the DG, especially for renewable resources, it may not be possible for the DG to supply the demand completely during the islanded mode (Al-Muhaini and Heydt Citation2013). The ability to integrate the island into the network is the most important property of DG for load restoration. Islanding starts with the ability to self-start. It means that the generator can be powered without an external power source, and that they are able to control the network during intentional islanding (Hassan et al. Citation2021). The Monte Carlo (MC) method is often used to simulate the reliability performance of power systems. A reliable fault event simulation requires a large amount of statistical data over an extended period of time. The current generation of network information systems allows detailed statistics to be gathered on the behaviour and operation of the distribution system in a variety of situations (Agajie et al. Citation2023a; Salau, Gebru, and Bitew Citation2020). Distributed generators are sources of energy connected to distribution systems. The generators are much smaller than traditional central station generators, ranging from several kilowatts to about 10 megawatts (Murty and Kumar Citation2020). One vital method to evaluate the impacts of DGs on reliability, losses, and voltage profile is DG allocation and size optimisation (Agajie et al. Citation2020; Hassan et al. Citation2022; Nweke, Salau, and Eya Citation2022; Teshome Citation2016). Distributed Generation (DG) has some advantages over centralised power generation. Planning the distribution system at the earliest possible stage is crucial in determining the optimal placement and sizing of DGs (Agajie et al. Citation2019; Agajie et al. Citation2023b; Alyu et al. Citation2023; Ayamolowo et al. Citation2019; Shonkora and Salau Citation2021). Based on the review of literature, the following issues are addressed by existing methods:
The relationship of reliability improvement and the bus voltage when DG is placed.
The coordination of reliability and power loss.
Different methods of reliability analysis and their performance and impact with DG placement, bus voltage, and power loss.
Easily available and cost-effective DG and their power coverage.
This study presents a techno-economic analysis of DG for power system reliability and power loss enhancement utilising analytical and simulation (Monte Carlo) reliability analysis method due to the increasing frequency of daily power outages at Motta substation. The frequent power outages have a detrimental economic and social impact on the utility and the surrounding community.
The main contributions of this paper are in overcoming these challenges and delivering reliable electricity with high reliability, by lowering power losses, and increasing voltage profile. To achieve this:
Two practical feeders were considered and modelled in order to assess the actual performance of the Motta distribution substation.
The energy output from the distributed generation sources were evaluated by using actual local metrological solar irradiation and wind speed data.
Reliability analysis was performed using Monte Carlo Simulation (MCS) method to overcome the reliability problems and their impact on voltage profile and total power loss.
A detailed comparison of the MC reliability method with analytical and enumeration based reliability analysis was carried out.
In the remaining sections of this paper, related work is presented in section 2, the methodology is presented in section 3, the experimental results and discussion are presented in section 4, and the paper is concluded in section 5.
2. Related works
Adefarati et al. (Citation2017) presented a complete reliability study of a distribution system that meets consumer load needs with wind turbine generator, electric storage system, and PV penetration. Dixit, Kundu, and Jariwala (Citation2019) presented a combined strategy for resolving the optimal DG placement and distribution network reliability assessment problem. By integrating the Monte Carlo (MC) approach and model-based technology, Dong et al. (Citation2019) proposed a method for system reliability analysis of big and complex systems with various failure modes. The nominal model is built using the MATLAB/Simulink programming language. Patel and Deshpande (Citation2019) presented a Monte Carlo simulation (MCS) technique using Pspice to evaluate power system dependability with nonchronological demand. The integration of DG from several categories can improve the conventional EDN techno-economic performance, according to Hassan et al. (Citation2021) which presented a three novel multi-objective optimisation approach as a solution. Parol et al. (Citation2022) presented the analysis of calculated results for two typical present network structures and two hypothetical future network structures, using specific data on DG types, locations, and power capacities, as well as distribution system automation. In Firouzi, Samimi, and Salami (Citation2022), a non-sequential Monte Carlo simulation (MCS)-based model and an improved Estimation of Distribution Algorithm (EDA) are combined to evaluate the reliability of composite power systems while taking wind farms’ (WFs’) and photovoltaics’ (PVs’) variability and uncertainty into account. For the four classes of DG technology types, a thorough and comparative analysis was conducted in Salimon et al. (Citation2023) to determine the environmental impact of incorporating renewable and non-renewable DGs into the distribution system.
2.1. Existing data of Motta substation network
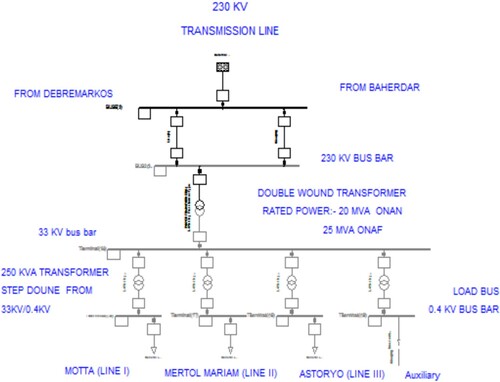
The Motta substation receives power from the main grid, which is connected to Baherdar and Debre Markos substations. In Ethiopia, the Ethiopian Electric Power Corporation (EEPCO) provides electric power to customers. The EEPCO has a transmission line of 230 kV and a distribution system of 33 kV. This voltage value is stepped down to 0.380 kV/0.220 kV in three-phase and single phase, respectively. The Motta feeder has 57 nodes and 40 load buses, while the Meltolemariyam feeder has 94 nodes and 66 load buses. The distribution network has transformers of 6,045 KVA and 2,520 KVA serving 700 and 2,537 customers at the Motta and Meltolemariyam feeders respectively. These feeders have a combined capacity of 8,565 KVA. A radial distribution network is used in the Motta feeder and Meltolemariyam feeder. Aluminium conductors are used in these feeders. shows the annual average power consumption of the feeders from 2017/18 to 2018/19.
Table 1. Power consumption of the feeders on annual basis.
depicts the overall system diagram of the substation. The power factor (Pf) of the substation can be determined using Pf = Cos (tan−1(Q/P)) = Cos (tan−1(8530.62378/17653.0206)) which is 0.9. The single line diagram of the Motta distribution network is shown in .
Figure 1. Single line diagram of the Motta distribution network.
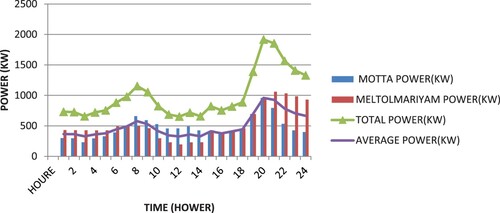
In , the hourly load of the feeder Meltolmariyam is 196.02 kW and the maximum load is 1059.52 kW, while it is 230.3 and 958.74 kW for the feeder at Motta. The maximum load is observed at the Motta feeder between 2:00 PM and 3:00 PM and at the Meltolmariyam feeder between 3:00 PM and 4:00 PM. shows that the overall maximum load during day time is 1.8MW between 2:00 PM and 3:00 PM.
Figure 2. Hourly load of each feeder at Motta substation.
Power system faults at Motta substation include permanent and transient earth faults, permanent and transient short-circuits, and interruptions due to operation/maintenance. Faults, such as transient earth faults (TEF) and permanent earth faults (PEF), are sorted by duration and frequency as presented in .
Table 2. Total number of interruptions and duration hours of feeders at the substation.
3. Methodology
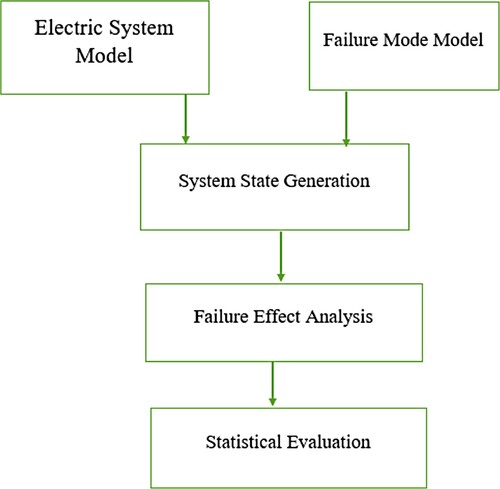
In reliability engineering, outage data is gathered and system designs are evaluated. The Motta distribution feeder outage data obtained included information on each failure event that occurred during the specified time period. There are two kinds of outages: forced and planned. In this study, reliability is assessed using a stochastic model. A MCS method is used to generate an operating history for various components of a power system based on the measured parameters for each component. The most important parameters are Mean Time to Failure (MTTF) and Mean Time to Repair (MTTR). In order to create an overall system operation profile from which reliability indices can be calculated, the operating profiles of the system's constituent parts including the customer load profile are superimposed. To measure the effect of hybrid distributed generation units on an existing system, reliability indices obtained before and after the implementation of hybrid distributed generation units can be compared. The analysis is split into two phases as a result. In the first phase, only the electricity produced by the generation station under utility control is used to evaluate the system's suitability. Hybrid distributed generation (DG) units located at a variety of customer sites were included in the analysis in the second phase. HOMER Energy software is used to perform the feasibility analysis of DG resources. In addition to testing the system before and after integration with the DG, the DIgSILENT Power Factory software is utilised to develop the reliability model using the MCS technique and the analytical method. shows the reliability analysis procedure using DIgSILENT power factory.
Figure 3. Reliability analysis procedure using DIgSILENT power factory.
3.1. Base case reliability analysis
Power system reliability indices are used to assess the dependability of both individual components and the entire system. Reliability indices typically consider factors such as: number of customers, load connected, duration of the interruption in seconds, minutes, hours, or days; The amount of power interrupted (kVA); and Interruption’s frequency.
| A. | Customer-oriented indices | ||||
The indices discussed in this section are directly related to the customers. These indices are defined by the IEEE Standard 1366.
| 1. | System Average Interruption Frequency Index (SAIFI):
| ||||
| 2. | Customer Average Interruption Frequency Index (CAIFI):
| ||||
| 3. | System Average Interruption Duration Index (SAIDI):
| ||||
| 4. | Customer Average Interruption Duration Index (CAIDI)
| ||||
| 5. | Average Service Availability Index (ASAI):
| ||||
| 6. | Average Service Unavailability Index (ASUI): This index is a supplement to the average service availability index (ASAI). It is given by Eq. (6).
| ||||
| B. | Load or energy-oriented indices | ||||
| 1. | Energy Not Supplied Index (ENS):
LP stands for peak load demand, Lf stands for load factor, and Ed stands for total energy demanded during the time period of interest, t. | ||||
| 2. | Average Energy Not Supplied Index (AENS):
| ||||
| 3. | Average Customer Curtailment Index (ACCI):
| ||||
| 4. | Expected Interruption Cost (EIC) Index: EIC is the cost of the not supplied energy at that load point ($/yr). | ||||
After connecting the DGs, Customer-Oriented and Load-Oriented reliability indices were compared. Eqs. (1) to (10) are used to calculate the reliability index of the existing substation. On the basis of the data presented in , the reliability indices for one full year from April 2017/18 to April 2018/19 (20/2010 E.C) was calculated. Therefore, shows the analytical Motta distribution substation reliability indices from April 2017/18 (20/2009E.C) to April 2018/19 (20/2010 E.C) by using 0.53 birr/kWh which is $0.02/kWh average EEPCO electric tariff on a radial system without mesh connections, the failure rate (λ/year), outage durations (hr) and average outage durations (hr/year). presents the comparison of the different reliability analysis methods, which are analytical enumeration and MC at the base case. The results show that the MC method outperforms the other methods.
Table 3. Base case system indices.
Table 4. Base case, Monte Carlo, and enumeration of reliability index.
3.2. Siting and sizing of distributed generation
As shown in Eq. (11), the objective is to maximise the generation capacity, while minimising customer outage costs, which can be expressed using Eq. (12). Therefore, the existing network assets are optimally utilised to assist in siting and sizing the DG in a cost-effective manner. The generation capacity should be distributed across the buses so that the technical constraints are not exceeded and the capacity is maximised. Eq. (11) presents the proposed objective function to be minimised.
(11)
(11) where P is the DG capacity at the i bus and N is the number of buses.
(12)
(12) where: La(i) = average load connected to load point i
Ch(i) = outage cost ($/kWh) of customer due to contingency h,
λh = failure rate of contingency h,
rh = failure time of contingency,
nh = number of contingencies,
ni = total number of load point i.
Under the following constraints, the objective function J (MW), given in Eq. (11) is maximised, while the objective function EIC ($/kWh), given in Eq. (12), is minimised.
Power flow constraint:
(13)
The voltage of each bus k must be within standards limits
Current transfer capability of feeder lines:
3.2.1 Placement of DG based on load flow bus voltage
The voltage sensitive buses are first identified by measuring the per unit value of each bus voltage from the nodal and load sides and comparing the obtained value to the expected standard value of minimum of 0.90pu and maximum of 1.005pu.
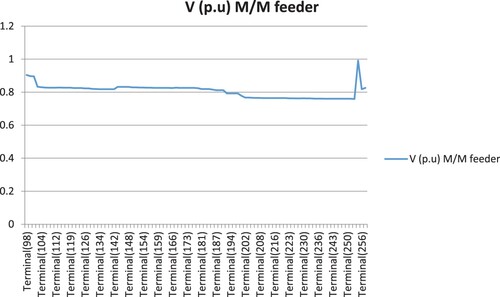
The base load flow feeders are 0.88pu at bus number 88 of the Motta feeder and 0.76pu at bus numbers 253 and 202 of the Meltolemariyam feeder, as shown in and . The voltage value of Motta feeder is close to the standard of load flow bus voltage, which has a minimum value of 0.90pu and maximum value of 1.005pu, as compared to Meltolemariyam feeder, which has a minimum value of 0.88pu and maximum value of 0.99pu and minimum value of 0.76pu to maximum value of 0.904pu, respectively. As shown in , the Meltolemariyam feeder voltage profile is completely below the standard, and the bus with the low voltage value in both feeders is discovered to be far from the station, which is closed to more interruptions. The maximum reliability problem that occurs far from the station is indicated by a temporary earth fault (TEF) and a permanent short-circuit (PSC) fault.
Figure 4. Comparison of bus voltage at Motta distribution feeder.
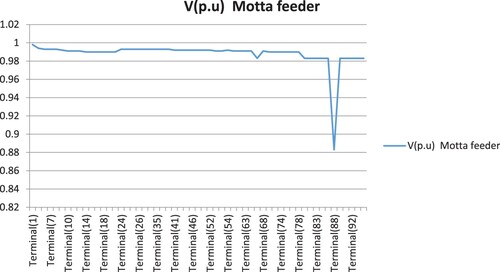
Figure 5. Comparison of bus voltage at Meltolemariyam (M/M) distribution feeder.
3.2.2 DG sizing
In order to determine the optimal size of DG, the following steps were taken:
First, the DG is placed at the bus with the lowest voltage
Keeping the Pf of the DG constant (0.9, the same as the power factor of the distribution system), the size of the DG is changed until the smallest system losses and reliability index value are reached.
The ideal DG size is determined to be the one with the lowest losses and the highest reliability index.
3.2.2.1 Change of power loss and reliability index as DG size is varied
The total active and reactive power loss and reliability index of the Motta distribution substation feeders decrease as the value of DG is increased in constant steps from its minimum value to a value equal to the feeder's loading capacity. shows that the minimum system losses occur at a DG value of 2.1 MW active power and a constant Pf of 0.9, which is the power factor of the substation. When the DG value exceeds 2.1 MW, the system's loss and reliability index rises because the DG's penetration limit affects power loss, which directly translates to energy not supplied.
Table 5. Power loss and reliability index variation as DGs increase.
3.3 Types of accessible DG technology around feeders
For distributed generation, there are numerous technologies or resources available. The choice of a particular DG technology for a given area is influenced by a variety of elements, such as resource accessibility, environmental suitability, and cost. Diverse geographic regions have a range of renewable and non-renewable resources. Wind and solar energy resources can differ from one location to another depending on the local wind speed. The positive and negative effects that DG technologies have on the environment vary as well. Different DG technologies have different effects on the environment, which could be beneficial and detrimental to the enviroment. The amount of CO, CO2, and other greenhouse gases in the environment has a significant impact. We display the cost and emission levels of the various DG technologies in . Based on the aforementioned considerations, the DG technology chosen in this paper is a wind/PV hybrid renewable energy system.
Table 6. Emission levels of different DGs.
4. Results and discussion
The single line diagram of the distribution substation network shown in has 49 nodes and 106 transformer buses. The network is formed by two radial feeders, namely: Motta and Meltolemariyam. Motta feeder has 21 nodes and 40 transformer buses and Meltolemariyam has 28 nodes and 66 transformer buses. The 33 kV Motta distribution substation is owned by Ethiopian Electric Utility (EEU). Reliability bus bar test system (RBTS) is the distribution system reliability bar testing system which was modified so that it has two outgoing feeders with a voltage of 33 and 0.4 kV. This distribution system has 155 buses and nodes. 230 kV circuit breakers are assumed to operate properly when required, disconnects are opened whenever possible to isolate a fault, and power is restored to as many load points as possible with the help of appropriate isolators when alternative power sources are available. In the proposed system, DG units are connected to the 33 kV bus of the incoming feeders and after the 0.4 kV low voltage transformer (33/0.4 kV). There is no restriction on load transfer in this study, so DG units have the same function as power sources.
4.1. Comparison of the distribution systems reliability without DG and with DG
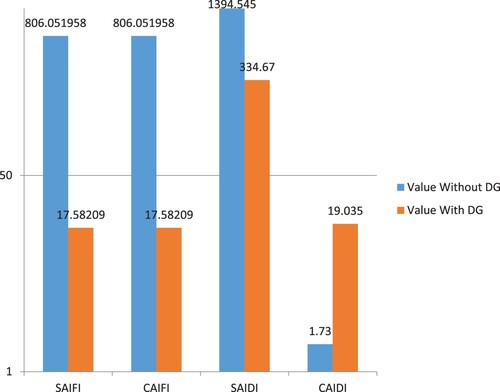
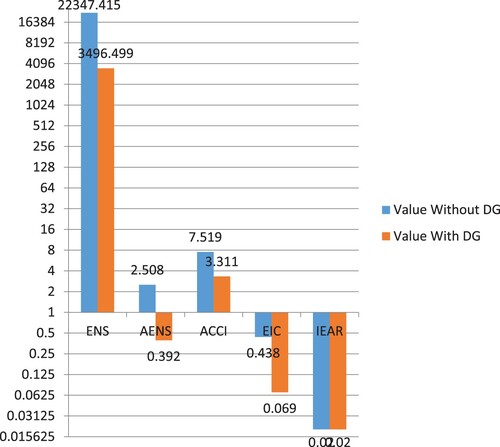
According to the Ethiopian Electricity Agency (EEA), there is a reliability gap in the distribution system, with SAIFI = 20 and SAIDI = 25. As shown in , the reliability with DG using MC method for SAIFI and CAIFI is improved to 97%, while the interruption frequency is reduced due to the use of DG, and the value of SAIDI is improved to 76%, while the interruption duration is reduced due to the use of DG, and the value of CAIDI is increased from 1.73–19.035 (a 1000% increase due to the reduction of SAIDI). Because of the frequency interruptions and shorter duration, the value of ASAI increases from 84% to 96% and the value of ASUI decreases from 15% to 3%, causing the value of ENS to decrease from 22,347.415 MWh to 3,496.499MWh per year. As a result of the reduction in power loss and ENS, the AENS is reduced from 2.508 to 0.392 MWh/yr and the EIC is reduced from 0.438 to 0.069 M/yr at a constant IEAR of 0.020.
4.2. Comparison of customer-oriented reliability indices
DGs were installed at the bus of the minimum bus voltage of the Motta feeder in the 33 kV radial distribution system (RDS) using the proposed method. depicts the customer-oriented reliability index without and with DG. The figure shows the comparison of the customer-oriented reliability indices of the RDS, when DGs are installed at the bus which has a low voltage value with a size of 2.1 MW of active power at Motta and Meltolemariyam feeders. Moreover, the distribution substation has a constant Pf of 0.9 and improved customer-oriented reliability indices, as a result of reduction of SAIFI and CAIFI from 806.05 to 17.58, and SAIDI from 1394.545 to 34.
Figure 6. Customer-oriented reliability indices with and without DG integration.
4.3. Comparison of load or energy-oriented reliability indices
DGs were installed at the bus of the minimum bus voltage of the Motta feeder in the 33 kV RDS using the proposed method. depicts the energy-oriented reliability index without and with DG. The energy-oriented reliability index of the RDS of the Motta and Meltolemariyam feeders was compared to the DG at the bus, which has an active power of 2.1 MW and a constant Pf of 0.9 (see ). The energy-oriented reliability indexes were improved by reducing ENS from 22347.315 to 34964.999, AENS from 2.508 to 0.392, ACCI from 7.593 to 3.311, and EIC from 0.438 to 0.069 at constant IEAR of $0.2. As can be seen in and , the distribution substation reliability indexes that are customer- and energy-oriented have generally improved. This indicates that the size of the DG and its location at the bus with low voltage value leads to power losses and has a direct bearing on the reliability of the distribution system.
Figure 7. Energy-oriented reliability index with and without DG integration.
4.4. Cost analysis
To analyse the cost, the paper considers two types of costs: one is due to reliability because the EIC above is only due to interruption frequency and duration hour, and the second is due to power loss using average cost of energy of EEPCO that considers reliability 0.35birr/kWh, which is $0.0196 ≅ $0.020 using current exchange rate of CBE. Before introducing DG, the utility loses $5,363,379.6, or $0.438 million per year, due to only power interruption frequency, but there is a power loss of 1.93MW, or 16,906.8 MWh energy as shown in .
The energy assessment rate = $0.020/kWh, then the utility losses $338,136 due to power loss.
(17)
(17) The total cost of energy that the utility loses is
Ethiopian Birr.
The cost of energy after introducing DG due to only power interruption is $839,159.76 as shown in . 0.32MW which is 2,803.2MWh of energy and when energy assessment rate = $0.020 m/kWh is used, the utility loses $56,046. Using Eq. (17), we obtain the total utility losses as
The total cost of energy that the utility loses is Ethiopian Birr.
(18)
(18)
(19)
(19)
(20)
(20)
The results show that the utility is profitable based on the integration of the three DGs for 25 years and the cost is reduced by 4 years. Therefore, the utility is able to save a large amount of money during the remaining 21 years and at the same time provide reliable power supply to the customer.
5. Conclusion
This paper presents an analysis and assessment of the reliability of Motta distribution substation for the sole aim of reliability improvement, power loss minimisation, and proper DG location and sizing. The reliability assessment and load flow analysis processes were carried out on a 33 kV two feeder radial distribution system at Motta and Meltolemariyam feeders using analytical enumeration and Monte Carlo Simulations (MCS). Reliability assessment of distribution substation system was performed with DG units, by applying analytical approach and MCS method using the DIgSILENT and HOMER software tools for DG cost optimisation. In the base case study, it was observed that there is a higher outage as the load point is at a distance away from the supply point. As a result, there is a great challenge in terms of system reliability and power loss; the consumer does not use energy, so the utility is estimated to lose around $22,347.415 of Expected Energy Not Served (EENS), and $5,363,379.6 and $338,136 due to power losses and high overall system unavailability indices, respectively. The utility has a total loss of around $5,701,515.6 or 153,940,921.2 Ethiopian birr annually. The proposed solution was chosen in this study as an option for improving system reliability indices, expected energy not supplied, and outage cost of interruptions. The installation of the DG at feeder bus numbers 88, 202, and 253 at Meltolemariyam with the lowest VSI, has a positive impact on the entire distribution substation, reducing the SAIFI and CAIFI by 97.8%, SAIDI by 76%, increasing the ASAI by 14.38%, and reducing the ASUI by 76%, resulting in a total power loss reduction of 0.32 MW. Because of the improved reliability and power loss, the utility's annual loss decreased from $5,701,515.6 to $839,215.842, or from 153,940,921.2 to 22,658,827.734 Ethiopian birr. The utility incurs expenses every year because of these losses, thus the cost of DG integration to produce 2.1 MW of hybrid wind and solar electricity for the system over a 25-year period was decreased. Additionally, the cost incurred is far less than the amount the utility loses annually as a result of the power losses. The utility is profitable with a consistent supply of electricity to customers over the next 21 years thanks to its four-year payback period.
Disclosure statement
No potential conflict of interest was reported by the author(s).
Data availability statement
The datasets generated during and/or analysed during the current study are not publicly available but are available from the corresponding author on reasonable request.
References
- Addisu, M., A. O. Salau, and H. Takele. 2021. “Fuzzy Logic Based Optimal Placement of Voltage Regulators and Capacitors for Distribution Systems Efficiency Improvement.” Heliyon 7 (8): e07848. https://doi.org/10.1016/j.heliyon.2021.e07848.
- Adefarati, T., and R. C. Bansal. 2017. “Reliability Assessment of Distribution System with the Integration of Renewable Distributed Generation.” Applied Energy 185: 158–171. https://doi.org/10.1016/j.apenergy.2016.10.087.
- Agajie, T. F., A. Ali, A. Fopah-Lele, I. Amoussou, B. Khan, C. L. R. Velasco, and E. A. Tanyi. 2023a. “Comprehensive Review on Techno-Economic Analysis and Optimal Sizing of Hybrid Renewable Energy Sources with Energy Storage Systems.” Energies 16: 642. https://doi.org/10.3390/en16020642.
- Agajie, T. F., F. M. Gebru, A. O. Salau, and D. B. Aeggegn. 2023b. “Investigation of Distributed Generation Penetration Limits in Distribution Networks Using Multi-Objective Particle Swarm Optimization Technique.” Journal of Electrical Engineering & Technology, https://doi.org/10.1007/s42835-023-01457-4.
- Agajie, T. F., B. Khan, J. M. Guerrero, and M. O. Prakash. 2021. “Reliability Enhancement and Voltage Profile Improvement of Distribution Network Using Optimal Capacity Allocation and Placement of Distributed Energy Resources.” Computers & Electrical Engineering 93: 107295. https://doi.org/10.1016/j.compeleceng.2021.107295.
- Agajie, T. F., A. O. Salau, E. A. Hailu, and Y. A. Awoke. 2020. “Power Loss Mitigation and Voltage Profile Improvement with Distributed Generation Using Grid-Based Multi-Objective Harmony Search Algorithm.” Journal of Electrical and Electronics Engineering 13 (2): 5–10. https://www.proquest.com/openview/572380eedd4ca44dba79b85db4541164/1.pdf?pq-origsite=gscholar&cbl=54417.
- Agajie, T. F., A. O. Salau, E. A. Hailu, M. Sood, and S. Jain. 2019. “Optimal Sizing and Siting of Distributed Generators for Minimization of Power Losses and Voltage Deviation.” In 5th IEEE International Conference on Signal Processing, Computing and Control (ISPCC), 292–297. https://doi.org/10.1109/ispcc48220.2019.8988401.
- Al-Muhaini, M., and G. T. Heydt. 2013. “Evaluating Future Power Distribution System Reliability Including Distributed Generation.” IEEE Transactions on Power Delivery 28 (4): 2264–2272. https://doi.org/10.1109/TPWRD.2013.2253808.
- Alyu, A. B., A. O. Salau, B. Khan, and J. N. Eneh. 2023. “Hybrid GWO-PSO Based Optimal Placement and Sizing of Multiple PV-DG Units for Power Loss Reduction and Voltage Profile Improvement.” Scientific Reports 13: 6903. https://doi.org/10.1038/s41598-023-34057-3.
- Ayamolowo, O. J., and A. O. Salau. 2020. “Reliability Analysis of Mofor Injection Substation.” In Handbook of Research on Engineering Innovations and Technology Management in Organizations, IGI 91-105. https://doi.org/10.4018/978-1-7998-2772-6.ch005.
- Ayamolowo, O. J., A. O. Salau, C. A. Mmonyi, A. O. Ajibade, A. J. Akinwumi, and O. A. Onifade. 2019. “Energy Audit and Reliability Analysis of Power Distribution System: A Case Study of Afe Babalola University.” 2019 IEEE AFRICON, https://doi.org/10.1109/africon46755.2019.9133960.
- Dixit, M., P. Kundu, and H. R. Jariwala. 2019. “Integration of Distributed Generation for Assessment of Distribution System Reliability Considering Power Loss, Voltage Stability and Voltage Deviation.” Energy Systems 10: 489–515. https://doi.org/10.1007/s12667-017-0248-6.
- Dong, L., Z. Lu, M. Li, and J. Zhou. 2019. “Model-based System Reliability Analysis by Using Monte Carlo Methods.” 2019 Prognostics and System Health Management Conference (PHM-Qingdao), Qingdao, People’s Republic of China, 1–6. https://doi.org/10.1109/PHM-Qingdao46334.2019.8942874.
- Firouzi, M., A. Samimi, and A. Salami. 2022. “Reliability Evaluation of a Composite Power System in the Presence of Renewable Generations.” Reliability Engineering & System Safety 222: 108396. https://doi.org/10.1016/j.ress.2022.108396.
- Guan, H., Y. Ren, Q. Zhao, and H. Parvaneh. 2020. “Techno-economic Analysis of Renewable-Based Stand-Alone Hybrid Energy Systems Considering Load Growth and Photovoltaic Depreciation Rates.” Distributed Generation & Alternative Energy Journal 35 (3): 209–236. https://doi.org/10.13052/dgaej2156-3306.3533.
- Hassan, A. S., E. A. Othman, F. M. Bendary, et al. 2022. “Improving the Techno-Economic Pattern for Distributed Generation-Based Distribution Networks via Nature-Inspired Optimization Algorithms.” Technol Econ Smart Grids Sustain Energy 7 (3), https://doi.org/10.1007/s40866-022-00128-z.
- Hassan, A. S., E. A. Othman, F. M. Bendary, and M. A. Ebrahim. 2021. “Distribution Systems Techno-Economic Performance Optimization Through Renewable Energy Resources Integration.” Array 9 (1), https://doi.org/10.1016/j.array.2020.100050.
- Jara, A. 2016. “Reliability Assessment of Radial Distribution System with Distributed Generation: A Case Study of Cottebe Substations.” PhD diss., Addis Ababa University, 1–129, 2016. http://etd.aau.edu.et/bitstream/handle/123456789/6672/Amache%20Jara.pdf.
- Murty, V. V. S. N., and A. Kumar. 2020. “Optimal Energy Management and Techno-Economic Analysis in Microgrid with Hybrid Renewable Energy Sources.” Journal of Modern Power Systems and Clean Energy 8 (5): 929–940. https://doi.org/10.35833/MPCE.2020.000273.
- Nweke, J. N., A. O. Salau, and C. U. Eya. 2022. “Proposition of a Method to Design Tailor-Made Knowledge Management Systems for Small and Medium Enterprises.” Engineering Review 42 (1): 1–19. https://doi.org/10.30765/er.1379.
- Omotoso, H. O., A. M. Al-Shaalan, H. M. H. Farh, and A. A. Al-Shamma’a. 2022. “Techno-Economic Evaluation of Hybrid Energy Systems Using Artificial Ecosystem-Based Optimization with Demand Side Management.” Electronics 11: 204. https://doi.org/10.3390/electronics11020204.
- Parol, M., J. Wasilewski, T. Wojtowicz, B. Arendarski, and P. Komarnicki. 2022. “Reliability Analysis of MV Electric Distribution Networks Including Distributed Generation and ICT Infrastructure.” Energies 15: 5311. https://doi.org/10.3390/en15145311.
- Patel, H., and A. Deshpande. 2019. “Reliability Evaluation of Power System Using Monte Carlo Simulation in Pspice.” International Journal of Applied Engineering Research 14 (9): 2252–2259. https://www.ripublication.com/ijaer19/ijaerv14n9_30.pdf.
- Salau, A. O., Y. Gebru, and D. A. Bitew. 2020. “Optimal Network Reconfiguration for Power Loss Minimization and Voltage Profile Enhancement in Distribution Systems.” Heliyon 6 (6): 1–8. https://doi.org/10.1016/j.heliyon.2020.e04233.
- Salau, A. O., J. Nweke, and U. Ogbuefi. 2021. “Effective Implementation of Mitigation Measures Against Voltage Collapse in Distribution Power Systems.” Przeglad Elektrotechniczny, 65–68. https://doi.org/10.15199/48.2021.10.13.
- Salimon, S. A., G. A. Adepoju, I. G. Adebayo, and O. B. Adewuyi. 2023. “Comparative assessment of techno-economic and environmental benefits in optimal allocation of distributed generators in distribution networks.” Scientific African 19), https://doi.org/10.1016/j.sciaf.2023.e01546.
- Shonkora, S. S., and A. O. Salau. 2021. “Analysis and Improvement of Reliability in a Radial Power Distribution System Using Smart Reclosers.” Journal of Electrical and Electronics Engineering 14 (1): 68–73. https://www.proquest.com/openview/4ab3210191e3b38435d341ffb4f7ab51/1?pq-origsite=gscholar&cbl=54417.
- Taye, A. 2018. “Reliability Assessment of Debre Tabor Town Electrical Power Distribution System.” International Journal of Advanced Research in Electrical, Electronics and Instrumentation Engineering 7 (12): 4242–4249. doi:10.15662/IJAREEIE.2018.0712017. http://www.ijareeie.com/upload/2018/december/17_RELAIABILITY%20ASSESMENT.pdf.
- Teshome, D. A. 2016. “Study of Distributed Generation in Improving Power System Reliability (Case Study: Addis Center Substation).” PhD diss., Addis Ababa University, 1–112, 2016. http://213.55.95.56/bitstream/handle/123456789/6576/Abeba%20Debru.pdf?sequence=1.