
ABSTRACT
Energy simulation models are crucial to estimate the energy demand of buildings, especially for prospective planning on a district or city scale. As required input data is not available in many cases, an automated model generation workflow is needed. Existing workflows have several disadvantages, including: (i) dependence on large input datasets of existing buildings; (ii) no 3D representation to support the planning process; (iii) they are proprietary solutions. The pipeline ‘SHP2SIM’ is an open-source python pipeline enabling enrichment and generation of building energy simulation models based on little input data for district and urban scale. The pipeline is tested by simulating the heat load for a district with 27 buildings and validated for one building: R squared is 0.9825, CV(RMSE) is 22.10%, and NMBE is 4.06% on a monthly basis. To enable reproducibility and encourage open science, input data, output models, and the pipeline are openly available (https://github.com/tug-cps/shp2sim).
1. Introduction
Buildings are responsible for approx. 40% of total final energy demand and approx. 36% of energy-related greenhouse gas emissions in the European Union (European Commission Citation2021). In order to reduce energy demand or improve energy efficiency, the energy demand of buildings has to be known (Abu Bakar et al. Citation2015; Cubí, Ortiz, and Salom Citation2014). Building energy models are used to simulate energy demand based on physical, data-driven, or hybrid models (Chen et al. Citation2022). Building energy simulations on urban and district scale have become increasingly relevant for various applications such as energy management and control or the design of smart energy systems (Ahmad et al. Citation2018; Bokolo et al. Citation2020). Especially for the design of new districts or for modifications in existing districts, building energy models are needed to estimate the energy demand of buildings (Malhotra et al. Citation2022a).
Building energy models are differentiated between top-down models, which handle a group of buildings as a single entity, and bottom-up models, where every building is considered individually (Li et al. Citation2017). Further, approaches are categorised into white box (physics-based models), black box (data-driven models), and grey box (hybrid models) (Chen et al. Citation2022; Schweiger et al. Citation2020). Common software tools for creating white-box building energy models are CitySim, TRNSYS, EnergyPlus, ESP-r, IDA-ICE, and several Modelica libraries (Allegrini et al. Citation2015). Input data for these models are usually based on GIS (Geographical Information Systems), CityGML, or GeoJson format (Hong et al. Citation2020).
In order to create building energy models, datasets are needed. Among others, the following building characteristics data are required for city-/district scale: building geometry (footprint, total floor area, number of stories), year built, location and climate, use type and occupancy, energy systems, building envelope and actual energy consumption (Hong et al. Citation2020; Malhotra et al. Citation2022b). On a district or city scale, these data are required for a large number of buildings. Studies have shown that in many cases these required input data are available only to a limited extent, or in some cases (e.g. designing a new district) some information might not be known (Hong et al. Citation2020). Therefore, we need enrichment methods. A recent study shows that almost 70% of studies rely on enrichment methods (Malhotra et al. Citation2022a); different methods for enrichment are discussed in Schweiger et al. (Citation2021). For district-/city scale, data enrichment and model generation need to be automated to process a large number of buildings.
There are already studies with automated workflows for generating building energy models on a district or urban scale. Nageler et al. (Citation2017) present a methodology for fully automated modelling of building energy simulations based on GIS, PostgreSQL, and dynamic simulation of models in IDA ICE. Suesser and Dogan (Citation2017) use a workflow for producing multi-zone energy models based on GIS datasets and EnergyPlus simulations. Giannakis et al. (Citation2019) propose a workflow for automated generation of input data for Building Energy Performance simulation in EnergyPlus. Attanasio et al. (Citation2019) estimate the building heating energy demand in an automated way with a data-driven approach. Several other studies use the open tool TEASER (Remmen et al. Citation2018), which offers data enrichment and export of Modelica simulation models based on predefined input parameters or CityGML models: Fuchs et al. (Citation2016) use GIS data combined with a PostgreSQL database to automatically parametrise building models and simulate the heat demand in Modelica language with TEASER. Schiefelbein et al. (Citation2019) present a method to automatically extract basic data from OpenStreetMap (GIS data), enrich it based on statistics, and generate Modelica building models based on archetype information from TEASER. Gorzalka et al. (Citation2021) developed an approach for automatic generation of dynamic energy simulation models in Modelica for a single existing building using an aerial image and TEASER.
Existing automated frameworks need input datasets with many parameters and rely on import of existing building structures which is a challenge for planning new districts or modifying them. Most workflows do not offer 3D models of districts to give a graphical representation for planning and tools like TEASER already require 3D input files like CityGML models. Mostly, different platforms and tools are combined and no consistent workflow executable in one programming language is available. More importantly, most workflows are not available as open source. Malhotra et al. (Citation2022a) show in their review that only 20% of 72 reviewed studies make input models available for other research. Especially in the case of automated frameworks, usually neither input data nor the models or the automated framework itself are freely available. Hong et al. (Citation2020) conclude in their review on current challenges for building energy modelling that a seamless workflow with open data and computing platform is needed, which should include a 3D visualisation for supporting stakeholder decision-making.
1.1. Main contribution
The main contribution of this study is to provide an open-source python pipeline that creates 3D CityGML models based on little input data and generates Modelica models by data enrichment to estimate the heating demand of buildings on a district or urban scale. GIS data is used to create CityGML models, which provide a 3D representation of the district. Few input parameters are needed and input data can be adapted manually, which is an advantage for planning new districts. The CityGML model is enriched and a Modelica model for building energy simulation is generated by TEASER. All steps of the workflow are integrated into an automated python pipeline. CityGML models and Modelica simulation models are generated for every building (bottom-up approach), giving the possibility to alter single buildings within a district. Developments are openly available, including the pipeline itself, input data, and output models for the use case demonstrating the pipeline for district scale (https://github.com/tug-cps/shp2sim).
1.2. Outline
The paper is structured as follows: In section 2, the methodology and the implementation of the pipeline are presented. Requirements for input data and format are determined. Section 3 presents a use case for the pipeline to demonstrate its functionality on a district scale. Input data generation for the use case buildings is explained. CityGML model and Modelica model generation is performed, Modelica models are simulated, and results for heat load are presented. For a selected building, for which measured data was available, model simulations are validated with measurements in section 4. The performance of the pipeline, limitations, and need for further development are indicated before the paper is concluded in section 5.
2. Methodology
The pipeline ‘SHP2SIM’ is an automated python pipeline for creating building energy simulation models on district or city scale. Based on input in the form of GIS data, the pipeline creates a CityGML (Gröger and Plümer Citation2012) model, enriches it with energy data (energyADE) (Agugiaro et al. Citation2018) and derives a Modelica simulation model based on the enrichment framework TEASER (Remmen et al. Citation2018). The pipeline provides an automated way of generating and simulating Modelica models by integrating own developments (FME workbench) and adaptations of existing tools (TEASER, BuildingsPy) into a Python pipeline. Pipeline developments are openly available and free for use and further development on GitHub (https://github.com/tug-cps/shp2sim); the source code is distributed using the MIT license.
Input for the pipeline is a GIS data set of building footprints in shp format, including attributes for each building. Shapefiles are used to store the geometric location and attribute information of geographic features (Esri Citation2021). The shape file needs to include the geographic location and building footprint. If a building consists of building parts with different height, building parts need to be represented as separate footprints. Each footprint needs to be a closed polygon without gaps. Overlapping of footprints is not allowed but building parts of the same building do not necessarily have to be adjacent as each building part will be treated as a separate building in the simulation. For each building, additional information in the form of attribute information in the shp file is required: Obligatory attributes are a unique ID, building heights in metres, number of storys above ground, the year of construction, and a unique address or name of the building. If a building consists of building parts, unique IDs and unique address or name for each building part are needed. Input data in shp format including attributes in this specific structure can be used as input for the pipeline to generate a building energy simulation model. The workflow of the pipeline is depicted in .
Figure 1. Overview pipeline SHP2SIM.
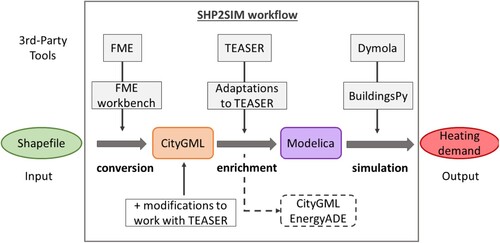
The basic workflow of the pipeline is the following: Taking the shp-file as input, the 2D data is transformed into 3D data in the format of CityGML, which is then modified to be a suitable input for the tool TEASER. After the enrichment with energy data by TEASER, a Modelica simulation model is created, which can be simulated in Dymola (Dassault Systèmes® Citation2023) (e.g. using BuildingsPy interface (Wetter and USDOE Citation2019)) to derive the heat load of each building included in the input file.
First, conversion of 2D shp input data into a 3D CityGML file is done by using the tool FME (Safe Software Citation2022). FME is a platform for data integration supporting different formats and transformation tools and is especially useful for spatial data (Safe Software Citation2022): Within an FME workbench, data is given as input and processed with so-called transformers. By using a combination of customly compiled transformers, data sets are edited and can be saved as output in the required format. An FME workbench enables transforming data in a repeatable workflow. A custom FME workbench was specifically created for the purpose of this pipeline transforming spatial data from shp to CityGML format. CityGML is a format for 3D city models defining geometry, topology, semantics, and appearance of an object (Gröger and Plümer Citation2012). The FME workbench is integrated into the pipeline by using the FME Python Interpreter.
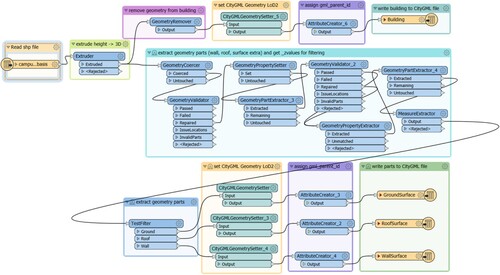
The FME workbench (see ) works as follows: It takes a shp-file like described above as input; both input and output path are defined as published parameters which is necessary to hand over input parameters from a Python file. Within the FME workbench, an Extruder combines footprints and building heights taken from the shp-file and creates 3D buildings. On the one hand, geometry parts like wall, roof, and ground surface are extracted, filtered and transformed into CityGML format. Each geometry part is assigned a building part ID in order to be able to assign it to the same building. On the other hand, the building frame is constructed by removing the geometry, transforming it into CityGML format, and assigning all geometry parts to the building by using the building part ID. Additionally, the user attributes for address/name, building height, storys above ground, and year of construction are added as attributes. The default value for the year of construction in case of missing data is the year 2000. The output of the FME workbench is a CityGML file of all buildings given as input, each including wall, roof and ground surface geometry and user attributes.
Figure 2. FME workbench.
The resulting CityGML file is modified by changing and adding some information in order to provide an adequate file input for TEASER. The following adaptations are performed for each building or building part: The ‘gml:id’ of each building or building part is deleted because TEASER does not recognise it. The CityGML attribute ‘CityGML function’ is inserted for each building or building part, which is a requirement for TEASER in order to be able to enrich the CityGML buildings with archetype data. Possible options for ‘CityGML function’ are ‘office’ (with the code 1120), ‘residential’ (with the code 1000), and ‘institute’ (with the string ‘institute’).
Second, the tool TEASER (Remmen et al. Citation2018) is used for data enrichment of the CityGML model with energyADE data and to derive a Modelica simulation model. Modelica is an open equation-based object-oriented modelling language (Schweiger et al. Citation2018). TEASER is an open framework for urban energy modelling which includes data enrichment, model parametrisation, and model generation (Remmen et al. Citation2018): TEASER takes a CityGML model as input and provides individual, dynamic building models for different scales, from single buildings to district or urban scales. For data enrichment, basic information of the main usage (function), the year of construction, and the rough cubage of the building is necessary. Unknown building parameters are estimated based on archetypes and multiple combined data sources. For model parametrisation and generation, TEASER calculates the necessary parameters for a full parametrised dynamic reduced order simulation model (Modelica model), which is generated as output. Additionally, the export of a CityGML model including energyADE data is possible. For further information on TEASER see Remmen et al. (Citation2018).
For this pipeline, TEASER is integrated in the form of a Python module, as provided by the developers of TEASER (Remmen et al. Citation2018). Version 0.6.6 of TEASER is used in this pipeline as in later versions the conversion of CityGML models is not supported anymore. TEASER takes the CityGML file and a weather file as input, calculates the missing parameters and generates the Modelica models as output. For creating Modelica simulation models, TEASER requires a weather file in ‘.mos’-format. These files contain weather data in the form of a ‘Typical Meteorological Year’ (TMY), which is constructed based on actual meteorological data and each month represents a typical month from an average over several years (Pedersen Citation2007). For TEASER, the main usage (function) of a building needs to be provided, which determines the data enrichment depending on archetypes. At this point, a modification was made in TEASER as it was not possible to enrich CityGML files with the function ‘institute’ previously. The source code of the Python module TEASER was changed in order to enable not only enrichment of ‘office’ and ‘residential’ buildings but also of ‘institute’ buildings. Within TEASER, several zones of usage are defined, which are usually determined automatically in the enrichment. Depending on the module (office, residential, institute), there are usually 6 or 7 zones in a building, each representing a specific type of usage. For this pipeline, the share of each zone in a building was made adaptable in TEASER. The share of each zone compared to the whole area of the building was previously predefined based on archetypes, now the shares are modifiable. For each building, TEASER calculates the missing parameters and generates a separate Modelica model. The output of the enrichment by TEASER is an EnergyADE model and a Modelica simulation model for each of the buildings.
Third, the resulting model is a reduced order simulation model in Modelica. The model can be simulated in the software Dymola which is a Modelica tool for modelling and simulation of complex systems (Dassault Systèmes® Citation2023). BuildingsPy is a python package running Modelica simulations using Dymola (Wetter and USDOE Citation2019). For this pipeline, BuildingsPy was integrated for model simulation. For both Dymola and BuildingsPy, the library AixLib is required, which is a Modelica library for buildings (Müller et al. Citation2016). For the pipeline AixLib 0.7.2 is used. The Modelica model generated by TEASER includes a package of all buildings as multi-zone models. Parameter settings and physics for each building depend on the information given as input to TEASER (rough cubage, main usage, year of construction). For more information on the generation of the Modelica model and its structure, see TEASER (Remmen et al. Citation2018) and AixLib (Müller et al. Citation2016). Within this study, only heat load is simulated; cooling is not considered. However, the generated Modelica model in general gives the opportunity to include cooling. The output of the simulation is the hourly heat load for each of the buildings over one year.
3. Use case
To test the pipeline, simulations for a case study on a district level were performed. As some parameters are not publicly available for a larger area, we cannot demonstrate the pipeline at a larger scale (e.g. city level).
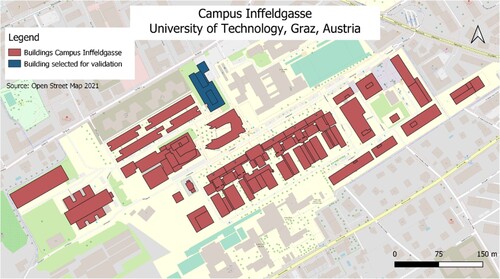
The use case area is the Campus Inffeldgasse of the University of Technology in Graz, Austria. The campus consists of 27 buildings. As open data sets for the case study area were not accurate enough, all buildings from campus were digitised by hand in shp-format (see ). Each building part was drawn as separate footprint in the reference system EPSG:32633 – WGS84/UTM zone 33N. Attributes needed for the pipeline were added as building attributes in the shp-file. Building heights were calculated with GIS methods from the building footprints and a digital terrain model (GIS Steiermark Citation2020). Story heights above ground were not known and therefore roughly estimated by dividing the average height of the building part by the number of storys which is openly available for each building on campus (Technische Universität Graz Citation2021). The year of construction was known from energy performance certificates. The input file for the use case area is available on the GitHub repository.
Figure 3. Case study area Campus Inffeldgasse.
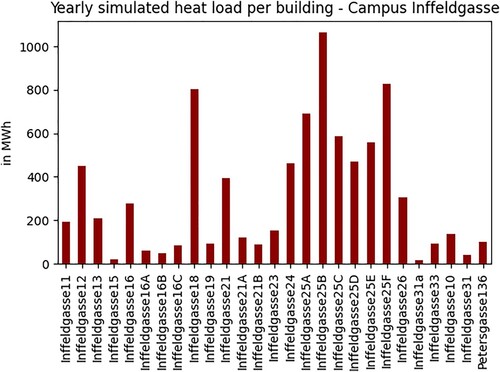
The generated shp-file was taken as input for FME to transform it into a 3D CityGML file which was then modified to fit as input for TEASER like described in the methods section. A graphical representation of the CityGML model created by the pipeline is depicted in . The buildings on campus Inffeldgasse contain mainly offices, laboratories, seminar rooms, or lecture halls for teaching. Therefore, the CityGML module ‘institute’ was chosen for simulations as laboratories are included as zones there. The weather file used for TEASER was generated from TMY data (Lawrie and Crawley Citation2019), which depict typical meteorological data from a region in .epw-format. The .epw-file was downloaded for the period 2015–2019 for the city of Graz and transformed into a .mos-file. The resulting building simulation model contains all 27 buildings from campus. The building models were simulated with BuildingsPy. depicts the simulated heat load for one year for every building in the use case area. The CityGML model, Modelica model and simulation results generated by the pipeline for the use case area are available on the GitHub repository.
Figure 4. Graphical representation of 3D CityGML model.
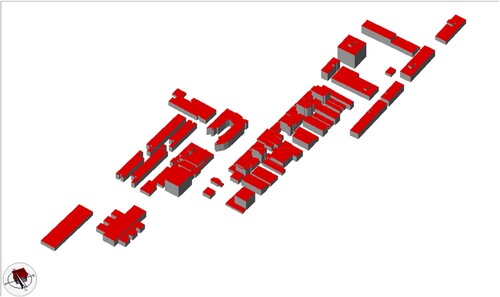
Figure 5. Yearly heat load for all simulated buildings in the use case area.
4. Validation
One building from campus was selected to validate the resulting simulation models with measured data (highlighted in ). Only one building could be selected as this was the only building with measured data available. For the building Inffeldgasse 12 (built in 1976), measured data from past years was available to compare them to the simulation. Within TEASER, the share of each zone for the building was determined based on the real shares of each zone. These data were collected from TUGRAZonline (Technische Universität Graz Citation2021), where information about all rooms in every building is openly available. Based on a classification of each room and the area of each room the percentage of each of the seven zones in the building was determined ().
Table 1. Share of zones in the case study building.
For the simulation of the building a weather file for the year 2019 was generated based on a TMY file (Lawrie and Crawley Citation2019) and actual weather data for Graz for 2019 from the Austrian Zentralanstalt für Meteorologie und Geodynamik (ZAMG). The weather file was generated using the python tool diyepw (Smith et al. Citation2021). Building parameters for the Modelica model generated by TEASER can be found in . Modelica models for the building are available on the GitHub repository for further information.
Table 2. Building parameters for Inffeldgasse 12.
The Modelica simulation model was simulated with BuildingsPy. Building parts were simulated separately. Measured heat load data for the building Inffeldgasse 12 originate from the year 2019. Measured data were available at a 15-minute resolution; these were aggregated to hourly values in order to be comparable to the simulated data (). For the case study building Inffeldgasse 12, composed of four building parts, the summed heat load from the simulation for one year is 428,381 kW. The mean measured heat load (446,620 kW) from the year 2019 is about 18,239 kW smaller than the simulated one leading to a deviation of 4.08%. The Euclidian norm over hourly data is 9991 kW.
Table 3. Simulated and measured heat load of the case study building for one year.
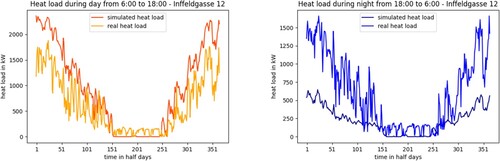
shows the simulated and measured daily heat load for building Inffeldgasse 12. The simulated heat load follows the trend of measured data where there is little or no heating in summer and most heating in winter. Simulations on a daily basis fit with the measured heat load. Especially in winter months the simulated heat load during the night (between 18:00 and 6:00 o’clock) is lower than the measured heat load, while the simulation exceeds the measurements during daytime (between 6:00 and 18:00 o’clock) ().
Figure 6. Daily simulated and measured heat load for Inffeldgasse 12.
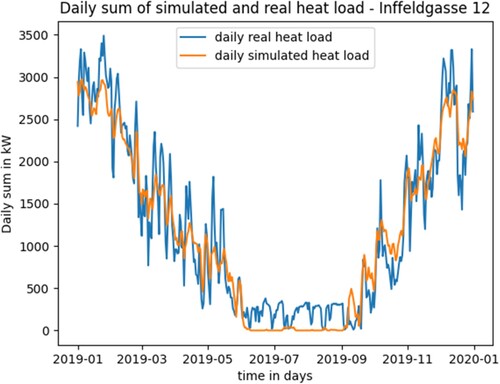
Figure 7. Simulated and measured heat load for Inffeldgasse 12 during day and night.
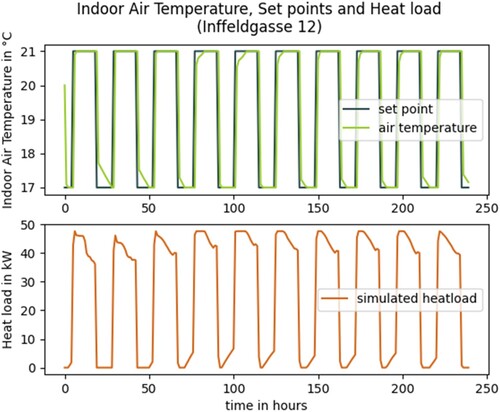
Deviations of simulated heat load from measured heat load can be explained by the set points for the heater defined in the simulation model. The set point defines the desired indoor air temperature and regulates if the heater is switched on or off. For the use case building, set points were automatically defined by TEASER with 21°C during the day and 17°C during the night. As can be seen in , in the morning, heating is turned on to reach 21°C and the heater stops in the evening when the set point drops to 17°C. The heater only starts again when the indoor air temperature drops below the set point. Compared to the simulated heating, where the heater stops completely during the night until the room is cooled down to 17°C, the measured heat load shows that the heater is never switched off completely during the night. The reason for this difference could either be that set points in reality were higher than in the simulation or that the thermal loss of walls, roof and windows modelled does not fit completely with reality leading to a higher need for heating also during the night.
Figure 8. Indoor air temperature, set point for heater and heat load for Inffeldgasse 12 (building part 1 and zone 1 (office)) for first 10 days of simulation.
Within the pipeline parameters like set points are set automatically by TEASER in the enrichment based on input parameters like the year of construction. However, all of the parameters, including set points, can be modified in the Modelica model. It is up for further research to improve the pipeline to generate models that fit better with reality on an hourly basis without modifying parameters manually.
The performance of the building models generated by the pipeline is assessed with the performance metrics R squared, CV(RMSE) (Coefficient of Variation of Root Mean Square Error), and NMBE (Normalised Mean Bias Error), which are used e.g. in (Hong et al. Citation2017; Li et al. Citation2017; Meng and Mourshed Citation2017; Pan, Huang, and Wu Citation2007). Formulas for the calculation of the three metrics can be found in (Meng and Mourshed Citation2017). Metrics were calculated on a daily and monthly basis (). Compared to the acceptable range (Meng and Mourshed Citation2017) for R squared, the simulations meet the requirement of at least 0.7 with 0.9214 and 0.9825 on a daily and monthly basis, respectively. For the other two metrics, CV(RMSE) and NMBE, the model for Inffeldgasse 12 is within or close to the acceptable range (23.51% and 4.06% on a daily basis and 22.10% and 4.06% on a monthly basis, respectively).
Table 4. Performance evaluation.
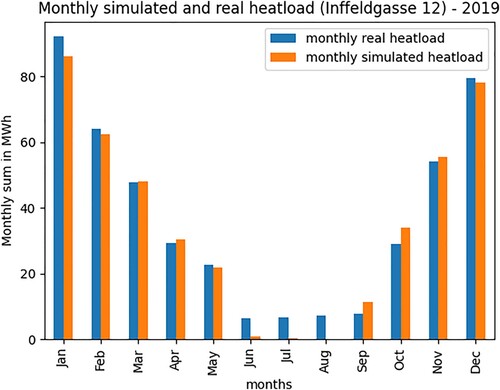
Considering the purpose of applying the pipeline on district or city scale level and the small number of input data needed to generate building energy models, the results for the case study building shows relatively small deviations since the accuracy of one single building is less important due to the high number of buildings. The calculated heat load from the simulation is dependent on data enrichment based on archetypes and can never fully represent a specific building. As results from the case study show, there is variance in results, for instance in heat load during day and night. However, the pipeline provides building energy models for first estimations of heat load, which can be especially useful for planning of new districts or modifying existing ones. depicts the monthly comparison of simulated and measured heat load, demonstrating the accuracy and applicability of the generated model for such applications.
Figure 9. Monthly simulated and measured heat load for Inffeldgasse 12.
The simulation model resulting from the pipeline is dependent on weather data which adds limitations to the pipeline. The pipeline can only be used for the estimation of heat load for buildings and not for forecasting future heat load. Time series or data on weather expected in the future could give interesting results, especially in consideration of changing weather conditions due to climate change which could influence the heat load of buildings. In this case, the pipeline could be used to predict future heat load of buildings on district a or city scale based on scenarios for climate change.
The pipeline depends on several third-party tools. FME and Dymola require a license which makes the pipeline applicable only to users with these licenses. TEASER is an open-source python module. The pipeline uses the TEASER version 0.6.6 which is not the most recent version because enrichment of CityGML data is not provided in later versions. Incorporating license-free tools and newer versions of TEASER would guarantee the persistence of the pipeline and open the access for more applications.
5. Conclusion
When speaking about district or city scale level, tools are needed to generate building energy models in an automated way for a high number of buildings with possibly little data available. The produced results need to be accurate enough and close to reality to design or retrofit buildings. The pipeline ‘SHP2SIM’ offers the possibility to create building energy simulation models by transformation and enrichment based on GIS data and fulfils these requirements to a satisfying degree. The input needed for the pipeline is little and can be generated from open-source data. The pipeline itself is automated and openly available as a python pipeline using existing third-party tools. The functionality of the pipeline was proven on a district with 27 buildings. A validation of generated building models is performed by comparing simulated and measured heat load. The result shows that the heat load of a specific building can be estimated accurately: R squared is 0.9825, CV(RMSE) is 22.10%, and NMBE is 4.06% on a monthly basis. On average, the simulation model is close to reality, especially given the purpose of district or city scale modelling. These results show the relative accuracy of the simulation model originating from the pipeline and therefore prove the validity of the pipeline itself.
Acknowledgements
The reported research has been conducted within the project KityVR (879419), which has received funding in the framework of ‘Stadt der Zukunft’, a research and technology programme of the Austrian Ministry for Transport, Innovation and Technology (BMVIT). Supported by TU Graz Open Access Publishing Fund. The authors acknowledge the support by the University of Graz, Institute of Environmental System Sciences.
Disclosure statement
No potential conflict of interest was reported by the author(s).
Additional information
Funding
References
- Abu Bakar, N. N., M. Y. Hassan, H. Abdullah, H. A. Rahman, M. P. Abdullah, F. Hussin, and M. Bandi. 2015. “Energy Efficiency Index as an Indicator for Measuring Building Energy Performance: A Review.” Renewable and Sustainable Energy Reviews 44: 1–11. https://doi.org/10.1016/j.rser.2014.12.018.
- Agugiaro, G., J. Benner, P. Cipriano, and R. Nouvel. 2018. “The Energy Application Domain Extension for CityGML: Enhancing Interoperability for Urban Energy Simulations.” Open Geospatial Data, Software and Standards 3 (1): 2. https://doi.org/10.1186/s40965-018-0042-y.
- Ahmad, T., H. Chen, Y. Guo, and J. Wang. 2018. “A Comprehensive Overview on the Data Driven and Large Scale Based Approaches for Forecasting of Building Energy Demand: A Review.” Energy and Buildings 165: 301–320. https://doi.org/10.1016/j.enbuild.2018.01.017.
- Allegrini, J., K. Orehounig, G. Mavromatidis, F. Ruesch, V. Dorer, and R. Evins. 2015. “A Review of Modelling Approaches and Tools for the Simulation of District-Scale Energy Systems.” Renewable and Sustainable Energy Reviews 52: 1391–1404. https://doi.org/10.1016/j.rser.2015.07.123.
- Attanasio, A., M. Piscitelli, S. Chiusano, A. Capozzoli, and T. Cerquitelli. 2019. “Towards an Automated, Fast and Interpretable Estimation Model of Heating Energy Demand: A Data-Driven Approach Exploiting Building Energy Certificates.” Energies 12 (7): 1273. https://doi.org/10.3390/en12071273.
- Bokolo, A. J., S. Abbas Petersen, D. Ahlers, and J. Krogstie. 2020. “API Deployment for Big Data Management Towards Sustainable Energy Prosumption in Smart Cities – A Layered Architecture Perspective.” International Journal of Sustainable Energy 39 (3): 263–289. https://doi.org/10.1080/14786451.2019.1684287.
- Chen, Y., M. Guo, Z. Chen, Z. Chen, and Y. Ji. 2022. “Physical Energy and Data-Driven Models in Building Energy Prediction: A Review.” Energy Reports 8: 2656–2671. https://doi.org/10.1016/j.egyr.2022.01.162.
- Cubí, E., J. Ortiz, and J. Salom. 2014. “Potential Impact Evaluation: An ex ante Evaluation of the Mediterranean Buildings Energy Efficiency Strategy.” International Journal of Sustainable Energy 33 (5): 1000–1016. https://doi.org/10.1080/14786451.2013.796945.
- Dassault Systèmes®. 2023. “Dymola Systems Engineering.” https://www.3ds.com/de/produkte-und-services/catia/produkte/dymola/.
- Esri. 2021. “What is a Shapefile? – ArcMap | Documentation.” https://desktop.arcgis.com/en/arcmap/latest/manage-data/shapefiles/what-is-a-shapefile.htm.
- European Commission. 2021. “Factsheet – Energy Performance of Buildings.” Accessed December 3. https://ec.europa.eu/commission/presscorner/detail/pt/fs_21_3673.
- Fuchs, M., J. Teichmann, M. Lauster, P. Remmen, R. Streblow, and D. Müller. 2016. “Workflow Automation for Combined Modeling of Buildings and District Energy Systems.” Energy 117: 478–484. https://doi.org/10.1016/j.energy.2016.04.023.
- Giannakis, G. I., K. I. Katsigrakis, G. N. Lilis, and D. V. Rovas. 2019. “A Workflow for Automated Building Energy Performance Model Generation Using BIM Data.” Building Simulation Conference Proceedings 1: 167–174. https://doi.org/10.26868/25222708.2019.210689.
- GIS Steiermark. 2020. “Airborne Laserscanning-basierende Höhendaten kostenfrei downloadbar – Landesentwicklung – Land Steiermark.” https://www.landesentwicklung.steiermark.at/cms/beitrag/12803182/142970647/.
- Gorzalka, P., J. Estevam Schmiedt, C. Schorn, and B. Hoffschmidt. 2021. “Automated Generation of an Energy Simulation Model for an Existing Building from UAV Imagery.” Buildings 11 (9): 380. https://doi.org/10.3390/buildings11090380.
- Gröger, G., and L. Plümer. 2012. “CityGML – Interoperable Semantic 3D City Models.” ISPRS Journal of Photogrammetry and Remote Sensing 71: 12–33. https://doi.org/10.1016/j.isprsjprs.2012.04.004.
- Hong, T., Y. Chen, X. Luo, N. Luo, and S. H. Lee. 2020. “Ten Questions on Urban Building Energy Modeling.” Building and Environment 168: 106508. https://doi.org/10.1016/j.buildenv.2019.106508.
- Hong, T., J. Kim, J. Jeong, M. Lee, and C. Ji. 2017. “Automatic Calibration Model of a Building Energy Simulation Using Optimization Algorithm.” Energy Procedia 105: 3698–3704. https://doi.org/10.1016/j.egypro.2017.03.855.
- Lawrie, L., and D. Crawley. 2019. “Development of Global Typical Meteorological Years (TMYx).” https://climate.onebuilding.org/.
- Li, W., Y. Zhou, K. Cetin, J. Eom, Y. Wang, G. Chen, and X. Zhang. 2017. “Modeling Urban Building Energy Use: A Review of Modeling Approaches and Procedures.” Energy 141: 2445–2457. https://doi.org/10.1016/j.energy.2017.11.071.
- Malhotra, A., J. Bischof, A. Nichersu, K. H. Häfele, J. Exenberger, D. Sood, J. Allan, et al. 2022a. “Information Modelling for Urban Building Energy Simulation—A Taxonomic Review.” Building and Environment 208: 108552. https://doi.org/10.1016/j.buildenv.2021.108552.
- Malhotra, A., M. Shamovich, J. Frisch, and C. van Treeck. 2022b. “Urban Energy Simulations Using Open CityGML Models: A Comparative Analysis.” Energy and Buildings 255: 111658. https://doi.org/10.1016/j.enbuild.2021.111658.
- Meng, Q., and M. Mourshed. 2017. “Degree-Day Based Non-Domestic Building Energy Analytics and Modelling Should Use Building and Type Specific Base Temperatures.” Energy and Buildings 155: 260–268. https://doi.org/10.1016/j.enbuild.2017.09.034.
- Müller, D., M. Lauster, A. Constantin, M. Fuchs, and P. Remmen. 2016. “AixLib – An Open-Source Modelica Library Within the IEA-EBC Annex 60 Framework.” https://www.researchgate.net/publication/310465168_AixLib_-_An_Open-Source_Modelica_Library_within_the_IEA-EBC_Annex_60_Framework.
- Nageler, P., G. Zahrer, R. Heimrath, T. Mach, F. Mauthner, I. Leusbrock, H. Schranzhofer, and C. Hochenauer. 2017. “Novel Validated Method for GIS Based Automated Dynamic Urban Building Energy Simulations.” Energy 139: 142–154. https://doi.org/10.1016/j.energy.2017.07.151.
- Pan, Y., Z. Huang, and G. Wu. 2007. “Calibrated Building Energy Simulation and Its Application in a High-Rise Commercial Building in Shanghai.” Energy and Buildings 39 (6): 651–657. https://doi.org/10.1016/j.enbuild.2006.09.013.
- Pedersen, L. 2007. “Use of Different Methodologies for Thermal Load and Energy Estimations in Buildings Including Meteorological and Sociological Input Parameters.” Renewable and Sustainable Energy Reviews 11: 998–1007. https://doi.org/10.1016/j.rser.2005.08.005.
- Remmen, P., M. Lauster, M. Mans, M. Fuchs, T. Osterhage, and D. Müller. 2018. “TEASER: An Open Tool for Urban Energy Modelling of Building Stocks.” Journal of Building Performance Simulation 11 (1): 84–98. https://doi.org/10.1080/19401493.2017.1283539.
- Safe Software. 2022. “FME – The Simple Solution for Complex Integration.” https://www.safe.com/.
- Schiefelbein, J., J. Rudnick, A. Scholl, P. Remmen, M. Fuchs, and D. Müller. 2019. “Automated Urban Energy System Modeling and Thermal Building Simulation Based on OpenStreetMap Data Sets.” Building and Environment 149: 630–639. https://doi.org/10.1016/j.buildenv.2018.12.025.
- Schweiger, G., L. V. Eckerstorfer, I. Hafner, A. Fleischhacker, J. Radl, B. Glock, M. Wastian, et al. 2020. “Active Consumer Participation in Smart Energy Systems.” Energy and Buildings 227: 110–359. https://doi.org/10.1016/j.enbuild.2020.110359.
- Schweiger, G., J. Exenberger, A. Malhotra, T. Schranz, T. Boiger, C. van Treeck, and J. O’Donnell. 2021. “Data Shortage for Urban Energy Simulations? An Empirical Survey on Data Availability and Enrichment Methods Using Machine Learning?” EG-ICE 2021 Workshop on Intelligent Computing in Engineering. https://doi.org/10.14279/depositonce-12021.
- Schweiger, G., R. Heimrath, B. Falay, K. O’Donovan, P. Nageler, R. Pertschy, G. Engel, W. Streicher, and I. Leusbrock. 2018. “District Energy Systems: Modelling Paradigms and General-Purpose Tools.” Energy 164: 1326–1340. https://doi.org/10.1016/j.energy.2018.08.193.
- Smith, A. D., B. Stürmer, T. Thurber, and C. R. Vernon. 2021. “diyepw: A Python Package for Do-It-Yourself EnergyPlus Weather File Generation.” Journal of Open Source Software 6 (64): 3313. https://doi.org/10.21105/joss.03313.
- Suesser, T., and T. Dogan. 2017. “Campus Energy Model: Using a Semi-Automated Workflow to Build Spatially Resolved Campus Building Energy Models for Climate Change and Net-Zero Scenario Evaluation.” Building Simulation Conference Proceedings 5: 2274–2282. https://doi.org/10.26868/25222708.2017.361.
- Technische Universität Graz. 2021. “TUGRAZonline – Räume.” https://online.tugraz.at/tug_online/webnav.ini.
- Wetter, M., and USDOE. 2019. “BuildingsPy [Computer Software].” https://doi.org/10.11578/DC.20190430.2.