
 ?Mathematical formulae have been encoded as MathML and are displayed in this HTML version using MathJax in order to improve their display. Uncheck the box to turn MathJax off. This feature requires Javascript. Click on a formula to zoom.
ABSTRACT
This study examines the relationships between CO2 emissions, GDP, renewable energy consumption, and trade openness across 37 OECD countries from 1995–2020. Using a Panel Vector Autoregressive (PVAR) model and Granger Causality tests, the research probes the causality among these factors. Key findings show a notable causality from GDP, renewable energy, and trade openness to CO2 emissions. Specifically, lags in renewable energy consumption and trade openness significantly decrease CO2 emissions. Surprisingly, GDP's influence on CO2 emissions is found to be negligible, challenging the typical belief linking economic growth to environmental degradation. These insights hold great value for policymakers in environmental governance and climate finance. The data underscores the importance of promoting renewable energy and trade openness for effective CO2 reduction. The study advocates a sustainable environmental governance model, emphasizing strong legal structures and clarity in execution. Since GDP doesn't significantly impact CO2 emissions, there's potential to pivot towards sustainable economic growth models. The research offers a foundational empirical groundwork, suggesting that expanding future studies to include diverse variables might yield a more comprehensive understanding of the relationships in question.
1. Introduction
Climate change has firmly established itself as a paramount ecological concern within the dawn of the twenty-first century, with a rapidly escalating focus directed towards the potential ramifications this global event may impose on both our natural environment and the societal structures within it. Although establishing a direct causal link between specific climatic occurrences and global warming may be fraught with inherent complexities, the undeniable escalation in global temperatures is anticipated to catalyze more far-reaching transformations. These include, but are not limited to, the retreat of glacial formations and the perceptible reduction in ice coverage. Equally concerning is the association between climate change and mass fatalities within various species, including flora, fish, corals, and a multitude of other well-evolved organisms (IPCC Citation2018).
An aspect of particular gravitas is the intersection between global warming and economic disparity. An abundance of scholarly research suggests that nations on the lower echelons of development, or individuals with limited means, are subjected to exacerbated negative repercussions from a shifting environment. This predicament arises either due to a deficiency in resources required for robust environmental defense mechanisms or the unfortunate circumstance of their habitation within warmer climes where any incremental warming has a pronounced deleterious effect on productivity and health. When one factors in the historically significant contribution of developed nations to greenhouse gas emissions, any indication of an unequal distribution of climate change effects starkly underscores essential questions of global justice and equity (World Bank Citation2021).
The issue of climate change, as discussed in the seminal Paris Agreement and the Intergovernmental Panel on Climate Change's Special Report on Global Warming of 1.5°C (IPCC Citation2018), primarily centres on the escalation of global temperatures. In a broader sense, climate change, precipitated by alterations in customary temperature and precipitation patterns as well as climate system fluctuations, has the potential to significantly affect the supply and efficiency of various production factors. Consequently, this can instigate sweeping alterations in production paradigms (World Bank Citation2010). Such transformations can reverberate negatively on economic growth and development, given their intrinsic links to the capacity for long-term expansion. The repercussions of climate change on economic growth are manifested through direct impacts on production components, inclusive of natural resources that are contingent on both physical and human resources (IPCC Citation2018). These impacts are rooted in the vital role that climate fulfills as a natural variable within the production process. Simultaneously, climate shifts resultant from production and consumption activities can impose a broad spectrum of effects on other production elements.
To delve into the enduring financial and ecological repercussions of climate change, and to critically assess the viability of potential remedial and adaptive methodologies, scholars often employ numerous future outlooks within the realm of climate change research (Van Vuuren and Carter Citation2014). Since 1990, the esteemed Intergovernmental Panel on Climate Change (IPCC) has harnessed a plethora of such scenarios, beginning with SA90, transitioning into IS92, and eventually culminating in the Special Report on Emissions Scenarios published in 2007. These comprehensive scenarios were meticulously crafted by integrating influential economic variables, which drive greenhouse gas emissions, with atmospheric and environmental processes.
Nevertheless, the employment of this sequential paradigm has inadvertently engendered a host of inconsistencies and has significantly impeded the development of emissions scenarios (Moss et al. Citation2010). Recognising the need for a more streamlined and cohesive approach, the climate research fraternity initiated a novel scenario creation methodology in 2006. This innovative method proactively espouses an integrated stance, thereby circumventing the procedural setbacks associated with the earlier sequential approach.
The ground-breaking work of Van Vuuren and Carter (Citation2014) provides a lucid and encompassing analysis of this contemporary scenario structure. It consists of two pivotal components: firstly, four Representative Concentration Pathways (RCP) scenarios that portray potential future trajectories of greenhouse gas emissions, along with the varying concentrations of atmospheric constituents that exert an influence on the radiative forcing of the climate system. Secondly, it introduces five Shared Socioeconomic Pathways (SSP) scenarios that provide both narrative descriptions and quantitative predictions of possible future developments within the economic domain.
When used in tandem, these two sets of scenarios offer an integrated matrix that effectively encapsulates the multifaceted potential impacts of fluctuations in global temperature. This comprehensive understanding of the carbon economy becomes especially pivotal for corporations and investors who are keen on integrating sustainability into their operational and investment strategies. This, indeed, marks an imperative step towards a future that reconciles economic growth with ecological preservation.
Sustainability, undeniably, is intrinsically interwoven with considerations of energy and carbon efficiency. Several investigative studies have been undertaken in a bid to comprehend the complex interplay between variables such as CO2 emissions, Gross Domestic Product (GDP), consumption of renewable energy, and the openness of trade. Nonetheless, the conclusions drawn from these studies often hinge on overly simplified measures. To address this lacuna, we endeavour to unravel the intricate relationship between carbon emissions, GDP, consumption of renewable energy, and the dynamics of trade openness, by employing Panel Vector Autoregressive (PVAR) analyses in the context of the Organization for Economic Co-operation and Development (OECD) countries.
The OECD, established in 1961, is an intergovernmental economic organisation that boasts 38 member nations, and its primary mandate is to foster economic growth and stimulate world trade. This consortium of countries collectively upholds the principles of democracy and market economy, and works towards ensuring prosperity for all its member nations. The majority of the OECD members are high-income economies that score highly on the Human Development Index (HDI), thereby categorising them as developed countries.
Several critical factors render the OECD nations particularly significant for this study. First, all OECD nations are categorised under Annex I parties as per the Kyoto Protocol, with legally binding targets for the reduction of CO2 emissions. Additionally, these countries have pledged their commitment to the Paris Agreement aimed at mitigating climate change. Furthermore, there has been a noticeable downward trend in the energy intensity index among OECD nations.
In the quest to understand the intricacies of green economics, the central research question this study aims to address is: “How do CO2 emissions, economic growth, and renewable energy consumption interrelate within the context of OECD countries, and what are the implications of their dynamics for green economics?” Stemming from this, the study hypothesise that an increase in renewable energy consumption and trade openness within OECD nations leads to a notable reduction in CO2 emissions.
The primary objective of the this investigation is to delineate the intricate dynamics between CO2 emissions, economic growth, and renewable energy consumption within the framework of OECD nations.
While the existing literature has extensively probed into the individual relationships between CO2 emissions, GDP, and renewable energy, there remains a discernible gap. Few studies offer a comprehensive examination of their tripartite interaction, especially within the unique backdrop of OECD countries. This study, motivated by escalating global concerns regarding the detrimental impacts of global warming and the pivotal role of CO2 emissions therein, seeks to fill this lacuna. Given the current global endeavours to reduce carbon footprints, the insights from this research bear significant relevance. They can potentially guide policymakers in OECD countries towards forging sustainable economic strategies that harmonise with environmental conservation.
What sets this study apart is its methodological approach and scope. Unlike extant research that often isolates variables, our exploration employs the Panel Vector Autoregression (PVAR) model, offering a holistic perspective of the intertwined relationships amongst the variables in question. Furthermore, by focusing specifically on the OECD context, this research offers a distinctive vantage point, highlighting nuances that might be overlooked in broader global studies. A noteworthy innovation of our research is the emphasis on the underplayed significance of trade openness in green economics. The study aim to unravel its symbiotic relationship with renewable energy consumption, shedding light on its pivotal role in determining CO2 emission levels.
List of Notations.
CO2: Carbon Dioxide Emissions
GDP: Gross Domestic Product
OECD: Organisation for Economic Co-operation and Development
PVAR: Panel Vector Autoregressive
EViews: Econometric software used for the study
CDLM: Cross-Sectional Dependence Lagrange Multiplier
CD: Cross-Sectional Dependence
MENA: Middle East and North Africa
ARDL: Auto-Regressive Distributive Lags
PMG-ARDL: Pooled Mean Group Auto-Regressive Distributive Lags
FDI: Foreign Direct Investment
OLS: Ordinary Least Squares
DCCEM: Dynamic Common Correlated Effects Model
AMG: Augmented Mean Group
NCA: Necessary Condition Analysis
fsQCA: Fuzzy-Set Qualitative Comparative Analysis
IIT: Intra-Industry Trade
EKC: Environmental Kuznets Curve
SO2: Sulfur Dioxide
PM10: Particulate Matter (10 micrometers or less in diameter)
HDI: Human Development Index
IPCC: Intergovernmental Panel on Climate Change
SA90: IPCC Scenario 1990
IS92: IPCC Scenario 1992
RCP: Representative Concentration Pathways
SSP: Shared Socioeconomic Pathways
GMM: Generalised Method of Moments
Variables and Indices.
i: Index for OECD countries (1, 2, 3, …)
t: Chronological sequence of years (1995 to 2020)
ϵ: Error term
N: Number of countries in the study
T: Time period in the study
ρij: Product-moment correlation coefficient of the disturbances
n: Intercept in Granger causality equations
e1t, e2t: Error terms in Granger causality equations
β11,β12: Coefficients in Granger causality equations
2. Review of literature
Over the past several decades, myriad scholarly investigations have sought to elucidate the variables that contribute significantly to the complex issue of climate change. Among these, an influential study by M’henni (Citation2005) scrutinised the intricate relationships among renewable energy resources, the degree of trade openness, and carbon emissions within the context of Tunisia during the span from 1980 to 1997. The study utilised investigative tools including the Generalized Method of Moments (GMM) and a set of pollutant indicators, such as CO2 emissions and fertilisers, all aimed at quantifying environmental quality.
Interestingly, M'henni's analysis found no evidence supporting the Environmental Kuznets Curve (EKC) hypothesis, which suggests that environmental quality initially worsens with rising income but eventually improves beyond a certain threshold. This investigation is noteworthy among the limited number of studies exploring the convergence of renewable energy, trade openness, and carbon emissions. The focus on Tunisia in this study further imparts invaluable insights into the unique scenario of a developing country, which could potentially harbour a different nexus among these variables when compared to their developed counterparts. Taking this discourse further, Akbostancı, Turut-Asık, and Tunç (Citation2009) embarked on an examination of the interplay between CO2, SO2, PM10 emissions, energy utilisation, and economic growth within Turkey, operating on two distinct analytical levels. Their findings unveiled a steadily increasing, or monotonic, relationship at the aggregate public level, while at the regional level, they observed a more convoluted N-shaped relationship. Intriguingly, their observations did not corroborate the EKC hypothesis. Adding another dimension to this dialogue, Chebbi, Olarreaga, and Zitouna (Citation2009) dissected the connection between trade openness, economic development, and per capita pollution emissions in Turkey utilising cointegration analysis techniques. Their analyses revealed a positive association between trade openness and per capita emissions and conversely, a negative correlation between economic development and per capita pollution emissions over an extended period. These studies collectively enhance our understanding of the intricate interrelationships among energy utilisation, trade openness, economic growth, and environmental quality, particularly within the context of Turkey. They intimate a complex dynamic among these variables, suggesting that the influence of economic growth on environmental quality may manifest differently across regions. Further, these studies imply that trade openness may indeed exert a positive impact on per capita emissions, a revelation that stands in stark contrast to the predictions of the EKC hypothesis, which anticipates a negative correlation between trade openness and emissions.
The intricate interplay between environmental variables and economic indices has been a focal point of economic and business research in recent times. In a notable contribution to this field, Fodha and Zaghdoud (Citation2010) postulated the existence of a positive linear association between per capita CO2 emissions and per capita Gross Domestic Product (GDP), thereby affirming the assertions of the Environmental Kuznets Curve (EKC) hypothesis. However, they observed a divergent pattern when exploring the relationship between per capita SO2 emissions and per capita GDP, which instead followed a non-linear trajectory, conforming to an N-shaped pattern. This intriguing finding throws into relief the fact that the EKC hypothesis, with its prediction of a unidirectional relationship between environmental degradation and economic growth, may not apply uniformly across all environmental indicators. In the specific investigation carried out by Fodha and Zaghdoud (Citation2010), the primary objective was to probe into the relationship between per capita emissions of two key pollutants, namely CO2 and SO2, and per capita GDP. To this end, they employed sophisticated econometric methodologies to scrutinise data garnered from a variety of countries. Their analyses revealed that the interrelationship between per capita CO2 emissions and per capita GDP is, in fact, positive and linear, thereby validating the EKC hypothesis. This hypothesis propounds the idea that an uptick in a country's economic progression initially leads to an escalation in environmental degradation, which subsequently diminishes once the economy reaches a certain developmental threshold. Contrarily, the relationship observed between per capita SO2 emissions and per capita GDP was distinctly non-linear, taking on the form of an N-shaped curve. This discordance suggests that the applicability of the EKC hypothesis might be contingent on the specific environmental indicators being considered and that the interrelationships between different pollutants and economic progression might vary. The implications of this study are manifold, highlighting the convoluted nature of the relationship between environmental degradation and economic growth. It points towards the influence of several variables such as the nature of the pollutant in question, the economic development stage of the country, and the environmental policy frameworks in place.
In complementing these insights, additional research endeavours such as those conducted by Wang et al. (Citation2011) and Salim and Rafiq (Citation2012) further substantiate the intricate and context-specific nature of the relationship between economic growth, CO2 emissions, and energy consumption. While these studies corroborate the EKC hypothesis to a degree, by documenting a positive association between economic growth and CO2 emissions, they simultaneously highlight a bidirectional relationship between renewable energy consumption and CO2 emissions. This bidirectionality posits that an increase in renewable energy consumption could precipitate a commensurate decrease in CO2 emissions, thereby implying a multifaceted relationship between these variables. The complexity and contextual nuances characterising the relationship between economic growth, CO2 emissions, and energy consumption have been explored in various scholarly studies, each employing distinctive methodologies and delivering diverse findings. In this vein, Arouri et al. (Citation2012) focused their investigations on the Middle East and North African (MENA) countries, concluding that the trajectory of the relationship between economic growth and CO2 emissions does not adhere to the conventional Environmental Kuznets Curve (EKC) pattern. Notably, the research suggested the feasibility of CO2 emissions reduction through energy conservation strategies, with no deleterious impact on economic growth, further underlining the complexity and heterogeneity of these relationships. The quintessential feature of these studies is their emphasis on the intricate and context-dependent relationship between economic growth, CO2 emissions, and energy consumption. They underscore the importance of considering numerous factors such as the specific stage of economic development, the environmental policies currently enforced, and the type of pollutants. Moreover, the works of Fodha and Zaghdoud (Citation2010), Wang et al. (Citation2011), Salim and Rafiq (Citation2012), and Arouri et al. (Citation2012) provide compelling evidence of the multifaceted and context-dependent nature of this relationship. Adding a unique dimension to this body of literature, Afjal and Sajeev (Citation2022) found a lack of significant association between cryptocurrencies and the energy markets over an extended timeframe, further complicating our understanding of the dynamics at play.
The complexity of these relationships has been extensively explored using a variety of methodological approaches including decomposition (Zhang and Da Citation2015), cointegration analysis (Ahmad et al. Citation2016), vector error correction model (Chaabouni, Zghidi, and Ben Mbarek Citation2016), panel quantile regression model (Zhu et al. Citation2016), cross-correlation estimate technique (Narayan, Saboori, and Soleymani Citation2016), and dynamic panel model (Ito Citation2017). These studies’ results have pointed to a bidirectional relationship between economic growth, energy consumption, and CO2 emissions in some countries (Fernández-Amador et al. Citation2017). Conversely, in others, either economic growth has been found to be the primary driver of CO2 emissions (Bekhet, Matar, and Yasmin Citation2017) or energy consumption (Odugbesan and Rjoub Citation2020). In some cases, a long-term relationship between economic growth, energy consumption, and CO2 emissions has been found to be intertwined with urbanisation (Odugbesan and Rjoub Citation2020). Contributing to the body of findings, Afjal and Kavya (Citation2021) discovered that an astonishing 42 countries exhibited no substantial energy efficiency. This indicates that the direction and magnitude of the relationship can vary widely, contingent on the specific country or region under study, as well as the distinct industries and sectors propelling economic growth. Additionally, the influence of other factors, such as energy efficiency and technological advancements, cannot be overlooked, further attesting to the complexity and multifaceted nature of these interrelationships.
Numerous scholarly inquiries have been undertaken to discern the relationship between renewable energy consumption and CO2 emissions, utilising varied methodological approaches, such as the Auto-Regressive Distributive Lags (ARDL) model. For instance, Bekun, Alola, and Sarkodie (Citation2019) applied the PMG-ARDL model and established that non-renewable energy utilisation heightens CO2 emissions, whereas renewable energy consumption mitigates them. Contrasting results were discovered by Nguyen and Kakinaka (Citation2019), who determined that the relationship between CO2 emissions and renewable energy consumption is contingent upon the individual country and its developmental stage. In this context, low-income countries demonstrated a positive correlation between renewable energy consumption and CO2 emissions, while high-income countries showed an inverse relationship. Further examination of this relationship was undertaken by Nathaniel and Iheonu (Citation2019), who scrutinised the interplay between renewable energy consumption and CO2 emissions in Africa. Utilising both first and second-generation panel models, they discovered that renewable energy utilisation effectively reduces CO2 emissions within the African context. In a similar vein, Saudi, Sinaga, and Jabarullah (Citation2019) unveiled that while economic growth, renewable and non-renewable energy consumption exert a positive influence on CO2 emissions in the long run, renewable energy consumption counteracts this by negatively impacting CO2 emissions. Such studies underscore the intricate and variable relationship between renewable energy consumption and CO2 emissions, contingent on specific national circumstances and stages of development. Further research has been conducted on the relationship between non-renewable and renewable energy consumption and CO2 emissions. Le, Chang, and Park (Citation2020) established that while non-renewable energy consumption exacerbates CO2 emissions universally, renewable energy consumption ameliorates CO2 emissions in developed nations, a phenomenon not observed in developing countries. This is supported by the findings of Sharif et al. (Citation2020), who reported a negative association between renewable energy consumption and CO2 emissions.
Exploring these complex dynamics further, Ummalla and Goyari (Citation2021) posited that while energy utilisation and development amplify CO2 emissions, renewable energy consumption has the opposite effect, thus confirming the validity of the Environmental Kuznets Curve (EKC) theory. Similarly, Afjal and Ahmad (Citation2018) emphasised the urgency for policy makers to address these complex interactions swiftly, by optimising scale size and eliminating managerial inefficiencies. The research conducted by Khan, Khan, and Rehan (Citation2020) on Pakistan's economic growth, energy utilisation, and CO2 emissions from 1965 to 2015 found that economic growth and energy utilisation exacerbate CO2 emissions in both the long and short run. The research by Sajeev and Afjal (Citation2022) indicated that Bitcoin could serve as a hedge against stock market volatility. However, Adebayo et al. (Citation2021), while evaluating the influence of renewable energy consumption on CO2 emissions in South Africa from 1980 to 2018, found a negligible relationship between CO2 and renewable energy consumption, despite using both frequency domain causality and the ARDL approach.
The role of trade openness in determining CO2 emissions is deemed substantial and has been the focal point of multiple investigations. Jayanthakumaran, Verma, and Liu (Citation2012), employing bounds testing approach and the Auto-Regressive Distributive Lag (ARDL) technique, deduced that trade openness and energy utilisation had a positive influence on CO2 emissions in the Chinese context, yet this was not corroborated for India over the period 1971-2007. Dogan and Turkekul (Citation2016) observed a U-shaped relationship between income and CO2 emissions for the United States spanning the period 1960-2010, while trade openness was discovered to have a negative impact on pollution levels. Zhang, Liu, and Bae (Citation2017) critically evaluated the impact of trade openness on CO2 emissions from 1971 to 2013 and established a negative correlation using modern panel methods. These studies collectively suggest that the relationship between trade openness and CO2 emissions is intricate and potentially variable based on the specific national context and temporal dimensions. Further investigations have aimed to understand the relationship between trade openness and CO2 emissions across various nations and time frames. Olale et al. (Citation2018), for instance, discovered an insignificant influence of trade openness on CO2 emissions in Canada spanning the period 1990-2014 by scrutinising the Environmental Kuznets Curve (EKC) hypothesis. Mutascu (Citation2018) found no discernible correlation between trade openness and CO2 emissions in a time frequency study. Salman et al. (Citation2019) found that exports served to enhance CO2 emissions in select Asian nations, and further disentangled the impact of trade openness into the scale, composition, and technological factors. Zamil, Furqan, and Mahmood (Citation2019) established a positive relationship between trade openness and CO2 emissions in Oman for data spanning from 1972 to 2014 using the ARDL approach. In their research, Shahbaz et al. (Citation2019) concluded that while energy consumption exacerbates CO2 emissions in the United States, trade openness mitigates these emissions. Mutascu and Sokic (Citation2020) corroborated this trend within the European Union, noting that between 1996 and 2014, trade openness was found to reduce CO2 emissions, a finding made apparent through the wavelet test. Furthering these findings, Essandoh, Islam, and Kakinaka (Citation2020) discovered that trade openness reduces CO2 emissions in developed economies after analyzing the impact of trade on CO2 emissions in 52 advanced and developing nations. Koc and Bulus (Citation2020) found that trade openness significantly decreased per capita CO2 emissions in Korea from 1971 to 2017. Similarly, Musah et al. (Citation2021) identified a bidirectional causal relationship between CO2 emissions and trade openness across eight developing nations, based on data from 1990 to 2016, utilising the DCCEM and AMG methodologies.
Agricultural development, as pivotal as it is for human livelihood, also contributes to environmental degradation, especially in terms of CO2 emissions. A study by Karimi Alavijeh et al. (Citation2022) utilised panel quantile regression to analyze the influence of agricultural development on CO2 emissions across the 15 most populous developing countries from 2004 to 2020. The findings demonstrate that agricultural value added significantly contributes to CO2 emissions, with energy consumption and trade openness being dominant factors influencing this relationship. Exploring further into the effects of economic intricacies on the environment, Kazemzadeh et al. (Citation2022) addressed the impact of economic structure complexity and the quality of exported goods on the ecological footprint. Using a unique two-step approach involving club convergence and panel quantile regression, their findings emphasised that economic complexity initially exacerbates the ecological footprint but mitigates environmental damage in the middle and higher quantiles. Drawing from Koengkan et al. (Citation2022), we note that in Portugal, from 2014 to 2021, financial and fiscal incentive policies influenced residential properties’ energy efficiency. Their study, using the Ordinary Least Squares (OLS) model, revealed that higher per capita income negatively impacted the choice of top-tier energy-efficient homes, causing consumers to favour less costly, lower-efficiency housing. Conversely, consumer credit and fiscal policies favoured higher-grade energy-efficient housing. Examining the interlink between trade, investment, and energy on carbon emissions, Leitão, Koengkan, and Fuinhas (Citation2022) focused on the intra-industry trade (IIT) between Portugal and Spain. The study found a negative correlation between IIT and Portuguese CO2 emissions, suggesting that such trade patterns could be environmentally beneficial. Additionally, Portuguese Foreign Direct Investment (FDI) and renewable energy initiatives were observed to reduce CO2 emissions. Delving into the domain of technology and policy effects on emissions, Dehdar et al. (Citation2022) investigated the influence of these elements on CO2 emissions across 36 OECD countries from 1994 to 2015. The empirical findings underscored that while aspects like GDP, fossil fuel consumption, and industrialisation intensify CO2 emissions, strategies such as imposing environmental taxes and promoting trade in nuclear-generated electricity can lead to sustainable economic growth with reduced emissions. While Afjal et al. (Citation2023) provide a more direct link to sustainability, Trivedi et al. (Citation2021) offer insights into the financial market complexities that could be harnessed to drive sustainable investments.
In the existing literature, various methodologies have been applied to study the relationships among CO2 emissions, energy consumption, and economic growth. Magazzino et al. (Citation2023) explored the trilemma among these variables in Russia, employing both time-series analyses and machine learning techniques. Their findings supported a bidirectional causality between energy use and CO2 emissions and a unidirectional link from CO2 emissions to GDP (Magazzino et al. Citation2023). This research contributes to the understanding that energy conservation measures will not necessarily impede economic growth, especially important given Russia's geopolitical significance. Similar work by Magazzino and Mele (Citation2022) adopted a new machine learning algorithm, the D2C algorithm, to study the same variables but over a longer time frame. Their study corroborated the existence of causal links in “sub-permanent states” among economic growth, energy use, and CO2 emissions. The results underscored the role of economic growth in justifying expenses for alternative, less polluting energy sources (Magazzino and Mele Citation2022). Taking the context to Italy, Mele et al. (Citation2021) used machine learning tools like gradient descent algorithms to investigate the dynamics between economic growth and environmental pollution. Contrary to popular belief, their findings revealed a correlation between low economic growth and an increase in CO2 emissions, calling into question some of the prevailing notions about economic growth and environmental degradation (Mele et al. Citation2021). In another study that extends beyond just CO2 emissions and energy use, Magazzino, Mele, and Schneider (Citation2022) used Artificial Neural Networks (ANNs) to examine the interactions between logistics performance, energy demand, and environmental degradation in EU countries. Their research highlighted that CO2 emissions and oil consumption significantly affect transport logistics but found no strong influence in the reverse direction, suggesting a one-way causal link (Magazzino, Mele, and Schneider Citation2022). Research by Magazzino, Gallegati, and Giri (Citation2023) applied both parametric and semi-parametric models to assess the Environmental Kuznets Curve (EKC) hypothesis. Their study covered nine advanced economies from 1870 to 2008, finding that the inverted U-shaped relationship between CO2 and GDP exists only for certain countries when parametric regression models are employed (Magazzino, Gallegati, and Giri Citation2023).
Highlighting the transition of energy paradigms in Latin American and Caribbean countries, Koengkan, Fuinhas, and Vieira (Citation2023) elucidated the asymmetric impact of this shift on environmental degradation. Their results reflected the efficiency of renewable energy technologies, underlining their capacity to reduce environmental degradation, especially in light of the increasing participation of renewable energy sources in the regional energy matrix.
Lastly, exploring the factors influencing carbon emission intensity, Kazemzadeh et al. (Citation2023) utilised both necessary condition analysis (NCA) and fuzzy-set qualitative comparative analysis (fsQCA). Their findings emphasise the importance of economic growth, urbanisation, fossil energy consumption, and institutional quality in dictating carbon emission intensity levels, thus urging policymakers to prioritise sustainable development and energy transitions.
4. Data and methodological framework
For the purposes of this investigation, annual data from the years 1995 to 2020 was procured, focusing on key indicators such as CO2 emissions, economic growth (as approximated by the GDP per capita expressed in current US dollars), the proportion of renewable energy consumption in total final energy consumption, and the degree of trade openness. The study opted for a time series analysis to examine trends and relationships over an extended period, given our research focus on environmental, economic, and energy interplay. The 1995-2020 timeframe was chosen deliberately. 1995 marks the beginning of the World Trade Organization, ushering a new global trade era. Conversely, 2020 signifies the onset of the COVID-19 pandemic, impacting global trade and emissions. Within this period, several pivotal events, such as the 2008 financial crisis and the 2015 Paris Agreement, occurred that directly relate to the study variables. These events help contextualise our chosen timeframe and highlight its relevance to our research question.
The Organisation for Economic Co-operation and Development (OECD) comprises 38 member nations. Nevertheless, this particular study incorporates data from only 37 countries, excluding Israel, for which sufficient data could not be procured within the stipulated timeframe. Studying the OECD countries was a deliberate decision underpinned by several compelling reasons. Firstly, the OECD countries collectively represent approximately 60% of the world's GDP. This economic significance means that understanding the dynamics and interactions within these countries can offer pivotal insights into broader global economic and environmental trends. Additionally, the OECD is renowned for its robust, standardised, and high-quality data, ensuring that our analysis is grounded in reliable and credible sources. The diverse spectrum of countries within the OECD, each with its unique economic structure and energy profile, provides a rich tapestry for analysis, allowing our findings to be more nuanced and generalisable. Lastly, the policy decisions and frameworks established within the OECD often serve as benchmarks or precedents in global policy debates. This is especially true in areas that intersect economics, the environment, and energy. Consequently, focusing on the OECD not only enhances the empirical robustness of the study but also amplifies its relevance in the ongoing global policy discourse.
The data on GDP, renewable energy consumption (abbreviated as REC), and trade openness (represented as TO) were retrieved from the World Development Indicators repository. In addition to these, CO2 emissions data were sourced directly from the OECD's official data website.
In conducting our analysis, we employed the econometric software EViews. The specific EViews commands utilised for this study facilitated our preliminary tests and model estimations, ensuring the robustness and accuracy of our results. This inclusion ensures that future researchers have the necessary information to replicate our approach seamlessly.
The chosen research method is the Panel Vector Autoregressive model (PVAR). The PVAR model enabled the investigation of the potential causal relationships between these variables through the application of the Granger Causality test. An impulse-response tool was also employed, with the primary focus on the interactions between CO2 emissions and the remaining independent variables. A variance decomposition tool was subsequently used to conclude the analysis.
The selection of the PVAR methodology was driven by its established capability in examining complex relationships, especially in the realms of energy, economics, and environment. Charfeddine and Kahia (Citation2019) used PVAR in their analysis of the MENA region, shedding light on its proficiency in analyzing multiple variables simultaneously and unraveling their intertwined dynamics. In a similar vein, Su and Li (Citation2023) utilised PVAR to investigate the intricate relationships in the Chinese energy sector, further reinforcing the robustness of this approach in capturing multifaceted interactions and outcomes.
To address occasional gaps in the dataset, an interpolation method was employed to approximate unknown data values. This method enables us to construct a more complete dataset, thus enhancing the robustness of the analysis and the reliability of the resultant conclusions. The importance of ensuring comprehensive data coverage in this type of economic research cannot be overstated, as it allows for a more nuanced understanding of the complex relationships among the studied variables.
The empirical analysis starts with the following long-run relationship.
(1)
(1) In this mathematical model, the term ‘CO2’ signifies carbon dioxide emissions, ‘GDP’ represents per capita income assessed at constant prices in 2010 US dollars, ‘REC’ is an abbreviation for renewable energy consumption (expressed as a percentage of total final energy consumption), and ‘TO’ refers to the measure of trade openness. The variable ‘i’ denotes the 37 OECD countries, numbered as 1, 2, 3, and so forth. The term ‘t’ symbolises the chronological sequence of years, starting from 1995 and extending through to 2020. It should be noted that in this model, all variables are incorporated in their logarithmic forms to enable the examination of proportional changes and elasticity effects.
In advancing the Panel Vector Autoregressive (PVAR) framework, the initial phase of the estimation process entails a comprehensive analysis of the data characteristics relating to stationarity across all series. The first generation of these analyses acknowledges the existence of cross-sectional independence. This is achieved by applying the panel unit root tests as proposed by scholars such as Levin, Lin, and Chu (Citation2002), Im et al. (Citation2003), Maddala and Wu (Citation1999), and Hadri (Citation2000).
It's worth noting that the Lagrange multiplier test statistic, as introduced by Breusch and Pagan (Citation1980) for cross-sectional dependence, does not possess substantial power and is not suitably centered for a fixed T. To rectify these limitations, Pesaran (Citation2004) presented a modified Lagrange multiplier, termed the Cross-Sectional Dependence Lagrange Multiplier (CDLM), for testing cross-sectional dependence.
The Cross-Sectional Dependence Lagrange Multiplier (CDLM) statistic is articulated as follows:
(2)
(2) where
refers to the product-moment correlation coefficient of the disturbances. Nonetheless, this check is likely to show evidence of considerable and significant size distortions when N is large compared with T. To deal with this issue, Pesaran (Citation2004) subsequently developed a new test for cross-sectional dependence (CD) that can be performed where N is large, and T is small. This test is based on the pairwise correlation coefficients of the OLS residuals obtained from standard augmented Dickey and Fuller (Citation1979) specifications of each variable in the panel rather than their squares utilised in the LM test. The CD statistic is derived as follows:
The parameter signifies the product-moment correlation coefficient associated with the disturbances . It's crucial to note that this particular test could exhibit considerable and significant size distortions when N is disproportionately large relative to T.
To address this potential shortcoming, Pesaran (Citation2004) later introduced a revised test for cross-sectional dependence (CD) that can be executed even when N is extensive and T is compact. Proposed test hinges upon the pairwise correlation coefficients of the OLS residuals resulting from the standard augmented Dickey and Fuller (Citation1979) specifications attributed to each variable incorporated within the panel, as opposed to their squares, which are utilised in the LM test.
The cross-sectional dependence (CD) statistic is consequently deduced as follows:
(3)
(3) The current study also employs the Granger causality test, a method used to ascertain the causal interplay among the variables under scrutiny. Granger causality, as a statistical feedback concept, has widespread utilisation in the development of predictive models (Ray Citation2012).
This methodological approach, originally introduced by Granger (Citation1969; Citation1988) seeks to determine whether the historical values of one variable are able to predict the fluctuations in another variable. Specifically, this technique measures the informational contribution of one variable in explicating the current value of another. Additionally, a variable is deemed to be Granger-caused by another factor if the former is instrumental in predicting the latter. If this is the case, it signifies that the lagged values of the predictor variable are statistically significant in elucidating the response variable (Ray Citation2012).
This technique aids in the computation of regression equations, thereby testing the causal association between two variables concurrently. Therefore, in assessing the ability of one variable, say X, to anticipate the future value of another variable, Y, a system of two equations is constructed as follows:
If causality is hypothesised to emanate from Y to X, then the Granger causality regression equations are formulated as follows:
(4)
(4) In the event that the causality runs from X to Y, then the Granger causality regression equation is:
(5)
(5) Derived from equation (4), it can be concluded that X Granger-causes Y if past values of Y can be leveraged to predict X. Furthermore, statistically, the coefficient of Yt-1, denoted as β11, is significantly different from zero as indicated by the F-test. Similarly, referring to equation (5), we can ascertain that X Granger-causes Y if the coefficient of Xt-1, denoted as β12, is statistically significant relative to zero. This signifies that preceding values of X can predict future values of Y with enhanced precision.
delineates the description and source of each pivotal variable incorporated in our study. Starting with CO2 emissions, they are quantified in metric tonnes per capita, and the data is retrieved from the OECD Data Website. Economic growth, depicted as GDP per capita in current US dollars, is sourced from World Development Indicators. Renewable energy consumption, which represents the percentage of the overall final energy consumption, also finds its data origins in the World Development Indicators. Finally, trade openness, represented as a percentage of GDP, provides insights into an economy's engagement with external trade, with data from World Development Indicators. The amalgamation of these variables enables a comprehensive exploration of the relationship between emissions, economic trajectories, renewable energy adoption, and the impact of trade dynamics.
CO2 Emissions: This variable's selection is anchored in its significance as a chief greenhouse gas, directly influencing global climate patterns. The OECD cites CO2 as the source of approximately three-quarters of all greenhouse gas emissions. Pioneering researchers like Hansen and Sato (Citation2001) have emphasised the imperative of tracking CO2 emissions for a holistic understanding of global environmental challenges.
Economic Growth: As a hallmark metric for gauging a country's economic vitality, GDP per capita is pivotal. Its correlation with environmental shifts is well-documented, with scholars like Stern (Citation2004) positing that unchecked economic growth can potentiate environmental harm.
Renewable Energy Consumption: This variable's inclusion is crucial in the backdrop of the world's growing inclination towards eco-friendly energy alternatives. Researchers like Apergis and Payne (Citation2010) have elucidated the intricate nexus between renewable energy adoption, its influence on emissions, and its consequent economic implications.
Trade Openness: In the age of rampant globalisation, comprehending the environmental footprint of trade has gained immense importance. Renowned studies, like that by Frankel and Rose (Citation2005), shed light on the multifarious environmental ramifications of heightened trade activities.
Table 1. Variables description.
These variables are not whimsical choices but are deeply embedded within the scholarly discourse pertinent to our study's focal area, facilitating a panoramic understanding of the nexus between economic endeavours, environmental repercussions, and energy paradigms.
presents descriptive statistics for four key variables: CO2 emissions, GDP, renewable energy consumption (REC), and trade openness (TO). From the table, we observe that GDP holds the highest mean, denoting a larger average return compared to the other variables, while REC records the lowest mean value. Each variable displays positive skewness, indicating an asymmetry in the distribution with longer tails to the right. This suggests a distribution that leans towards negative values in the data sets. Moreover, high kurtosis across the variables indicates a higher prevalence of extreme values or ‘fat tails’ compared to a standard normal distribution. The Jarque-Bera test results, along with the associated probability values near zero, signify a deviation from normal distribution for each variable. Correlations among variables are relatively low, suggesting that these factors do not move strictly in unison.
Table 2. Descriptive statistics.
5. Empirical results
This research commences with an inspection of cross-sectional interdependence among the variables under consideration. illustrates the outcomes of this examination, revealing the presence of cross-sectional dependence, which necessitates addressing in the analysis. As part of our comprehensive and rigorous examination of the characteristics of the variables, multiple statistical tests were performed, including the Levin, Lin, and Chu (Citation2002) test, the Im, Pesaran, and Shin (Citation2003) test, the Fisher-Augmented Dickey-Fuller (Dickey and Fuller Citation1979) test, and the Fisher-Phillips-Perron (Phillips and Perron Citation1988) test, all of which operate under the definitions outlined by Maddala and Wu (Citation1999). The purpose of employing a multitude of alternative tests was to generate robust outcomes and accommodate diverse null and alternative hypotheses.
Table 3. Cross-Section dependence test results.
However, the Levin, Lin, and Chu, as well as the Im-Pesaran-Shin tests, do not provide for cross-sectional interdependence. To address this lacuna, we utilised the Generalized Least Squares seemingly unrelated regression (GLS-SUR) method, as it is appropriate for our dataset where the number of periods under investigation (t) equals the number of cross-sections (n). Subsequently, panel unit root tests were executed on the resultant series. The results of these tests are presented in for both the level and the first difference, as well as combinations of intercept and trend. , presenting the results of the cross-section dependence tests, displays the coefficient, standard error, t-statistic, and probability for each of the variables: GDP, REC, and TO. Each variable manifests statistical significance at the 1% level (Prob. = 0.0000), signifying that they are considerably related to the dependent variable.
The comprehensive stationarity evaluation of our data is encapsulated in , which delineates the findings from an array of unit root tests, notably the Levin-Lin-Chu (LLC), Im-Pesaran-Shin (IPS), ADF-Fisher Chi-square, and PP-Fisher Chi-square tests. The LLC test adheres to the premise of a homogenous panel unit root procedure, whereas the IPS test aligns with a heterogeneous panel unit root framework as expounded by Greene (Citation2008). Upon inspection, with consideration for both cases of an intercept with and without a trend at level, it is discernible that not all variables register significance. Consequently, our study acquiesces to the null hypotheses of the unit root test for all the series under examination. Therefore, for ensuing analytical purposes, we defer to the results where the variables are integrated at the first difference. This accommodates the stipulation that all series should achieve stationarity at an identical level, a prerequisite for employing the panel VAR methodology.
Table 4. Panel unit root test results.
The Panel VAR analytical framework is subsequently applied to decipher the long-term interrelationship amongst the variables. Importantly, it is pertinent to underscore that the choice of multiple unit root tests, namely the LLC, IPS, ADF-Fisher Chi-square, and PP-Fisher Chi-square tests, bolsters the robustness of our examination of variable’s stationarity and reinforces the legitimacy of our findings. The strategy to utilise both homogeneous and heterogeneous panel unit root procedures, as depicted by the LLC and IPS tests, respectively, further augments the thoroughness of our analysis. The decision to employ variables integrated at the first difference, instead of at the level, is predicated upon the necessity for all series to achieve stationarity at the same level, which is imperative for the effective application of the panel VAR approach. Collectively, the deployment of these multiple tests and methodologies strengthens the reliability of our findings and bolsters the credibility of the conclusions drawn from our panel VAR analysis. : Panel Unit Root Test Results displays the outcomes of these tests for each variable at level and at the first difference, providing a comprehensive assessment of the variables’ stationarity. Notably, the variables exhibit significant stationarity at the first difference, thereby validating our choice of analysis level and reinforcing the robustness of our findings.
The results of a panel vector autoregression (PVAR) analysis, which controlled for fixed effects and dummy variables, are presented in . The analysis revealed that a 5% increase in renewable energy consumption and trade practices in the Organization for Economic Cooperation and Development (OECD) countries would lead to a decrease in carbon dioxide (CO2) emissions by 23% and 20%, respectively. The results also indicated that the two-year lagged value of CO2 emissions has a negative and significant impact on the current value of CO2 emissions at a 10% level. However, the gross domestic product (GDP) variables did not explain the level of CO2 emissions at both levels.
Table 5. Results of panel VAR model.
The GDP equation showed that only three variables had a significant impact on economic growth. The second lagged value of CO2 emissions and both first and second lagged values of GDP had a significance at 5% level. The estimated coefficients associated with the lagged values of CO2 and GDP were equal to −3.0, 5.6, and −3.7, respectively. These results suggest that an increase in CO2 emissions leads to a decrease in economic activities and there is a positive significant relationship between the current value of GDP and the first year lagged value, indicating efficient performance in economic activities. However, this relationship is negative for the second lagged value. Additionally, the first and second lagged values of renewable energy consumption had a negative and significant impact on GDP, indicating that a 5% increase in the consumption of renewable energy would slow down economic activities by 23% and 22%. These results provide strong evidence that both renewable energy consumption and GDP are substitutes. Furthermore, trade openness did not show any impact on GDP.
In contrast to expectations, the renewable energy equation revealed that only the first and second lagged values of renewable energy consumption had a significant impact, with no impact from the lagged values of CO2 emissions, GDP, and trade openness on renewable energy consumption. The first lagged value of renewable energy consumption had a positive and significant impact at a 5% level, indicating efficient utilisation of renewable energy in OECD countries. However, the second value of renewable energy had a negative impact at a 10% level, indicating that the energy transition agenda of OECD countries is not sufficient for attaining environmental sustainability.
The final analysis in the PVAR model focuses on the relationship between trade openness and the other variables. The results from this analysis show that the first and second lagged values of renewable energy consumption and trade openness have a significant impact on trade openness. The results indicate that the promotion of renewable energy can be increased with trade openness in the Organization for Economic Cooperation and Development (OECD) countries. Additionally, the first lag of trade openness has a positive and significant relationship at a 5% level, while the second lag negatively determines trade openness at a 10% level. Furthermore, the GDP variable has a negative and significant impact at a 5% level, indicating that an increase in economic activities results in a decreasing level of trade openness, while the relationship between trade openness and CO2 emissions is not significant.
To further understand the causal relationships among the variables, a Granger causality test was conducted and the results are presented in . The test revealed a bidirectional causality only between renewable energy consumption and GDP, implying that renewable energy consumption can considerably increase economic activities in the country and any evolution of economic activity will affect renewable energy consumption.
Table 6. Granger causality test results.
After analyzing the Granger causality relationships, the stability condition was tested and confirmed to be stable. To further analyze the two-way effects among carbon dioxide (CO2) emissions, gross domestic product (GDP), renewable energy consumption, and trade openness, an impulse-response function (IRF) analysis was applied. A crucial step in conducting the IRF analysis is selecting the appropriate order of variables. The IRFs in the panel vector autoregression (PVAR) model, developed by Love and Zicchino (Citation2006), rely on the Cholesky decomposition of the matrix of variance covariance residues to ensure the orthogonalization of shocks, as recommended by Sims (Citation1980). Sims suggests that variables that appear earlier in the order are more exogenous and influence the subsequent variables either immediately or with a lag, while variables that appear later in the framework are more endogenous and influence the previous variable only with a lag.
The analysis primarily focuses on the relationship between CO2 emissions-GDP, CO2 emissions-renewable energy consumption, and CO2 emissions-trade openness. The results, as shown in , indicate that the response of CO2 emissions to its own innovations is positive in the short-term, then decreases during the second year, reaches negative in the third year, and finally increases and becomes equal to zero in the long-run. In the case of GDP, since the PVAR results of GDP do not determine CO2 emissions, the interpretation of CO2 response to shocks in GDP should be considered carefully. The results show that the response of CO2 emissions to GDP shocks was negative initially and turns positive during the third year and equal to 0 from the fifth to tenth year. Overall, the impact of GDP on CO2 emissions is not significant and decreases quickly, implying that GDP does not make efficient contributions to the reduction of CO2 emissions in OECD countries.
Figure 1. Impulse-response graphs.
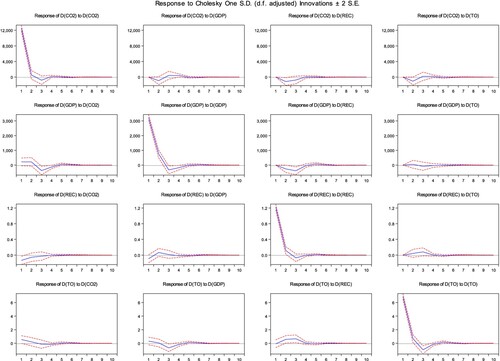
In regard to renewable energy consumption, the outcomes show that the response of CO2 emissions to a shock in renewable energy consumption was negative from the first year and dies out completely in the fourth to tenth year. The overall impact is negative, indicating that renewable energy consumption can be used as an effective tool to decrease CO2 emissions.
An important aspect of this study is variance decomposition. Variance decomposition, obtained from the moving averages of the vector autoregression (VAR) model, is a technique that provides a breakdown of the proportion of the total variance of a given variable that can be attributed to different sources of variations. This method is used to identify the relative importance of various factors driving changes in the dependent variables, including CO2 emissions, GDP, renewable energy consumption, and trade openness.
The results of the variance decomposition analysis allow us to infer the level of adjustment of the dependent variables that are due to themselves versus explanatory variables. For instance, if a large proportion of the variance in CO2 emissions is found to be due to changes in renewable energy consumption, it implies that shifts in renewable energy consumption are a major driver of changes in CO2 emissions. On the other hand, if the variance decomposition results show that most of the variance in CO2 emissions is due to other factors, such as GDP or trade openness, this would suggest that these factors are more important in explaining changes in CO2 emissions.
presents the results of the variance decomposition analysis. The results show that an interesting 98% of the variance in CO2 emissions per capita is explained by changes occurring in its own innovations. This indicates that most of the fluctuations in CO2 emissions per capita are driven by internal factors rather than external factors. The response of shocks to changes in CO2 emissions decreases to about 97% in the long-term.
Table 7. Variance decomposition.
The response of CO2 emissions to GDP is 51% and increases in the long-term to 72%. This suggests that changes in GDP have a moderate impact on CO2 emissions in the short-term and a stronger impact in the long-term. For renewable energy consumption and trade openness, the shocks are explained by 11% and 72% respectively, both variables maintain stability in the long-term. The results imply that in OECD countries, variations in CO2 innovations, GDP, and trade have a significant impact on CO2 emissions while the effect of renewable energy consumption is relatively weak compared to other variables.
The negative impact of trade openness on CO2 emissions can be attributed to the lack of policies that incorporate the reduction of emissions from carbon dioxide. These findings are consistent with other studies that have also found that economic growth, trade openness, and policies play a significant role in determining CO2 emissions.
6. Discussion
In the present study, a multi-faceted approach was adopted, encompassing both long-run coefficient tests and causality tests. This is in contrast to extant research, which typically focuses on either causality tests or long-run coefficient tests, but not both. Furthermore, the study extended the methodological framework to include the evaluation of short-run dynamics through the incorporation of a panel Vector Autoregression (VAR) model, complete with impulse-response graphs (Canova and Ciccarelli Citation2013). Within the panel VAR model, the endogeneity and interdependence of all variables are assumed, a common premise in VAR models. This particular model is advantageous as it blends the strengths of conventional VAR techniques with panel models, providing a richer set of econometric benefits. Specifically, it allows for the examination of how shocks to the system propagate over time and permits the computation of average impacts across diverse, non-homogeneous units. It also facilitates the investigation of anomalies or differences relative to mean behaviours (Canova and Ciccarelli Citation2013). To ensure the robustness of the empirical results, both fixed effect and random effect models were scrutinised. The Hausman test was deployed to guide the selection between these two models (Hausman Citation1978). The test indicated a p-value below 5%, thus leading to the rejection of the null hypothesis in favour of the alternative hypothesis. This result corroborated the appropriateness of using a fixed effect model for the panel analysis. Moreover, PVAR lag selection was conducted to identify the optimal lag length, and the results found that the second lag yielded minimum values, confirming its optimality.
The study employed a panel vector autoregression (PVAR) model to investigate the influences of economic growth, renewable energy consumption, and trade openness on carbon dioxide emissions in the countries of the Organization for Economic Cooperation and Development (OECD). Several advantages arise from the application of PVAR models over traditional VAR models. Firstly, PVAR models capitalise on the synergy of panel data and VAR methodologies, thereby augmenting the efficiency in capturing both short-term and long-term relationships among the variables in question (Schmidt-Hebbel and Mishkin Citation2007). Second, the model's capacity for impulse response analysis and variance decompositions empowers it to delineate complex interrelationships and pinpoint the dynamic responses of variables to exogenous perturbations (Schmidt-Hebbel and Mishkin Citation2007). The PVAR approach employed in this study presents a comprehensive framework for understanding the intricacies of variable interactions over time. This enables more nuanced interpretations and policy implications, thereby extending the research frontier in this domain.
In an endeavour to elucidate the intricate causal nexuses among the study's variables, a Granger causality test was executed, the outcomes of which are expounded upon in . The empirical analysis unveiled a symbiotic, bidirectional causality between renewable energy consumption and Gross Domestic Product (GDP), intimating that renewable energy consumption serves as a pivotal catalyst for bolstering economic activity within a nation. Conversely, any vicissitudes in economic performance manifest consequential effects on renewable energy consumption rates. This observation corroborates the empirical results promulgated by Kahia, Ben Jebli, and Belloumi (Citation2019), which scrutinised a cohort of 12 nations within the geographical confines of the Middle East and North Africa. Furthermore, the causality test discerned a unilateral causality emanating from GDP, renewable energy consumption, and trade openness towards CO2 emissions. Such alterations in these independent variables exert a marked and deleterious impact on CO2 emission levels. This empirical observation harmonises with extant research by Ben Mbarek, Ben Ali, and Feki (Citation2014) concerning Tunisia, Khobai and Le Roux (Citation2018) in relation to South Africa, and Ansari, Haider, and Khan (Citation2020) examining the world's most prolific CO2 emitters. Moreover, the Granger causality test unveiled a potent, unidirectional causal linkage between trade openness and GDP. This outcome underscores the preeminent role international trade fulfills in the augmentation of a country's economic prosperity, a conclusion that parallels the insights presented by Bojanic (Citation2012) in the Bolivian context. Lastly, the test furnished robust evidence supporting a unilateral causality running from renewable energy consumption to trade openness. This finding substantiates the argument that an upsurge in the demand and utilisation of renewable energy conduces to a significant and favourable impact on a country's degree of trade openness. This empirical conclusion is in concordance with the results expounded by Agyeman et al. (Citation2020) pertaining to nations grappling with elevated pollution levels.
Upon conducting a meticulous examination of Granger causality frameworks, subsequent steps were taken to ascertain the model's stability conditions, which were duly confirmed to adhere to a state of equilibrium. To delve more profoundly into the bidirectional interactions involving carbon dioxide (CO2) emissions, gross domestic product (GDP), renewable energy utilisation, and the state of trade openness, the study employed Impulse-Response Function (IRF) analyses. One salient methodological consideration in executing these IRF analyses pertains to the judicious sequencing of variables within the model. The constructed Panel Vector Autoregression (PVAR) model, which is intellectually indebted to Love and Zicchino (Citation2006), leverages the Cholesky decomposition of the variance-covariance matrix of residuals for the orthogonalization of exogenous shocks, a methodological recommendation advanced by Sims (Citation1980). Sims’ theoretical framework posits that antecedent variables in the sequence exhibit a higher degree of exogeneity and exert either immediate or lagged influences upon subsequent variables, while the latter are considered more endogenous, impacting prior variables solely with a temporal delay. Concerning the dimension of renewable energy consumption, the empirical results illuminated that the reflexive response of CO2 emissions to an unanticipated surge in renewable energy consumption manifested as negative from the inaugural year, gradually attenuating until it reaches an asymptotic nullity between the fourth and tenth year. This cumulative negative trajectory serves to substantiate the efficacy of renewable energy utilisation as a viable instrument for mitigating CO2 emissions. Such empirical outcomes resonate with extant scholarly literature, most notably with the seminal work of Charfeddine and Kahia (Citation2019), who have also corroborated the indispensable role of renewable energy in attenuating CO2 emissions. Lastly, in the context of trade openness, the study unveiled that the reactivity of CO2 emissions exhibited a negative trend for the initial triennial period, which then transitioned into a tepidly positive trajectory up until the quintennial mark, beyond which it waned into insignificance.
7. Conclusion
In synthesising the major outcomes of the present study, the focus has been on the intricate relationship between CO2 emissions, Gross Domestic Product (GDP), renewable energy consumption, and trade openness. The analysis covers 37 OECD countries over the period from 1995 to 2020 and employs a Panel Vector Autoregression (PVAR) model. The study reveals several crucial findings, most prominently the unidirectional causality that emerges from GDP, renewable energy consumption, and trade openness, all directed towards CO2 emissions. The PVAR analysis elucidates that a two-period lag in renewable energy consumption, coupled with the first lag in trade openness, exerts a statistically significant negative influence on CO2 emissions at a 5% significance level. Specifically, a marginal 5% uptick in renewable energy consumption and trade openness is associated with a 23% and 20% reduction in CO2 emissions, respectively, within the OECD countries. This suggests that existing efforts to mitigate CO2 emissions need to be supplemented by a broader set of activities. Trade openness appears as a pivotal variable that enhances renewable energy consumption across varied national scenarios. Notably, the influence of GDP on CO2 emissions was found to be insignificant, corroborating the neutrality hypothesis that neither contractionary nor expansionary policies aimed at CO2 will have a substantial impact on GDP. Weak unidirectional causality between GDP and CO2 emissions is further substantiated by Granger causality analysis.
The findings have noteworthy implications for policymakers and regulatory authorities. The study underscores the urgency for a sustainable approach to environmental governance, which should include effective administration, transparent implementation methods, and robust legal frameworks. Particularly valuable for those involved in crafting climate finance policies, these findings emphasise the necessity of fostering investment in sustainable projects. For a greener future, it is imperative for OECD countries to actively integrate renewable energy sources into their economic systems. Such investments provide an opportunity to circumvent energy systems that are geared towards high-emission models and reduce dependence on environmentally detrimental fossil fuels. Additionally, the study suggests that collective efforts are essential for minimising CO2 emissions. Specifically, governments should integrate clean technologies into trade practices to cut down on CO2 emissions. The promotion of cross-border trade is vital for the wider dissemination and adoption of renewable energy. Future research may consider dividing the countries into subsets based on their success in reducing CO2 emissions, thereby facilitating a more nuanced assessment of the primary factors that influence economic growth, renewable energy consumption, and trade openness in each subset. The inclusion of a broad spectrum of institutional and sociodemographic variables in future studies would further deepen the understanding of these complex relationships. The study enriches the current state of knowledge by providing an empirically robust examination of the interactions between economic growth, renewable energy, and environmental sustainability in OECD countries. This serves as a valuable foundation for subsequent research endeavours and policy formulations.
While the study does reveal a general trend of a significant negative impact of renewable energy consumption and trade openness on CO2 emissions, there are nuances that warrant discussion. For example, within the OECD, there may be subgroups of countries that exhibit different dynamics. Developed nations with more mature renewable energy infrastructures may experience a stronger negative impact on CO2 emissions than those still in the nascent stages of renewable energy adoption. Likewise, countries with more liberal trade policies might see a different impact on emissions compared to those with restrictive trade practices. The level of renewable energy infrastructure can also have varying effects. For instance, countries with advanced grid systems capable of efficiently distributing renewable energy may find the negative impact on CO2 emissions more pronounced than those struggling with outdated systems. Trade practices also introduce a layer of complexity. Countries heavily involved in the export or import of high-emission goods may not experience the same reduction in emissions as a result of trade openness compared to those trading in low-emission goods. These nuances provide a more complete picture and understanding of the relationships studied, and are essential for making informed policy decisions. They serve to underline that while general trends are informative, targeted approaches considering specific national contexts may be more effective in reducing emissions.
The moderate relationship between GDP and CO2 emissions in this study may be attributed to several underlying factors that add complexity to this association. The primary factor of the study is the composition of GDP itself. If a country's GDP is primarily driven by energy-intensive industries such as manufacturing or heavy-duty transportation, one might expect a stronger positive relationship between GDP and CO2 emissions. On the other hand, economies with a larger share of services or information technology sectors – which are generally less energy-intensive – may exhibit a weaker linkage between GDP and emissions. Moreover, the effectiveness of emission control policies and the adoption of energy-efficient technologies can also play crucial roles. Countries with stringent environmental regulations and higher adoption rates of renewable energy may show a less pronounced correlation between GDP growth and CO2 emissions. Therefore, the relatively moderate relationship between GDP and CO2 emissions observed in our study may be influenced by these factors, among others. This nuanced understanding helps to provide a more comprehensive picture of the dynamics at play and contributes to the rigor of our research methodology and findings.
8. Policy implication
The policy implications of the study's findings point toward several crucial gaps in the current efforts aimed at reducing CO2 emissions in OECD countries. While there has been a discernible shift towards renewable energy, the rate of transition is not sufficiently rapid to meet the urgent demands of climate change mitigation. Additionally, the role of trade openness as a conduit for the adoption and dissemination of renewable energy technologies remains underutilised in policy formulations. The economic growth paradigms also exhibit a significant deficit in their incorporation of environmental sustainability considerations. Given these limitations, a comprehensive reform of existing policies is imperative.
For immediate redress, the study proposes specific changes that include an accelerated transition to renewable energy, promotion of trade openness in renewable energy, and the integration of environmental considerations into economic policy frameworks. The accelerated transition to renewable energy could be operationalised through a policy mix of subsidies, tax breaks, and, where necessary, penalties for excessive CO2 emissions. These interventions could be financed through a combination of national budgets and international green grants. Deadlines should be set for achieving specified renewable energy targets, providing a time-bound framework within which these changes can occur. Regarding trade openness, the study recommends the negotiation of international agreements that are specifically focused on encouraging the tariff-free exchange of renewable technologies. This aspect will involve minimal costs but would require international diplomacy and political will, expenses for which can be sourced from existing budgets earmarked for foreign affairs. On the economic front, the study suggests that environmental impact assessments should be made a mandatory component of all economic planning and project evaluations. This could be implemented by strengthening existing environmental bodies, which would require only a marginal increase in funding.
The finding that GDP does not significantly explain CO2 emissions has important policy implications. It suggests that economic growth and carbon emissions are not as tightly linked as often assumed, which offers room for policymakers to strategize differently. Countries could reorient their sustainability strategies to focus more on boosting renewable energy consumption and optimising trade policies for environmental gains without hampering economic growth. By shifting towards cleaner, more sustainable practices in these areas, countries can aim to reduce their carbon footprint while still maintaining or even boosting economic activity. This finding potentially dispels the notion that economic growth must inherently come at the cost of environmental degradation, thereby opening up new avenues for policy innovation in the realm of sustainable development.
The findings suggest two main avenues for governments to effectively reduce CO2 emissions: increasing renewable energy consumption and encouraging sustainable trade practices. For renewable energy, governments can offer incentives like tax credits or subsidies for both producers and consumers of renewable energy. This will stimulate demand for renewable energy, making it more competitive against fossil fuels. Public awareness campaigns can also be crucial in shifting public opinion towards a more sustainable lifestyle. As for trade openness, it is essential to incorporate environmental clauses in trade agreements to ensure that increased trade does not result in environmental degradation. Governments could advocate for ‘Green Trade’ which emphasises trading in environmentally friendly goods and services, perhaps even offering reduced tariffs as an incentive.
The weak causality between GDP and CO2 emissions may be due to various factors such as improvements in energy efficiency, a shift towards service-based economies, or the decoupling of economic growth from carbon-intensive activities. On the other hand, the strong relationship between renewable energy consumption and reduced CO2 emissions can be attributed to the direct replacement of fossil fuels, which are the largest source of CO2 emissions. For policymakers, this disparity suggests that focusing on increasing renewable energy consumption may provide a more immediate impact on reducing CO2 emissions. It highlights the importance of directing investment and policy measures toward sustainable energy transition, such as incentivizing renewable energy projects, integrating them into the national grid, and promoting their adoption among consumers and industries. This targeted approach can enable more effective and quicker results in national and global efforts to mitigate climate change.
The key takeaway for policymakers from our study is the demonstrable impact of renewable energy consumption and trade openness on reducing CO2 emissions. Therefore, any future policy frameworks should emphasise these factors as levers for change. Our study provides empirical evidence that can be a foundation for policy arguments in favour of transitioning to renewable energy sources and promoting sustainable trade practices.
The proposed policy changes offer a twofold benefit. Policymakers stand to gain improved international standing by demonstrating a commitment to sustainable practices, which can further attract foreign investment into green technologies. For society at large, the implementation of these policies is likely to result in reduced CO2 emissions, which in turn will contribute to a healthier environment and a higher quality of life. In summary, the policy recommendations emanating from this study present a balanced, cost-effective, and actionable roadmap that addresses the lacunae in current policies. These proposals offer not just a pathway to environmental sustainability but also open avenues for socio-economic development in OECD countries.
9. Limitations and future recommendations
While the study provides valuable insights into the dynamics of CO2 emissions, renewable energy consumption, trade openness, and GDP in OECD countries, it is not without limitations. One significant constraint is the focus solely on OECD countries, which may limit the generalizability of the findings to developing or less-industrialized nations. Another limitation is the time-frame considered, spanning from 1995 to 2020, which may not fully capture more recent policy initiatives or technological advancements in renewable energy. Moreover, the study relies on existing databases for variables such as GDP, CO2 emissions, and renewable energy consumption, which may have varied levels of accuracy or may not include all relevant factors. The Panel Vector Autoregression (PVAR) model itself has limitations in assuming that all variables are endogenous, which might not account for external shocks or unforeseen policy changes. The PVAR model we used has limitations worth noting: It assumes stable, linear relationships between variables, which may not hold true in real-world settings. It assumes cross-sectional independence, meaning it overlooks interconnectedness between units like countries. Despite using lagged variables, it's not fully immune to endogeneity issues. These limitations caution the interpretation of our findings and highlight areas for future research. Lastly, the study does not incorporate sociodemographic and institutional variables, which could offer a more comprehensive understanding of the issues at hand.
Future research recommendations aim to address these limitations and extend the scope of the study. Specifically, future work could focus on:
Building Upon Specific Findings: Future research could delve deeper into the causal mechanisms that underlie the relationships between renewable energy consumption, trade openness, and CO2 emissions. Experimental designs could be employed to establish cause-and-effect relationships definitively.
Addressing Research Design Flaws: To mitigate the limitation of geographic scope, subsequent studies could include non-OECD countries to create a more global perspective. Additionally, extending the timeframe to include more recent data could capture the influence of new technological and policy developments.
Testing in New Contexts: The current framework could be applied in different geographical and cultural contexts to assess its robustness and applicability. Comparing outcomes between OECD and non-OECD countries could offer valuable insights.
Re-evaluating the Theoretical Framework: Given the limitations of the PVAR model, alternative econometric approaches could be explored to better understand the dynamics between the variables considered.
Expanding the Model: To provide a more comprehensive view, future research could incorporate additional variables like political stability, social awareness about climate change, or technological advancements in renewable energy into the existing model.
By considering these aspects, future research can build on the current study's findings to offer more comprehensive, actionable insights that can inform both practice and policy decisions effectively.
Highlights
Comprehensive PVAR Analysis: Study analyzes CO2 emissions, GDP, renewable energy, and trade openness across 37 OECD countries from 1995-2020.
Unidirectional Causality: Identifies a one-way causality from GDP, renewable energy, and trade openness to CO2 emissions.
Negative Impact on Emissions: Finds that increased renewable energy consumption and trade openness significantly reduce CO2 emissions.
Policy Urgency: Highlights the need for comprehensive and sustainable environmental governance policies.
Role of Trade and Renewable Energy: Advocates for accelerating the transition to renewable energy and promoting green trade agreements.
GDP-Decoupling: Reveals that GDP is not a significant driver of CO2 emissions, challenging traditional assumptions.
Country-Specific Dynamics: Acknowledges varying impacts of policies based on the maturity of a country's renewable energy infrastructure and trade openness.
Actionable Recommendations: Offers practical, cost-effective policy suggestions for reducing CO2 emissions.
Societal and Economic Benefits: Shows that recommended policies can attract foreign green investments and improve quality of life.
Basis for Future Research: Serves as a foundational study for subsequent research and policy formulation in environmental sustainability.
Data availability
The data will be made available from the corresponding author upon reasonable request.
Disclosure statement
No potential conflict of interest was reported by the author(s).
References
- Adebayo, T. S., D. Kirikkaleli, I. Adeshola, D. Oluwajana, G. D. Akinsola, and O. S. Osemeahon. 2021. “Coal Consumption and Environmental Sustainability in South Africa: The Role of Financial Development and Globalization.” International Journal of Renewable Energy Development 10 (3), http://ejournal.undip.ac.id/index.php/ijred.
- Afjal, M., and M. I. Ahmad. 2018. “An Efficiency Analysis of Selected Indian Oil and Gas Companies: A Window DEA Approach.” IUP Journal of Applied Economics 17 (4), https://ssrn.com/abstract = 3406642.
- Afjal, M., C. Kathiravan, L. P. Dana, and C. D. Nagarajan. 2023. “The Dynamic Impact of Financial Technology and Energy Consumption on Environmental Sustainability.” Sustainability 15 (12): 9327.
- Afjal, M., and C. S. Kavya. 2021. “Assessment of Continent-Wise Energy Efficiency Based on CO2 Emissions: A Slack-Based DEA Approach.” EPRA International Journal of Economic and Business Review 9 (10): 17–31. https://doi.org/10.36713/epra8817.
- Afjal, M., and K. Clanganthuruthil Sajeev. 2022. “Interconnection Between Cryptocurrency and Energy Market: An Analysis of Volatility Spillover.” OPEC Energy Review, https://doi.org/10.1111/opec.12227.
- Agyeman, J. K., B. Ameyaw, Y. Li, J. Appiah-Kubi, A. Annan, A. Oppong, and M. A. Twumasi. 2020. “Modeling the Long-Run Drivers of Total Renewable Energy Consumption: Evidence from Top Five Heavily Polluted Countries.” Journal of Cleaner Production 277: 123292. https://doi.org/10.1016/j.jclepro.2020.123292.
- Ahmad, A., Y. Zhao, M. Shahbaz, S. Bano, Z. Zhang, S. Wang, and Y. Liu. 2016. “Carbon Emissions, Energy Consumption and Economic Growth: An Aggregate and Disaggregate Analysis of the Indian Economy.” Energy Policy 96: 131–143. https://doi.org/10.1016/j.enpol.2016.05.032.
- Akbostancı, E., S. Turut-Asık, and G. Tunç. 2009. “The Relationship Between Income and Environment in Turkey: Is There an Environmental Kuznets Curve?” Energy Policy 37: 861–867. https://doi.org/10.1016/j.enpol.2008.09.088.
- Ansari, M. A., S. Haider, and N. A. Khan. 2020. “Does Trade Openness Affects Global Carbon Dioxide Emissions: Evidence from the top CO2 Emitters.” Management of Environmental Quality 31 (1): 32–53. https://doi.org/10.1108/MEQ-12-2018-0205.
- Apergis, N., and J. E. Payne. 2010. “Renewable Energy Consumption and Economic Growth: Evidence from a Panel of OECD Countries.” Energy Policy 38 (1): 656–660.
- Arouri, M. H., A. Ben Youssef, H. M'Henni, and C. Rault. 2012. “Energy Consumption, Economic Growth and CO2 Emissions in Middle East and North African Countries.” CESifo Group Munich, Working Paper Series 3726, https://doi.org/10.1016/j.enpol.2012.02.042.
- Bekhet, H. A., A. Matar, and T. Yasmin. 2017. “CO2 Emissions, Energy Consumption, Economic Growth, and Financial Development in GCC Countries: Dynamic Simultaneous Equation Models.” Renewable and Sustainable Energy Reviews 70: 117–132. https://doi.org/10.1016/j.rser.2016.11.089.
- Bekun, F. V., A. A. Alola, and S. A. Sarkodie. 2019. “Toward a Sustainable Environment: Nexus Between CO2 Emissions, Resource Rent, Renewable and Nonrenewable Energy in 16-EU Countries.” Science of the Total Environment 657: 1023–1029. https://doi.org/10.1016/j.scitotenv.2018.12.104.
- Ben Mbarek, M., N. Ben Ali, and R. Feki. 2014. “Causality Relationship Between CO2 Emissions, GDP and Energy Intensity in Tunisia.” Environ Dev Sustain 16: 1253–1262. https://doi.org/10.1007/s10668-014-9525-x.
- Bojanic, Antonio N. 2012. “The Impact of Financial Development and Trade on the Economic Growth of Bolivia.” Journal of Applied Economics 15 (1): 51–70. https://doi.org/10.1016/S1514-0326(12)60003-8.
- Breusch, T. S., and A. R. Pagan. 1980. “The Lagrange Multiplier Test and its Applications to Model Specification in Econometrics.” The Review of Economic Studies 47 (1): 239–253. https://doi.org/10.2307/2297111.
- Canova, F., and M. Ciccarelli. 2013. Panel Vector Autoregressive Models: A Survey⋆ The Views Expressed in This Article are Those of the Authors and do not Necessarily Reflect Those of the ECB or the Eurosystem. Emerald Group Publishing Limited. https://doi.org/10.1108/S0731-9053(2013)0000031006
- Chaabouni, S., N. Zghidi, and M. Ben Mbarek. 2016. “On the Causal Dynamics Between CO2 Emissions, Health Expenditures and Economic Growth.” Sustain. Cities Soc 22: 184–191. https://doi.org/10.1016/j.scs.2016.02.001.
- Charfeddine, L., and M. Kahia. 2019. “Impact of Renewable Energy Consumption and Financial Development on CO2 Emissions and Economic Growth in the MENA Region: A Panel Vector Autoregressive (PVAR) Analysis.” Renewable Energy 139: 198–213.
- Chebbi, H., M. Olarreaga, and H. Zitouna. 2009. “Trade Openness and CO2 Emissions in Tunisia.” ERF 16th annual conference, November 7-9, 2009. https://doi.org/10.1142/S1793812011000314
- Dehdar, F., N. Silva, J. A. Fuinhas, M. Koengkan, and N. Nazeer. 2022. “The Impact of Technology and Government Policies on OECD Carbon Dioxide Emissions.” Energies 15 (22): 8486. https://doi.org/10.3390/en15228486.
- Dickey, D. A., and W. A. Fuller. 1979. “Distribution of the Estimators for Autoregressive Time Series with a Unit Root.” Journal of the American Statistical Association 74 (366a): 427–431. https://doi.org/10.1080/01621459.1979.10482531.
- Dogan, E., and B. Turkekul. 2016. “CO2 Emissions, Real Output, Energy Consumption, Trade, Urbanization and Financial Development: Testing the EKC Hypothesis for the USA.” Environmental Science and Pollution Research 23 (2): 1203–1213. https://doi.org/10.1007/s11356-015-5323-8.
- Essandoh, O. K., M. Islam, and M. Kakinaka. 2020. “Linking International Trade and Foreign Direct Investment to CO2 Emissions: Any Differences Between Developed and Developing Countries?” Science of The Total Environment 712: 136437. https://doi.org/10.1016/j.scitotenv.2019.136437.
- Fernández-Amador, O., J. Francois, D. A. Oberdabernig, and P. Tomberger. 2017. “Carbon Dioxide Emissions and Economic Growth: An Assessment Based on Production and Consumption Emission Inventories.” Ecol. Econ. 135: 269–279. https://doi.org/10.1016/j.ecolecon.2017.01.004.
- Fodha, M., and O. Zaghdoud. 2010. “Economic Growth and Environmental Degradation in Tunisia: An Empirical Analysis of the Environmental Kuznets Curve.” Energy Policy 38: 1150–1156. https://doi.org/10.1016/j.enpol.2009.11.002.
- Frankel, J. A., and A. K. Rose. 2005. “Is Trade Good or Bad for the Environment? Sorting Out the Causality.” Review of Economics and Statistics 87 (1): 85–91.
- Granger, C. W. 1969. “Investigating Causal Relations by Econometric Models and Cross-Spectral Methods.” Econometrica: Journal of the Econometric Society, 424–438. https://doi.org/10.2307/1912791.
- Granger, C. W. 1988. “Some Recent Development in a Concept of Causality.” Journal of Econometrics 39 (1-2): 199–211. https://doi.org/10.1016/0304-4076(88)90045-0.
- Greene, W. 2008. Econometric Analysis. 6th ed. Upper Saddle River: Prentice Hill Publishing.
- Hadri, K. 2000. “Testing for Stationarity in Heterogeneous Panel Data.” The Econometrics Journal 3 (2): 148–161. https://doi.org/10.1111/1368-423X.00043.
- Hansen, J. E., and M. Sato. 2001. “Trends of Measured Climate Forcing Agents.” Proceedings of the National Academy of Sciences 98 (26): 14778–14783.
- Hausman, J. A. 1978. “Specification Tests in Econometrics.” Econometrica: Journal of the Econometric Society, 1251–1271. https://doi.org/10.2307/1913827.
- Im, Kyung So, M. Hashem Pesaran, and Yongcheol Shin. 2003. “Testing for Unit Roots in Heterogeneous Panels.” Journal of Econometrics 115 (1): 53–74. https://doi.org/10.1016/S0304-4076(03)00092-7.
- Intergovernmental Panel on Climate Change. 2018. Global warming of 1.5°C. An IPCC Special Report on the impacts of global warming of 1.5°C above pre-industrial levels and related global greenhouse gas emission pathways, in the context of strengthening the global response to the threat of climate change, sustainable development, and efforts to eradicate poverty.
- Ito, K. 2017. “CO2 Emissions, Renewable and non-Renewable Energy Consumption, and Economic Growth: Evidence from Panel Data for Developing Countries.” International Economics 151: 1–6. https://doi.org/10.1016/j.inteco.2017.02.001.
- Jayanthakumaran, K., R. Verma, and Y. Liu. 2012. “CO2 Emissions, Energy Consumption, Trade and Income: A Comparative Analysis of China and India.” Energy Policy 42: 450–460. https://doi.org/10.1016/j.enpol.2011.12.010.
- Kahia, M., M. Ben Jebli, and M. Belloumi. 2019. “Analysis of the Impact of Renewable Energy Consumption and Economic Growth on Carbon Dioxide Emissions in 12 MENA Countries.” Clean Technologies and Environmental Policy 21 (4): 871–885. https://doi.org/10.1007/s10098-019-01676-2.
- Karimi Alavijeh, N., N. Salehnia, N. Salehnia, et al. 2022. “The Effects of Agricultural Development on CO2 Emissions: Empirical Evidence from the Most Populous Developing Countries.” Environ Dev Sustain, https://doi.org/10.1007/s10668-022-02567-1.
- Kazemzadeh, E., J. A. Fuinhas, M. Koengkan, and F. Osmani. 2022. “The Heterogeneous Effect of Economic Complexity and Export Quality on the Ecological Footprint: A Two-Step Club Convergence and Panel Quantile Regression Approach.” Sustainability 14 (18): 11153. https://doi.org/10.3390/su141811153.
- Kazemzadeh, E., J. A. Fuinhas, N. Salehnia, et al. 2023. “Exploring Necessary and Sufficient Conditions for Carbon Emission Intensity: A Comparative Analysis.” Environmental Science and Pollution Research, https://doi.org/10.1007/s11356-023-29260-8.
- Khan, M. K., M. I. Khan, and M. Rehan. 2020. “The Relationship Between Energy Consumption, Economic Growth and Carbon Dioxide Emissions in Pakistan.” Financial Innovation 6: 1. https://doi.org/10.1186/s40854-019-0162-0.
- Khobai, Hlalefang, and Pierre Le Roux. 2018. “Does Renewable Energy Consumption Drive Economic Growth: Evidence from Granger-Causality Technique.” International Journal of Energy Economics and Policy, Econjournals 8 (2): 205–212. https://www.econbiz.de/ppn/1024752313.
- Koc, S., and G. C. Bulus. 2020. “Testing Validity of the EKC Hypothesis in South Korea: Role of Renewable Energy and Trade Openness.” Environmental Science and Pollution Research 27: 29043–29054. https://doi.org/10.1007/s11356-020-09172-7.
- Koengkan, M., J. A. Fuinhas, F. Osmani, E. Kazemzadeh, A. Auza, N. K. Alavijeh, and M. Teixeira. 2022. “Do Financial and Fiscal Incentive Policies Increase the Energy Efficiency Ratings in Residential Properties? A Piece of Empirical Evidence from Portugal.” Energy 241: 122895. https://doi.org/10.1016/j.energy.2021.122895.
- Koengkan, M., J. A. Fuinhas, and I. Vieira. 2023. “The Asymmetric Impact of Energy’s Paradigm Transition on Environmental Degradation: A Macroeconomic Evidence from Latin American and the Caribbean Countries.” Journal of the Knowledge Economy, https://doi.org/10.1007/s13132-023-01189-w.
- Le, T. H., Y. Chang, and D. Park. 2020. “Renewable and Nonrenewable Energy Consumption, Economic Growth, and Emissions: International Evidence.” The Energy Journal 41 (2).
- Leitão, N. C., M. Koengkan, and J. A. Fuinhas. 2022. “The Role of Intra-Industry Trade, Foreign Direct Investment, and Renewable Energy on Portuguese Carbon Dioxide Emissions.” Sustainability 14 (22): 15131. https://doi.org/10.3390/su142215131.
- Levin, A., C.-F. Lin, and C.-S. Chu. 2002. “Unit Root Tests in Panel Data:Asymptotic and Finite-Sample Properties.” Journal of Econometrics 108: 1–24. https://doi.org/10.1016/S0304-4076(01)00098-7.
- Love, I., and L. Zicchino. 2006. “Financial Development and Dynamic Investment Behavior: Evidence from Panel VAR.” The Quarterly Review of Economics and Finance 46 (2): 190–210. https://doi.org/10.1016/j.qref.2005.11.007.
- Maddala, G. S., and S. Wu. 1999. “A Comparative Study of Unit Root Tests with Panel Data and A New Simple Test.” Oxford Bulletin of Economics and Statistics 61: 631–652. https://doi.org/10.1111/1468-0084.0610s1631.
- Magazzino, C., M. Gallegati, and F. Giri. 2023. “The Environmental Kuznets Curve in a Long-Term Perspective: Parametric vs Semi-Parametric Models.” Environmental Impact Assessment Review 98: 106973.
- Magazzino, C., and M. Mele. 2022. “A New Machine Learning Algorithm to Explore the CO2 Emissions-Energy use-Economic Growth Trilemma.” Annals of Operations Research, 1–19.
- Magazzino, C., M. Mele, C. Drago, S. Kuşkaya, C. Pozzi, and U. Monarca. 2023. “The Trilemma among CO2 Emissions, Energy use, and Economic Growth in Russia.” Scientific Reports 13 (1): 10225.
- Magazzino, C., M. Mele, and N. Schneider. 2022. “A new Artificial Neural Networks Algorithm to Analyze the Nexus among Logistics Performance, Energy Demand, and Environmental Degradation.” Structural Change and Economic Dynamics 60: 315–328.
- Mele, M., C. Magazzino, N. Schneider, and F. Nicolai. 2021. “Revisiting the Dynamic Interactions Between Economic Growth and Environmental Pollution in Italy: Evidence from a Gradient Descent Algorithm.” Environmental Science and Pollution Research 28 (37): 52188–52201.
- M’henni, H. 2005. “Economic Development, Adjustment and Environmental Quality: The Case of Tunisia for a Contingent Valuation Study.” Mediterranean Journal of Economics, Agriculture and Environment. Vol.IVN.2/2005. https://mpra.ub.uni-muenchen.de/id/eprint/46192
- Moss, R. H., J. A. Edmonds, K. A. Hibbard, M. R. Manning, S. K. Rose, D. P. van Vuuren, et al. 2010. “The Next Generation of Scenarios for Climate Change Research and Assessment.” Nature 463: 747–756. https://doi.org/10.1038/nature08823.
- Musah, M., Y. Kong, I. A. Mensah, K. Li, X. V. Vo, J. Bawuah, and M. Donkor. 2021. “Trade Openness and CO2 Emanations: A Heterogeneous Analysis on the Developing Eight (D8) Countries.” Environmental Science and Pollution Research, 1–16. https://doi.org/10.1007/s11356-021-13816-7.
- Mutascu, M. 2018. “A Time-Frequency Analysis of Trade Openness and CO2 Emissions in France.” Energy Policy 115: 443–455. https://doi.org/10.1016/j.enpol.2018.01.034.
- Mutascu, M., and A. Sokic. 2020. “Trade Openness-CO 2 Emissions Nexus: A Wavelet Evidence from EU.” Environmental Modeling & Assessment, 1–18. https://doi.org/10.1007/s10666-020-09689-8.
- Narayan, P. K., B. Saboori, and A. Soleymani. 2016. “Economic Growth and Carbon Emissions.” Economic Modelling 53: 388–397. https://doi.org/10.1016/j.econmod.2015.10.027.
- Nathaniel, S. P., and C. O. Iheonu. 2019. “Carbon Dioxide Abatement in Africa: The Role of Renewable and non-Renewable Energy Consumption.” Science of the Total Environment 679: 337–345. https://doi.org/10.1016/j.scitotenv.2019.05.011.
- Nguyen, K. H., and M. Kakinaka. 2019. “Renewable Energy Consumption, Carbon Emissions, and Development Stages: Some Evidence from Panel Cointegration Analysis.” Renewable Energy 132: 1049–1057. https://doi.org/10.1016/j.renene.2018.08.069.
- Odugbesan, J. A., and H. Rjoub. 2020. Relationship Among Economic Growth, Energy Consumption, CO2 Emission, and Urbanization: Evidence from MINT Countries. SAGE Open. https://doi.org/10.1177/2158244020914648
- Olale, E., T. O. Ochuodho, V. Lantz, and J. El Armali. 2018. “The Environmental Kuznets Curve Model for Greenhouse gas Emissions in Canada.” Journal of Cleaner Production 184: 859–868. https://doi.org/10.1016/j.jclepro.2018.02.178.
- Pesaran, M. H. 2004. “Estimation and Inference in Large Heterogeneous Panels with a Multifactor Error Structure.” Cambridge working papers in economics, September. https://doi.org/10.1111/j.1468-0262.2006.00692.x
- Phillips, P. C. B., and P. Perron. 1988. “Testing for a Unit Root in Time Series Regression.” Biometrika 75 (2): 335–346. https://doi.org/10.1093/biomet/75.2.335.
- Ray, S. 2012. “Globalization and Economic Growth in India: A Granger Causality Approach.” JL Pol'y & Globalization 2: 18.
- Sajeev, K. C., and M. Afjal. 2022. “Contagion Effect of Cryptocurrency on the Securities Market: A Study of Bitcoin Volatility Using Diagonal BEKK and DCC GARCH Models.” SN Business & Economics 2: 57. https://doi.org/10.1007/s43546-022-00219-0.
- Salim, R. A., and S. Rafiq. 2012. “Why do Some Emerging Economies Proactively Accelerate the Adoption of Renewable Energy?” Energy Economics 34: 1051–1057. https://doi.org/10.1016/j.eneco.2011.08.015.
- Salman, M., X. Long, L. Dauda, C. N. Mensah, and S. Muhammad. 2019. “Different Impacts of Export and Import on Carbon Emissions Across 7 ASEAN Countries: A Panel Quantile Regression Approach.” Science of The Total Environment 686: 1019–1029. https://doi.org/10.1016/j.scitotenv.2019.06.019.
- Saudi, M. H. M., O. Sinaga, and N. H. Jabarullah. 2019. “The Role of Renewable, non-Renewable Energy Consumption and Technology Innovation in Testing Environmental Kuznets Curve in Malaysia.” International Journal of Energy Economics and Policy 9: 299–307. http://hdl.handle.net/123456789/23336.
- Schmidt-Hebbel, K., and F. S. Mishkin. 2007. Does Inflation Targeting Make a Difference? (Vol. 12876). National Bureau of Economic Research.
- Shahbaz, M., G. Gozgor, P. Adom, and S. Hammoudeh. 2019. “The Technical Decomposition of Carbon Emissions and the Concerns About FDI and Trade Openness Effects in the United States.” International Economics 159 (1): 56–73. https://doi.org/10.1016/j.inteco.2019.05.001.
- Sharif, A., O. Baris-Tuzemen, G. Uzuner, I. Ozturk, and A. Sinha. 2020. “Revisiting the Role of Renewable and non-Renewable Energy Consumption on Turkey’s Ecological Footprint: Evidence from Quantile ARDL Approach.” Sustainable Cities and Society 57: 102138. https://doi.org/10.1016/j.scs.2020.102138.
- Sims, C. A. 1980. “Macroeconomics and Reality. Econometrica, January 1980a, 1–48. Comparison of Interwar and Postwar Business Cycles: Monetarism Reconsidered.” American Economic Review, 250–57. https://ssrn.com/abstract = 262054.
- Stern, D. I.. 2004. “Economic Growth and Energy.” Encyclopedia of Energy 2 (00147): 35–51.
- Su, Y., and D. Li. 2023. “Interaction Effects of Government Subsidies, R&D Input and Innovation Performance of Chinese Energy Industry: A Panel Vector Autoregressive (PVAR) Analysis.” Technology Analysis & Strategic Management 35 (5): 493–507.
- Trivedi, J., M. Afjal, C. Spulbar, R. Birau, K. M. Inumula, and S. Pradhan. 2021. “Modeling Emerging Stock Market Volatility Using Asymmetric GARCH Family Models: An Empirical Case Study for BSE Ltd.(Formerly Known as Bombay Stock Exchange) of India.” Revista de Stiinte Politice 70: 167–176.
- Ummalla, M., and P. Goyari. 2021. “The Impact of Clean Energy Consumption on Economic Growth and CO2 Emissions in BRICS Countries: Does the Environmental Kuznets Curve Exist?” Journal of Public Affairs 21 (1): e2126. https://doi.org/10.1002/pa.2126.
- Van Vuuren, D. P., and T. R. Carter. 2014. “Climate and Socio-Economic Scenarios for Climate Change Research and Assessment: Reconciling the new with the old.” Climatic Change 122 (3): 415–429. https://doi.org/10.1007/s10584-013-0974-2.
- Wang, S. S., D. Q. Zhou, P. Zhou, and Q. W. Wang. 2011. CO2 Emissions, Energy Consumption and Economic Growth in China: A Panel Data Analysis.” Energy Policy 39 (9): 4870–4875. https://doi.org/10.1016/j.enpol.2011.06.032.
- World Bank. 2010. World Development Report 2010: Development and Climate Change. Washington, DC: WorldBank. https://openknowledge.worldbank.org/handle/10986/4387 License: CC BY 3.0 IGO.
- World Bank. 2021. Climate change and economic growth. Retrieved from https://www.worldbank.org/en/topic/climatechange/brief/climate-change-and-economic-growth.
- Zamil, A. M., M. Furqan, and H. Mahmood. 2019. “Trade Openness and CO2 Emissions Nexus in Oman.” Entrepreneurship and Sustainability Issues 7 (2): 1319. https://doi.org/10.9770/jesi.2019.7.2(36).
- Zhang, Y.-J., and Y.-B. Da. 2015. “The Decomposition of Energy-Related Carbon Emission and its Decoupling with Economic Growth in China.” Renewable and Sustainable Energy Reviews 41: 1255–1266. https://doi.org/10.1016/j.rser.2014.09.021.
- Zhang, S., X. Liu, and J. Bae. 2017. “Does Trade Openness Affect CO 2 Emissions: Evidence from ten Newly Industrialized Countries?” Environmental Science and Pollution Research 24 (21): 17616–17625. https://doi.org/10.1007/s11356-017-9392-8.
- Zhu, H., L. Duan, Y. Guo, and K. Yu. 2016. “The Effects of FDI, Economic Growth and Energy Consumption on Carbon Emissions in ASEAN-5: Evidence from Panel Quantile Regression.” Economic Modelling 58: 237–248. https://doi.org/10.1016/j.econmod.2016.05.003.