
 ?Mathematical formulae have been encoded as MathML and are displayed in this HTML version using MathJax in order to improve their display. Uncheck the box to turn MathJax off. This feature requires Javascript. Click on a formula to zoom.
ABSTRACT
This study explores how solar radiation and wind speed in La Guajira vary in response to El Niño/Southern Oscillation (ENSO) events. Climatic data were collected and analysed at three iconic locations: Upper Guajira, Middle Guajira, and Lower Guajira, over a span of three decades. The data were obtained from reliable sources such as IDEAM and NASA stations. To identify El Niño and La Niña periods, Southern Oscillation Index (ONI) data were utilised. Subsequently, the data underwent detailed statistical analyses, including hypothesis testing. During El Niño, solar radiation is altered solely in Lower Guajira; for La Niña, no significant changes in solar radiation across the region are observed. Wind speed, for the most part, remains unaffected by the studied climatic phenomena in these areas, with an exception in Middle Guajira during La Niña, where it is notably influenced.
1. Introduction
Excessive economic and population growth worldwide implies an increase in global energy consumption, exerting significant pressure on the planet's resources (Bosah et al. Citation2023; Gómez, Rodríguez, and Barranco Citation2017; Mohsin et al. Citation2022; Naseem et al. Citation2021). Currently, the escalating demand for energy worldwide is accelerating the extraction and consumption rates of non-renewable fossil fuels, as they play a greater role in the global energy matrix (IEA Citation2021; Nathan et al. Citation2018). However, it is well-known that the combustion of fossil fuels such as oil, gas, and coal releases carbon dioxide , nitrous oxide
, sulfur gases
, and water vapor
, with the majority of these pollutants being dispersed throughout the atmosphere in an equilibrium condition, generating adverse global effects (Abdullah et al. Citation2020; Cereceda-Balic et al. Citation2017; Energy Citation2019; Olale et al. Citation2018). This effect arises because
and water vapor trap energy from the sun (Carquez Citation2017; Organization Citation2016), leading to an increase in the average atmospheric temperature. Consequently, unpredictable climate variability, characterised by short periods of intense rainfall, droughts, and other climatic variations, occurs primarily due to the accumulation of these gases (Moro et al. Citation2022; Zurita, Fuentes, and Lafuente Citation2011).
Given the aforementioned circumstances, numerous researchers worldwide have explored and advocated for the use of renewable energy sources to mitigate greenhouse gas (GHG) emissions in energy generation systems (Barzegaravval et al. Citation2018). Colombia has also embraced the current energy trends and has implemented regulations, economic incentives, and tax exemptions through Law 1715 of 2014 (Colombian Renewable Energy Law) (Escobar and Ríos Citation2021; Fajardo et al. Citation2019; Saldarriaga-Loaiza, Villada, and Pérez Citation2019) to promote the adoption of renewable energies, particularly solar and wind energy. The Department of La Guajira serves as the focal point for renewable energy generation in the country (Carvajal-Romo et al. Citation2019). Furthermore, it is recognised that the power generation capacity of solar and wind plants varies across different time scales, including hours, days, seasons, intra-seasons, and inter-annual periods (Mohammadi and Goudarzi Citation2018). This variability arises due to the high sensitivity of these energy sources to factors such as the time of day, seasons, and various climatic phenomena. Consequently, understanding the relationship between the variations in wind and solar potential across different time scales is crucial for the country as it seeks to increase the penetration of renewable energy sources in the national electricity grid.
It is worth mentioning that the department of La Guajira experiences prolonged drought periods, making it one of the regions in the country most affected by this issue (Melo et al. Citation2017). Typically, droughts are evaluated using long-term averages (Mohammadi and Goudarzi Citation2018). While there is no universal definition for the beginning and end of a drought period, it is widely acknowledged that the impact intensifies with the duration of the drought, posing a serious challenge for the Colombian energy sector. The majority of the country's installed capacity relies on hydroelectric power plants, which accounted for 72% of the 84 TWh of electricity generated in Colombia in 2021 (IEA Citation2022). Consequently, the country's energy generation is heavily reliant on the availability of water resources, which is influenced by two climatic phenomena known as ‘El Niño’ (drought) and ‘La Niña’ (abundant rainfall) (Mendoza et al. Citation2018). During ‘El Niño’ events, Colombia is compelled to diversify its energy mix by incorporating Non-Conventional Renewable Energy Sources (NCREF) to reduce its dependence on hydropower (Perez and Garcia-Rendon Citation2021). In this context, photovoltaic and wind farms can play a crucial role.
Predicting drought occurrences at the seasonal or annual level is challenging due to the influence of multiple factors. In this study, the ONI was utilised to identify El Niño and La Niña periods. The ONI is an indicator used to describe the ENSO climate phenomenon based on anomalous variations in sea surface temperature (SST) in the Niño 3.4 region. This region is located in the central-eastern equatorial Pacific Ocean, spanning from 5 degrees north to 5 degrees south and from 120 degrees west to 170 degrees west (Marek et al. Citation2018). Monthly ONI values are derived by calculating a three-month moving average of SST anomalies and are published by the Climate Prediction Center (CPC) of the National Oceanic and Atmospheric Administration (NOAA) (Center Citation2022). El Niño phenomena are identified when the ONI values exceed 0.5, while La Niña phenomena are characterised by index values below . Values between
and 0.5 indicate a typical year with minimal influence from the interannual climatic phenomena of Niño/Niña.
ENSO has been the subject of extensive research due to its significant impact on global climate patterns. Scientists have identified two main types of ENSO events: Eastern Pacific (EP) El Niño and Central Pacific (CP) El Niño, also known as El Niño Modoki. In Eastern Pacific El Niño, warm sea surface temperature anomalies develop near the coast of South America, whereas in Central Pacific El Niño, these anomalies are more concentrated in the central Pacific region. Studies conducted by Yeh et al. (Citation2009) have indicated that Eastern Pacific El Niño tends to have a stronger influence on climate patterns in South America and neighbouring regions, which can lead to heavy rains and flooding in some areas, while others may experience drought conditions. On the other hand, research by Ashok et al. (Citation2007) highlighted that Central Pacific El Niño can manifest different and more complex climatic impacts, with potential effects on temperatures and precipitation in various parts of the world. Understanding these distinct types of ENSO events is crucial for predicting climate patterns and their long-term consequences. As emphasised by Cai et al. (Citation2021), the spatial distribution and intensity of sea surface temperature anomalies in the tropical Pacific play a fundamental role in the frequency and severity of extreme weather events in different regions.
The objective of this study is to investigate the impact of ENSO Modoki, using the ONI to distinguish El Niño and La Niña events, on the solar and wind potential in La Guajira department. Specifically, the correlation between global solar radiation levels and wind speed during various intensities of El Niño and La Niña events will be examined. For this analysis, three representative locations within the region were selected: Uribia, Riohacha, and Fonseca, representing the Upper, Middle, and Lower Guajira, respectively. Meteorological data from the Institute of Hydrology, Meteorology, and Environmental Studies (IDEAM) obtained through the Hydrological and Meteorological Data Management Information System (DHIME), as well as data from the National Aeronautics and Space Administration (NASA) accessed through the Data Access Viewer, were utilised. The findings of this study will be valuable for the academic community and companies exploring the possibility of generating electric energy in the department of La Guajira and integrating it into the national interconnected system (NIS). This information will enable them to prepare for future rainy and dry seasons.
2. Study area
The department of La Guajira is situated in the northernmost region of Colombia, bordering the Caribbean Sea. It is positioned between and
north latitude, and
and
west longitude, covering an area of
, which accounts for 1.8% of the national territory. The department is divided into three main regions from northeast to southwest: Upper, Middle, and Lower Guajira. In , we can observe three specific locations that represent distinct climatic conditions: Uribia, Riohacha, and Fonseca.
Figure 1. Map of La Guajira department depicting: (a) Geographical positions of the selected locations, and (b) Topography of the region.
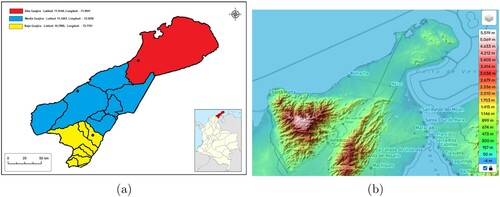
The Upper Guajira is located in the peninsular extreme and is characterised by a semi-desert environment with limited vegetation, mainly consisting of cacti, cardonales, and some mountain ranges that reach a maximum altitude of above sea level, such as Macuira, Jarará, and El Cerro de la Teta. The Middle Guajira encompasses the central part of the department and features a flat and undulating relief, with a slightly less arid climate dominated by dunes and sand formations. The Lower Guajira includes the Sierra Nevada de Santa Marta and the Montes de Oca. This region is more humid, with arable land and various thermal floors. The semi-desert plains and extensive sand dunes near the coast create a striking landscape (Carvajal-Romo et al. Citation2019; Gobernación de La Guajira Citation2020).
provides an overview of the selected locations, the corresponding zones within the department, and their respective coordinates.
Table 1. Summary of the department's zones, selected locations, and coordinates.
Each of these locations represents a distinct zone within the department, characterised by different climatic conditions influenced by their proximity to the Atlantic coast and the local physiography.
3. Data collection and analysis
Presently, a variety of meteorological databases are accessible, offering both free and paid options for visualising and acquiring meteorological data variables. For this research, the IDEAM database was accessed through DHIME, while NASA's data was obtained via the Data Access Viewer. IDEAM's database encompasses terrestrial data gathered from ground-based meteorological stations situated at specific sites, including airports and institutions. Conversely, NASA collects data on these variables utilising satellites.
The IDEAM database served as the primary source for acquiring variables such as solar radiation and wind speed for this study. However, the NASA database was used as a complementary source to fill in missing data that could not be measured by the meteorological stations during certain times or days. This limitation is one of the disadvantages of the IDEAM databases, as they may not record data for specific meteorological variables during certain periods. IDEAM attributes this issue to instrument theft, property disputes where weather stations are installed, public disturbances, instrument damage, or the absence of an observer.
In order to identify El Niño, La Niña, and typical year phenomena, the ONI was utilised. The ONI is commonly employed for this purpose and serves as a measure of the ENSO condition, including its warm (El Niño) and cold (La Niña) phases in the central equatorial Pacific. It represents the three-month moving average of sea surface temperature (SST) anomalies in the Niño 3.4 region . Consequently, ONI values equal to or above 0.5 indicate an El Niño event, values less than or equal to
indicate a La Niña event, and intermediate values indicate a typical year event, meaning the absence of these phenomena (Liyanage et al. Citation2022). Based on these ONI values, three years corresponding to El Niño, La Niña, and typical year were selected, as presented in .
Table 2. List of El Niño, La Niña, and typical year events analysed in this study.
presents the years when the phenomena occurred, as well as a typical year. The use of blue, red, and black colours helps us better understand them. For instance, the years 1999, 2000, and 2010 experienced the La Niña phenomenon, while the years 1987, 1997, and 2015 were characterised by the El Niño phenomenon. The years 1990, 2013, and 2017 had a minimal incidence of these phenomena, thus considered typical years. To complete the data for 1997 and 2010, the subsequent year was also taken into account. Using these selected years, we proceeded with the study of solar radiation and wind speed energy potential, considering the incidence of the phenomena in the designated areas specified in .
To comprehend the impacts of the phenomena's incidence on solar radiation and wind speed variables, a hypothesis test was conducted. A hypothesis is a statement regarding population parameters used to determine whether the parameter remains unchanged or has undergone a change. In this case, two hypotheses were formulated: the null hypothesis and the alternative hypothesis
. The null hypothesis examines whether a specific parameter remains constant, and it is either accepted or rejected. On the other hand, the alternative hypothesis investigates whether the parameter has changed (either increased or decreased) and is a research hypothesis that is tested using data from a random sample (Ángel Burbano Pantoja and Miranda Citation2016). To begin, the null and alternative hypotheses are established based on the hypothesis test for the difference in population means (refer to Equations (Equation1
(1)
(1) ) and (Equation2
(2)
(2) ))).
(1)
(1)
(2)
(2) The hypotheses are defined by considering the impact of the phenomena (El Niño and La Niña) on a typical year. The second step involves defining the significance level
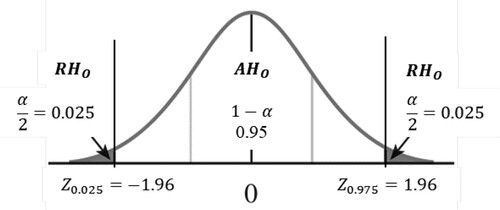
, which was set at 0.05 in this study, corresponding to a reliability level of 95%. Moving on to the third step, the direction of the test is determined based on the selected null and alternative hypotheses, and in this case, it is a bilateral direction, as depicted in .
Figure 2. Direction of the test for .
As for the fourth step, the appropriate statistical test is determined. In our specific case, since the population standard deviations are known, it can be obtained using Equation (Equation3(3)
(3) ):
(3)
(3) where,
,
, and n are the mean or average, variance and sample size of the data for the typical year and for each phenomenon, respectively.
is the calculated test statistic. Equation (Equation3
(3)
(3) ) can be simplified by taking into account Equation (Equation1
(1)
(1) ), thus it would be:
(4)
(4) Once the statistical test is calculated, it is compared with the theoretical test statistic
. The value of
, which is determined based on the hypothesis statement and significance level, was set at
(Ángel Burbano Pantoja and Miranda Citation2016). Subsequently, a decision is made regarding whether to accept or reject
. By following the aforementioned steps, we were able to determine the presence of any incidence of the phenomena (El Niño and La Niña) in the selected municipalities of La Guajira for this study, specifically in relation to the solar radiation and wind speed variables.
4. Results and discussion
The objective of this study is to investigate whether the El Niño and La Niña phenomena have an impact on a typical year in terms of solar radiation and wind speed, considering them as potential energy sources in the region of La Guajira. To achieve this, three years comprising twelve consecutive months were selected to represent La Niña, El Niño, and a typical year. The meteorological stations consulted for the analysis were Almirante Padilla Airport in Riohacha and Nazareth in Uribia. Additionally, data from the location of the FARC camp in the village of Pondores, Fonseca, were utilised. Among the total data downloaded for the chosen years, phenomena, and variables of interest, only 20% could be obtained from the IDEAM database, while the remaining data was sourced from the NASA database, incorporating the coordinates of each location.
Given the significant interest in understanding the behaviour of mean and extreme values of the studied variables in response to El Niño and La Niña events, box plots were constructed for global solar radiation and wind speed, encompassing the three zones of La Guajira across three different time periods. The analysis began with the solar radiation variable. presents the aforementioned box plots, where the Lower and Upper portions of each box represent the first and third quartiles of the variable distribution. The vertical lines extending from the boxes indicate variability beyond the interquartile range, while the endpoints of the lines represent the minimum and maximum values of the distribution. Additionally, an x denotes the mean value, and a horizontal line represents the median value within the box. It's essential to note that the first and third quartiles signify the 25th and 75th percentiles of the variable's distribution. Time series and trend lines for Upper, Lower, and Middle Guajira can be found in –, respectively. The observations indicate that the Upper Guajira zone exhibits the highest level of radiation, followed by the Middle Guajira, and finally, the Lower Guajira. This pattern aligns with the findings of Carvajal-Romo et al. (Citation2019). Overall, the entire region of La Guajira offers favourable conditions for solar energy generation, with variations likely stemming from the diverse climatic and geographical characteristics of each area.
Figure 3. Histograms of solar radiation are shown for three groups of years: La Niña (Na), El Niño (No), and a typical year (T), considering the studied areas: (a) Upper Guajira, (b) Middle Guajira, and (c) Lower Guajira.
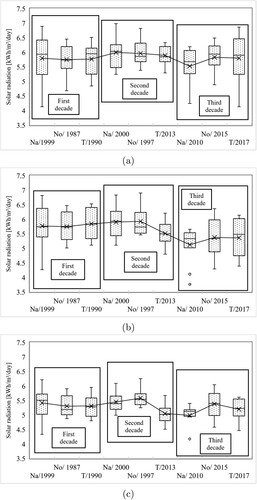
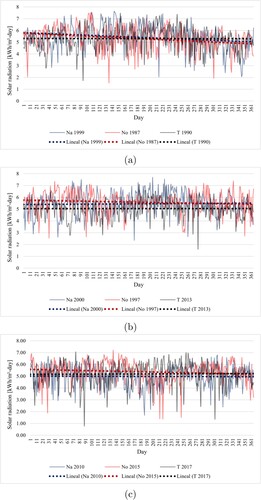
Figure A1. Time series and trend lines for the solar radiation variable are provided for La Niña (Na), El Niño (No), and a Typical Year (T) events, considering (a) the first decade, (b) the second decade, and (c) the third decade in the Upper Guajira region.
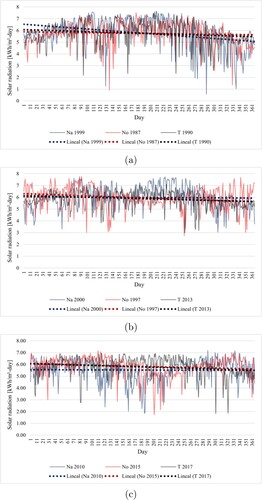
Figure A3. Time series and trend lines for the solar radiation variable are provided for La Niña (Na), El Niño (No), and a Typical Year (T) events, considering (a) the first decade, (b) the second decade, and (c) the third decade in the Lower Guajira region.
The estimation of mean solar radiation varies significantly due to the differences in climatic conditions across each analysed zone. Upon comparing this parameter among the three locations, it becomes evident that the Upper part of the department experiences the highest solar radiation values, gradually decreasing to its minimum in Lower Guajira. However, a simple inspection does not reveal significant effects of El Niño and La Niña events on solar radiation variation. Nonetheless, upon observing an increase in the disparity between the ONI during El Niño events and the years considered as Typical, a slight rise in average solar radiation levels can be observed across all the analysed areas. Thus, it is likely that the El Niño phenomenon results in an increase in solar radiation levels for all regions of La Guajira, although the intensity may vary in different locations. On the other hand, the La Niña phenomenon does not exhibit a discernible pattern in solar radiation levels across the three studied zones, displaying a random behaviour.
Analysing the dispersion of data presented in , it becomes evident that Upper Guajira exhibits a greater dispersion of solar radiation levels, while Lower Guajira displays the smallest dispersion. Generally, the occurrence of La Niña events skews the diagrams to the right in all three zones, causing the mode and median to exceed the mean for the solar radiation variable. Furthermore, a noteworthy observation is the occurrence of atypical data below the lower whisker specifically during the La Niña event in 2010, observed in Lower and Middle Guajira. This year stands out as the only instance where this phenomenon yielded a lower bias than both El Niño events and typical years in the three analysed zones.
Following the analysis of solar radiation data in the three zones of La Guajira, a hypothesis test is conducted based on Equations (Equation1(1)
(1) )–(Equation2
(2)
(2) ) and (Equation4
(4)
(4) ). This analysis takes into account the monthly solar radiation data for twelve consecutive months during El Niño, La Niña, and typical years within the study zones. The corresponding data can be found in –.
Table A1. Monthly average daily solar radiation for the three years of El Niño, La Niña, and typical year for the Upper Guajira region.
Table A3. Monthly average daily solar radiation for the three years of El Niño, La Niña, and typical year for the Lower Guajira region.
The average or arithmetic mean and variance
are calculated for –. These calculations are done with respect to each phenomenon and zone, and the results are then inserted into Equation (Equation4
(4)
(4) ). The summarised results can be found in .
Table 3. Analysis of the test statistic of the solar radiation variable for the study areas concerning the phenomena (El Niño and La Niña) and typical year.
The results presented in indicate that, in most cases, the calculated test statistic falls within the acceptance region (AHo) of the null hypothesis Ho, as it lies between and
, except for the El Niño phenomenon in Lower Guajira. Therefore, only in this specific case, the null hypothesis is rejected, providing sufficient evidence to affirm that the El Niño phenomenon does have implications on radiation levels and, consequently, the solar potential of the Lower Guajira zone. It is important to note that this region of La Guajira, located between latitudes
and
, is closest to the equator among the areas analysed (Granados, Camargo, and Caballero Citation2020). The presence of frequent cloudiness and humidity during summer significantly affects the received solar radiation. Additionally, ENSO events can further impact cloud formation by generating temperature gradients in the Pacific Ocean, leading to changes in the quantity and quality of solar radiation reaching the Earth (Mohammadi and Goudarzi Citation2018).
Another variable examined in this study is wind speed. illustrates the behaviour of the El Niño and La Niña phenomena, as well as a typical year, over three consecutive years for each phenomenon in various areas of La Guajira. The figure clearly shows that the highest wind speeds are observed in Upper Guajira, followed by Middle Guajira, and then Lower Guajira, aligning with the analysis presented in the Colombian Wind Atlas of IDEAM (Citation2015) and Carvajal-Romo et al. (Citation2019). These elevated speeds, particularly in Upper and Middle Guajira, are attributed to the region's location between the Tropic of Cancer and the Tropic of Capricorn, which subjects it to the trade winds blowing from the northeast in the northern hemisphere and from the southeast in the southern hemisphere. Additionally, the sparse vegetation and minimal surface obstructions facilitate air circulation and reduce friction with the Earth's surface. When comparing the wind speed results with those of solar radiation, noticeable differences are observed in each zone of La Guajira, with coastal areas experiencing higher wind speeds. This pattern is also evident in the time series and trend lines for Upper, Lower, and Middle Guajira, depicted in –, respectively.
Figure 4. Histograms of wind speed are generated for three groups of years in which the La Niña (Na), El Niño (No), and a typical year (T) events occurred, considering the studied zones: (a) Upper Guajira, (b) Middle Guajira. and, (c) Lower Guajira.
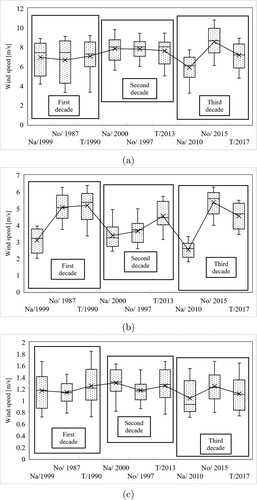
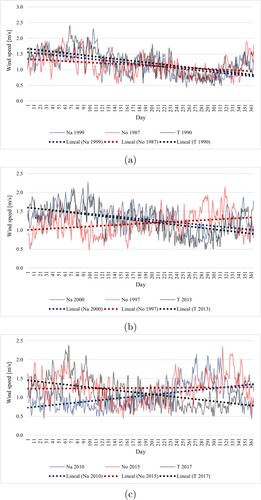
Figure A4. Time series and trend lines for the wind speed variable are presented for La Niña (Na), El Niño (No), and a Typical Year (T) events, considering (a) the first decade, (b) the second decade, and (c) the third decade in the Upper Guajira region.
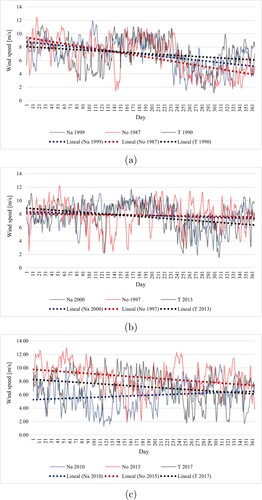
Figure A6. Time series and trend lines for the wind speed variable are presented for La Niña (Na), El Niño (No), and a Typical Year (T) events, considering (a) the first decade, (b) the second decade, and (c) the third decade in the Lower Guajira region.
On the other hand, illustrates the distribution of wind speed for each phenomenon in Pondores. In this location, 100% of the data falls between 0.5 and 2 m/s. In Nazareth, 75% of the data exceeds 6 m/s, reaching values of up to 9 m/s. In other words, the wind speed data in Lower Guajira is more concentrated compared to Upper Guajira. This indicates that Lower Guajira lacks favourable conditions for wind energy generation. Furthermore, in and (c), which depict the influence of the El Niño and La Niña phenomena, it can be observed that wind speed values, especially in Upper Guajira, are higher than those for a typical year.
After analysing the wind speed data for the three zones of La Guajira, the hypothesis test is conducted using Equations (Equation1(1)
(1) )–(Equation2
(2)
(2) ) and (Equation4
(4)
(4) ). Similar to the solar radiation analysis, the monthly wind speed data for twelve consecutive months are considered for the El Niño, La Niña, and typical year phenomena in the study zones. The corresponding data are presented in –.
Table A4. The average monthly wind speed for the Upper Guajira zone is presented for the three years of El Niño, La Niña, and a typical year.
Table A6. The average monthly wind speed for the Lower Guajira zone is presented for the three years of El Niño, La Niña, and a typical year.
The average and variance
are calculated for each phenomenon and zone, and these results are then substituted into Equation (Equation4
(4)
(4) ). The summarised results are presented in .
Table 4. The test statistic of the wind speed variable was analysed for the study areas in relation to the phenomena of El Niño, La Niña, and a typical year.
The information presented in indicates that, in most cases, the calculated test statistic falls within the acceptance region of the null hypothesis (Ho), suggesting that the results are not statistically significant and the null hypothesis cannot be rejected. However, there is one exception in the case of the La Niña phenomenon in Middle Guajira, where the test statistic value falls outside the acceptance region (AHo), providing sufficient evidence to reject the null hypothesis. In other words, there is significant evidence to support the claim that the La Niña phenomenon affects wind speed in Middle Guajira and, consequently, impacts the wind potential of this area.
The impacts of the ENSO on the variability of solar radiation and wind speed in La Guajira can be attributed to a complex interplay of mechanisms that align with the climatic disruptions caused by this phenomenon. Changes in atmospheric circulation play a pivotal role in transmitting the effects of ENSO to the La Guajira region. During El Niño episodes, the abnormal warming of waters in the central and eastern Pacific disrupts global atmospheric circulation patterns, leading to a weakening of the trade winds and adjustments in atmospheric pressure. Consequently, this alteration impacts the direction and speed of winds in La Guajira (Trenberth and Stepaniak Citation2003).
Moreover, these changes in atmospheric circulation can have an influence on moisture advection and temperature distribution, ultimately affecting cloud formation and dissipation. Cloudiness variability stands as another pertinent factor. In the midst of El Niño events, climatic patterns can result in drier and warmer conditions in La Guajira, thereby leading to an increased direct solar radiation reaching the surface. Recent research also hints at the complexity of the relationship between ENSO and cloudiness, which varies according to the event's phase (Jiménez-Muñoz et al. Citation2016). The interactions between the atmosphere and the ocean contribute further intricacy to the scenario.
ENSO is a phenomenon distinguished by anomalies in sea surface temperatures in the tropical Pacific. These anomalies can trigger adjustments in the atmosphere and changes in heat transfer between the ocean and the atmosphere. These alterations can impact atmospheric stability and humidity, consequently influencing cloud formation and solar radiation. The effects of ENSO in La Guajira are a culmination of diverse mechanisms that operate in synergy to modify atmospheric circulation, cloudiness, and interactions between the ocean and the atmosphere. A comprehensive understanding of these mechanisms is essential for forecasting and mitigating the effects of ENSO in the region.
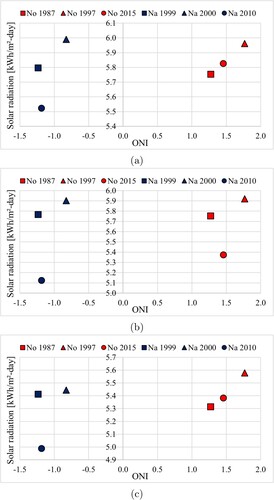
Within the scope of this study, an intriguing opportunity emerges to calculate correlations between the ONI, solar radiation, and wind speed at the three analysed locations. Such correlations could potentially unveil significant links between tropical Pacific climate patterns and key factors that influence local weather. To facilitate this comparison, the ONI, solar radiation, and wind speed values were averaged for each analysed year. Following an analysis of the correlation between ONI and solar radiation, it became evident that during El Niño events, a higher ONI corresponds to years characterised by elevated levels of solar radiation for Upper and Lower Guajira (Refer to (a,c)), while this assertion does not hold for Middle Guajira. For La Niña events, no substantial correlation was discovered between these variables.
Figure 5. Correlations between the ONI and solar radiation are examined across three distinct groups of years representing La Niña events (Na), El Niño events (No), and typical years (T). These analyses are conducted while considering the specific regions under study: (a) Upper Guajira, (b) Middle Guajira, and (c) Lower Guajira.
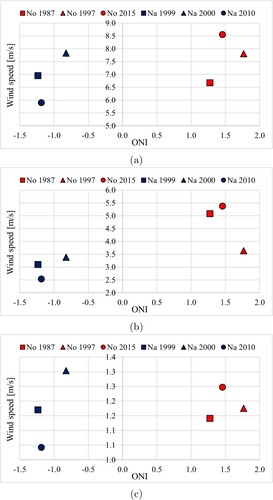
Subsequently, the correlation between the ONI and wind speed is examined (refer to ), following a similar approach as that used for solar radiation. However, no significant correlation was found between the wind speed variable and the ONI for any of the studied geographical regions.
Figure 6. Correlations between the ONI and wind speed are investigated across three distinct groups of years representing La Niña events (Na), El Niño events (No), and a typical year (T). These analyses take into consideration the studied regions: (a) Upper Guajira, (b) Middle Guajira, and (c) Lower Guajira.
5. Conclusions
Regarding solar radiation variability, the results indicate that only the El Niño phenomenon in Lower Guajira has a significant effect on the region's solar potential, while La Niña does not cause significant differences in solar radiation values in La Guajira, and El Niño does not affect Middle and Upper Guajira.
On the other hand, analysing the wind speed variable reveals that, in most cases, the climatic events studied do not significantly impact the wind potential, except for the La Niña phenomenon in Middle Guajira, where evidence suggests its implications on wind speed.
In conclusion, it is evident that El Niño and La Niña events alter the distribution of solar radiation and wind speed, particularly affecting quartiles 1 and 3, as well as the mean and Middlen. However, the influences vary depending on the specific event and geographic location within the department. This research provides valuable insights for forecasting potential changes in solar and wind power magnitudes during upcoming El Niño and La Niña events, supporting energy operators in their planning efforts.
It is important to note that this study has identified certain limitations related to the meteorological stations used as data sources. While Colombia's IDEAM provides data for various meteorological variables, such as solar radiation and wind speed, through an extensive network of stations across the country, there are two notable constraints. Firstly, the geographical coverage is not uniform, as not all areas are equipped with stations, thus narrowing the study's scope to regions with such infrastructure. Secondly, data quality also presents challenges, as some stations lack data for specific periods or have gaps in the recorded information. In response to this situation, alternative sources like satellite stations from institutions such as NASA have been employed to supplement and enhance the datasets.
Acknowledgments
The authors gratefully acknowledge the financial support provided by the Colombia Scientific Program within the framework of the call Ecosistema Científico (Contract No. FP44842- 218-2018). The authors also acknowledge Universidad de Antioquia-UdeA for the valuable economic contribution toward the development of this research through the “Sostenibilidad” program and the Universidad de La Guajira for their support in the development of this work..
Disclosure statement
No potential conflict of interest was reported by the author(s).
Additional information
Funding
References
- Abdullah, A., A. Ahmed, P. Akhter, A. Razzaq, M. Zafar, M. Hussain, N. Shahzad, et al. 2020. “Bioenergy Potential and Thermochemical Characterization of Lignocellulosic Biomass Residues Available in Pakistan.” Korean Journal of Chemical Engineering 37 (11): 1899–1906. https://doi.org/10.1007/s11814-020-0624-0.
- Ángel Burbano Pantoja, V. M., and M. A. V. Miranda. 2016. “Inferencia estadística básica: Apoyo al estudio independiente”.
- Ashok, K., S. K. Behera, S. A. Rao, H. Weng, and T. Yamagata. 2007. “El Niño Modoki and Its Possible Teleconnection.” Journal of Geophysical Research: Oceans 112 (C11). https://doi.org/10.1029/2006JC003798.
- Barzegaravval, H., S. E. Hosseini, M. A. Wahid, and A. Saat. 2018. “Effects of Fuel Composition on the Economic Performance of Biogas-based Power Generation Systems.” Applied Thermal Engineering128:1543–1554. https://doi.org/10.1016/j.applthermaleng.2017.09.109.
- Bosah, C. P., S. Li, G. K. M. Ampofo, and I. Sangare. 2023. “A Continental and Global Assessment of the Role of Energy Consumption, Total Natural Resource Rent, and Economic Growth As Determinants of Carbon Emissions.” Science of The Total Environment 892:164592 ID: 271800. https://doi.org/10.1016/j.scitotenv.2023.164592.
- Cai, W., A. Santoso, M. Collins, B. Dewitte, C. Karamperidou, J.-S. Kug, M. Lengaigne, et al. 2021. “Changing El Niño–southern Oscillation in a Warming Climate.” Nature Reviews Earth & Environment 2 (9): 628–644. https://doi.org/10.1038/s43017-021-00199-z.
- Carquez, N. R. P. 2017. “Implementación de un sistema de energía renovable alternativo para la electrificación del comando de la guardia nacional ‘escuadron montado guatopo’, ubicado en el parque nacional guatopo del estado miranda”.
- Carvajal-Romo, G., M. Valderrama-Mendoza, D. Rodríguez-Urrego, and L. Rodríguez-Urrego. 2019. “Assessment of Solar and Wind Energy Potential in La Guajira, Colombia: Current Status, and Future Prospects.” Sustainable Energy Technologies and Assessments 36:100531. https://doi.org/10.1016/j.seta.2019.100531.
- Center, N. N. W. S. C. P. 2022. “Cold and warm episodes by season”. https://origin.cpc.ncep.noaa.gov/products/analysis_monitoring/ensostuff/ONI_v5.php.
- Cereceda-Balic, F., M. Toledo, V. Vidal, F. Guerrero, L. A. Diaz-Robles, X. Petit-Breuilh, and M. Lapuerta. 2017. “Emission Factors for Pm2. 5, Co, Co2, Nox, So2 and Particle Size Distributions From the Combustion of Wood Species Using a New Controlled Combustion Chamber 3ce.” Science of the Total Environment 584:901–910. https://doi.org/10.1016/j.scitotenv.2017.01.136.
- Energy, G. 2019. Co2 status report. Paris, France: IEA (International Energy Agency).
- Escobar, S. C., and L. R. A. Ríos. 2021. “Energías renovables no convencionales en colombia y su proyección para el año 2030”.
- Fajardo, P., R. Ávila, A. J. Aristizábal, and D. Ospina. 2019. “Transition of energy policy and regulation on distributed generation (DG) in Colombia.” AIP Conf. Proc. 17 July 2019 2123 (1): 020013. https://doi.org/10.1063/1.5116940.
- Gobernación de La Guajira, . 2020. “Plan departamental de desarrollo de la guajira”. https://obsgestioneducativa.com/download/plan-de-desarrollo-departamental-la-guajira-2020-2023/.
- Gómez, Y. P. B., Y. E. D. Rodríguez, and M. B. Barranco. 2017. “Aprovechamiento Del Estiércol Caprino Como Recurso Biomásico Para La Producción De Biogás Tomando Como Referencia a La Comunidad Yutaho Ubicado En Cuatro Vías, La Guajira: Revisión.” Revista Agunkuyâa 7 (2): 5–24.
- Granados, J. D., E. O. Camargo, and J. M. M. Caballero. 2020. “Estudio tecno-económico de un sistema solar térmico de receptor central de alta complejidad tecnológica, utilizado para la generación de energía eléctrica”.
- IDEAM. 2015. “Atlas interactivo – vientos – ideam”. http://atlas.ideam.gov.co/visorAtlasVientos.html.
- IEA. 2021. “World energy outlook 2021”. https://www.iea.org/reports/world-energy-outlook-2021.
- IEA. 2022. “International energy agency colombia”. https://www.iea.org/countries/colombia.
- Jiménez-Muñoz, J. C., C. Mattar, J. Barichivich, A. Santamaría-Artigas, K. Takahashi, Y. Malhi, J. A. Sobrino, and G. van der Schrier. 2016. “Record-breaking Warming and Extreme Drought in the Amazon Rainforest During the Course of El Niño 2015–2016.” Scientific Reports 6 (1): 33130. https://doi.org/10.1038/srep33130.
- Liyanage, P., Y. Tozan, H. J. Overgaard, H. A. Tissera, and J. Rocklöv. 2022. “Effect of El Niño–southern Oscillation and Local Weather on Aedes Dvector Activity From 2010 to 2018 in Kalutara District, Sri Lanka: A Two-stage Hierarchical Analysis.” The Lancet Planetary Health 6 (7): e577–e585. https://doi.org/10.1016/S2542-5196(22)00143-7.
- Marek, G. W., R. L. Baumhardt, D. K. Brauer, P. H. Gowda, S. A. Mauget, and J. E. Moorhead. 2018. “Evaluation of the Oceanic Niño Index As a Decision Support Tool for Winter Wheat Cropping Systems in the Texas High Plains Using Swat [ID: 271304].” Computers and Electronics in Agriculture151:331–337. https://doi.org/10.1016/j.compag.2018.06.030.
- Melo, S., L. Riveros, G. Romero, A. Álvarez, C. Diaz, and S. Calderón. 2017. “Efectos Económicos De Futuras Sequías En Colombia: Estimación a Partir Del Fenómeno El Niño 2015.” Archivos De Economía 466:1–34.
- Mendoza, M. V., P. C. O. Vélez, C. M. Moncayo, and L. R. Urrego. 2018. “Photovoltaic energy in colombia: Current status of supply chain”.
- Mohammadi, K., and N. Goudarzi. 2018. “Study of Inter-correlations of Solar Radiation, Wind Speed and Precipitation Under the Influence of El Niño Southern Oscillation (enso) in California [ID: 271431].” Renewable Energy 120:190–200. https://doi.org/10.1016/j.renene.2017.12.069.
- Mohsin, M., S. Naseem, M. Sarfraz, and T. Azam. 2022. “Assessing the Effects of Fuel Energy Consumption, Foreign Direct Investment and Gdp on Co2 Emission: New Data Science Evidence From Europe & Central Asia [ID: 271496].” Fuel 314:123098. https://doi.org/10.1016/j.fuel.2021.123098.
- Moro, C., V. Francioso, M. Lopez-Arias, and M. Velay-Lizancos. 2022. “The Impact of Co2 Uptake Rate on the Environmental Performance of Cementitious Composites: A New Dynamic Global Warming Potential Analysis [ID: 271750].” Journal of Cleaner Production 375:134155. https://doi.org/10.1016/j.jclepro.2022.134155.
- Naseem, S., M. Mohsin, M. Zia-UR-Rehman, S. A. Baig, and M. Sarfraz. 2021. “The Influence of Energy Consumption and Economic Growth on Environmental Degradation in Brics Countries: An Application of the Ardl Model and Decoupling Index.” Environmental Science and Pollution Research 29 (9): 1–14.
- Nathan, G. J., M. Jafarian, B. B. Dally, W. L. Saw, P. J. Ashman, E. Hu, and A. Steinfeld. 2018. “Solar Thermal Hybrids for Combustion Power Plant: A Growing Opportunity.” Progress in Energy and Combustion Science 64:4–28. https://doi.org/10.1016/j.pecs.2017.08.002.
- Olale, E., T. O. Ochuodho, V. Lantz, and J. E. Armali. 2018. “The Environmental Kuznets Curve Model for Greenhouse Gas Emissions in Canada.” Journal of Cleaner Production 184:859–868. https://doi.org/10.1016/j.jclepro.2018.02.178.
- Organization, W. M. 2016. “Wmo greenhouse gas bulletin, no. 12: The state of greenhouse gases in the atmosphere based on global observations through 2015”.
- Perez, A., and J. J. Garcia-Rendon. 2021. “Integration of Non-conventional Renewable Energy and Spot Price of Electricity: A Counterfactual Analysis for Colombia.” Renewable Energy 167:146–161. https://doi.org/10.1016/j.renene.2017.12.069.
- Saldarriaga-Loaiza, J. D., F. Villada, and J. F. Pérez. 2019. “Análisis De Costos Nivelados De Electricidad De Plantas De Cogeneración Usando Biomasa Forestal En El Departamento De Antioquia, Colombia.” Información Tecnológica 30 (1): 63–74.
- Trenberth, K. E., and D. P. Stepaniak. 2003. “Seamless Poleward Atmospheric Energy Transports and Implications for the Hadley Circulation.” Journal of Climate 16 (22): 3706–3722. https://doi.org/10.1175/1520-0442(2003)016¡3706:SPAETA¿2.0.CO;2.
- Yeh, S.-W., J.-S. Kug, B. Dewitte, M.-H. Kwon, B. P. Kirtman, and F.-F. Jin. 2009. “El Niño in a Changing Climate.” Nature 461 (7263): 511–514. https://doi.org/10.1038/nature08316.
- Zurita, R. R., M. F. Fuentes, and R. O. Lafuente. 2011. “El Desafío De Las Energías Renovables Para Su Inserción a Mayor Escala En El Mercado Eléctrico Boliviano.” Revista Latinoamericana De Desarrollo Económico 15:167–181. https://doi.org/10.35319/lajed.201115153.
Appendix.
Figure A2. Time series and trend lines for the solar radiation variable are provided for La Niña (Na), El Niño (No), and a Typical Year (T) events, considering (a) the first decade, (b) the second decade, and (c) the third decade in the Middle Guajira region.
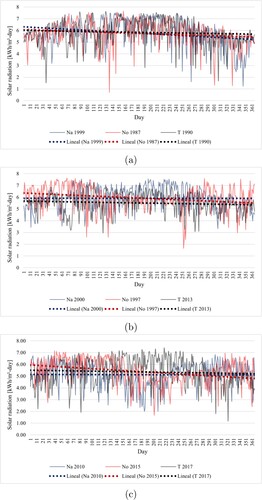
Figure A5. Time series and trend lines for the wind speed variable are presented for La Niña (Na), El Niño (No), and a Typical Year (T) events, considering (a) the first decade, (b) the second decade, and (c) the third decade in the Middle Guajira region.
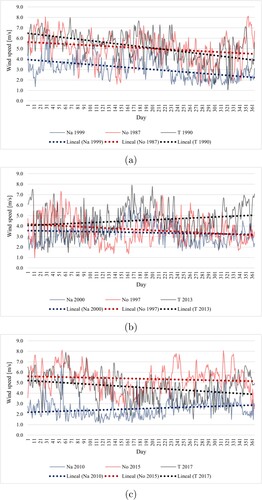
Table A2. Monthly average daily solar radiation for the three years of El Niño, La Niña, and typical year for the Middle Guajira region.
Table A5. The average monthly wind speed for the Middle Guajira zone is presented for the three years of El Niño, La Niña, and a typical year.