
 ?Mathematical formulae have been encoded as MathML and are displayed in this HTML version using MathJax in order to improve their display. Uncheck the box to turn MathJax off. This feature requires Javascript. Click on a formula to zoom.
ABSTRACT
This study investigates heat transfer in a ductile iron heat-supply pipeline and develops a mathematical model through a comparative assessment of different techniques. The goal is to accurately describe non-steady state heat transfer in buried pipelines. A high-precision model is established by considering assumptions, equations, boundary conditions, calculation domain, geometry, and grid number. Calculation time is reduced, and accuracy is improved, providing a foundation for optimizing the thermal insulation layer. ANSYS software is used to simulate and optimize the thermal insulation of the pipeline. Results show a maximum error range of 1.20% to 10.20% with consistent temperature trends, verifying the model’s accuracy. The heat-affected zone of the thermal bridge is evaluated and optimized, and preventive measures are proposed to reduce the impact of heat bridges in joint areas. The study also compares nodular cast iron pipes with conventional steel thermal pipes under the same conditions. It reveals that the economic thickness of the thermal insulation layer for nodular cast iron pipes increases from 31 mm to 39 mm due to the thermal bridge effect, which is significant.
1. Introduction
In China, cogeneration and district boilers constitute the primary heat sources for central heating, with heating capacities of up to ten million square metres (Izadi et al. Citation2023). As the size of the heat source increases, large-scale centralised heat pipe networks that utilise hot water as the heat transfer medium are employed, offering considerable heating scale and longer transmission distance (Terdtoon Citation2022). shows the relationship between the heating pipe, the heat station and the heat user.
Figure 1. Schematic of central heating system.
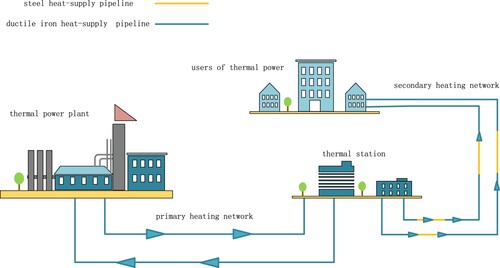
Currently, the heating radius (The pipe length from the thermal power plant to the users of thermal power) ranges from 10 to 30 km or more, with pipe diameters ranging from DN1400 to DN1600. By the end of 2016, the total mileage of China’s central heating network had reached 312,000 kilometres, with the primary network accounting for one-third, the secondary network for two-thirds, urban areas for three-quarters, and suburban and rural areas for one-quarter (Li et al. Citation2016).
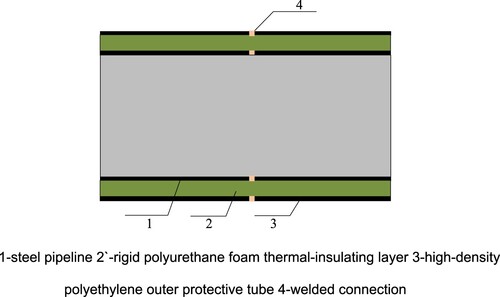
In China, directly buried prefabricated pipelines with thermal insulation are currently utilised for heat-supply pipelines in central heating systems. illustrates the basic geometry of these pipelines, which comprise (1) a working tube made of Q235, 10# (The average carbon content of steel is 10 parts per ten thousand), or 20# (The average carbon content of steel is 20 parts per ten thousand) steel. (2) rigid polyurethane foam for thermal insulation (National Rubber Sealing Product Quality Supervision and Inspection Center (Citation2020)). (3) a high-density polyethylene outer protective tube, and (4) welded connections (Liu et al. Citation2021). Among the new heating pipelines, about 90% have adopted the above structural characteristics and formed a perfect technical and design standard system (Wei Ke et al. Citation2021).
Figure 2. Directly buried steel hot water pipe.
However, this heat pipeline model has the following limitations:
Poor corrosion resistance of carbon steel pipelines: This is due to the inadequate control of dissolved oxygen concentration in the heating network water, resulting in ineffective corrosion prevention measures (Ling et al. Citation2022). Additionally, during non-heating periods, maintenance practices are not properly implemented, leading to severe inner wall corrosion.
Low construction efficiency and high labour and cost consumption: Steel pipelines are typically manually welded, which leads to slow construction progress, increased labour requirements, and higher construction costs (Qian et al. Citation2023).
Lack of adaptability at the welding interfaces: In order to compensate for the axial thermal elongation caused by temperature changes, additional measures such as the use of compensators or preheating installations are required. This not only increases the instability of the pipeline system but also adds to the overall investment required for its installation (Li and Li Citation2023).
In response to the challenges presented by the obsolete model of steel heat-supply pipelines, researchers have introduced an innovative heat-supply pipeline model (Wang et al. Citation2023). This new model is founded upon a ductile iron pipeline as its fundamental material, complemented by flexible socket connections, as shown in (a) and (b).
Figure 3. (a) Structure of directly buried ductile iron heat-supply pipeline (b) socket connection structure.
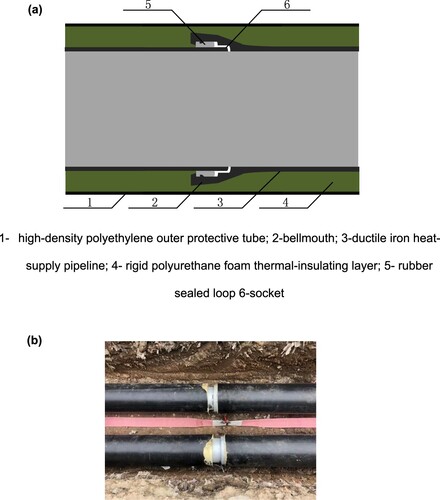
(a) represents the structure diagram of the ductile iron thermal pipe, and (b) is the actual shooting of the experiment site. Using ductile iron pipes as the heat-supply pipeline, the inner lining surface is polished to reduce roughness (epoxy heavy-duty anti-corrosion coating can be used below 60 °C), and the outer lining surface is sprayed with a metal zinc coating with a finishing layer to slow down electrochemical corrosion of the pipeline, adopt rigid polyurethane foam as the insulation layer and high-density polyethylene or glass fibre reinforced plastic as the outer protective pipe, the interface seal ring is made of modified special rubber that can withstand high temperature and aging, the connection adopts a socket type connection, which means that the socket of one pipeline is inserted into the socket of another pipeline (Valizadeh, Arman, and Ghobadian Citation2023).
The novel heat-supply pipeline model based on ductile iron pipelines and flexible socket connection possesses several noteworthy characteristics (Fan, Tariq, and Zayed Citation2022). Firstly, it has superior corrosion resistance of pipelines. Secondly, it demonstrates notable construction efficiency, superior construction quality, and cost-effectiveness. Thirdly, it can naturally compensate for axial thermal elongation, and fourthly, it exhibits a significant capacity to withstand foundation settlement.
At present, the requirements for urban heating are not only the continuous expansion of the scale but also the rationality and economy of the heating system, especially the effective utilisation rate of energy and the reliability of the heating system, so the application of ductile iron heating pipe is very important (Xu Citation2019).
However, the thermal-insulating layer of the ductile iron heat-supply pipeline faces specific challenges, particularly concerning the implementation of socket connections and the presence of bell mouth bulges. These factors may lead to uneven thermal insulating layer thickness, consequently engendering thermal bridges characterised by suboptimal thermal insulation performance (Wu et al. Citation2023). To address these challenges, It is necessary to study the heat transfer characteristics and optimisation methods of local thermal insulation weak links, which provides an important direction for the promotion of the new model of ductile iron heating pipes.
The current research on heat transfer characteristics of equal thickness insulated directly buried steel thermal pipelines is mostly based on the two-dimensional heat transfer problem. Thomtn D E analyzed and calculated the unsteady and steady-state heat transfer conditions of insulation composite pipes of equal thickness, and obtained detailed analytical solutions. Wrobel L C et al. simplified soil and pipeline into an equivalent cylinder and used the equivalent cylinder model method to study the heat transfer of equal thickness insulation composite pipeline. Fan Hong Ming et al. Used conformal transformation, separation of variables, and regional connection methods to analyze the temperature field of direct-buried insulation composite pipes of equal thickness, and obtained the solution in series form. Mathur et al. studied the heat accumulation effect of soil in the heat transfer process with numerical simulation (Mathur, Surana, and Mathur Citation2016). By using numerical simulation and experimental methods, the authors studied the influence of geometric parameters on the flow characteristics of multi-tube soil-air heat exchangers, and studied the changes in the total pressure loss of two different types of inlet and outlet forms (Amanowicz Citation2018).
Numerical simulation methods have gradually been accepted and used by more scholars, from one-dimensional or two-dimensional steady-state models to more complex three-dimensional transient models (Hu et al. Citation2023), which more accurately reflect the mutual influence of heat transfer between soil and pipeline.
Therefore, establishing a systematic analysis method system of heat transfer characteristics and improving the thermal insulation performance and economy of the whole pipeline is the fundamental theme of this study.
2. Establish of the mathematical model
2.1. Governing equation
When studying the heat transfer characteristics of the ductile iron heat pipe, the temperature field variable function φ(x,y,z) satisfies Fourier law and energy conservation theorem, and the differential equation (2-1) that should be satisfied in the rectangular coordinate system is as follows:
(1)
(1) The governing equation of heat transfer shall satisfy the following boundary conditions:
Γ1 Equations on the boundary (boundary conditions of the first kind) (2-2):
(2)
(2) Γ2 On the boundary (the second kind of boundary conditions) formula (2–3):
(3)
(3)
(4)
(4)
– Γ1 The given temperature on the boundary (K),
(Γ); Kx、Ky、Ky – Thermal conductivity along the x, y, and z directions (W/(m·K)); nx、ny、nz – The direction cosine of the outer normal along the x, y, and z directions; q – Γ2 Given heat flow on the boundary (W/m2)。
Each boundary in the region shall satisfy formula (2-5):
(5)
(5) In addition to the rectangular coordinate system described above, the analytic method also has polar coordinates or radial coordinates (Shen and Yu Citation2023). According to the different problems studied, different coordinate systems can be considered to solve them. The results are the same (Wang et al. Citation2023).
The analytical method is based on mathematical analysis to solve the thermal conductivity problem, and the solution obtained in the form of an analytic function is called analytic solution, also known as theoretical solution and strict solution (Kowtharapu et al. Citation2023). However, when the shape of the object is complex, variable, heterogeneous, or has nonlinear boundary conditions, it is difficult to solve the problem by analytical method. For nodular cast iron convex socket structure, it is more difficult, so the feasibility is not high (Kowtharapu et al. Citation2023).
3. Establishment of ANSYS Heat transfer simulation
3.1. The use process of NASYS
shows how to build a model using ANSYS.
Figure 4. Model building system diagram.
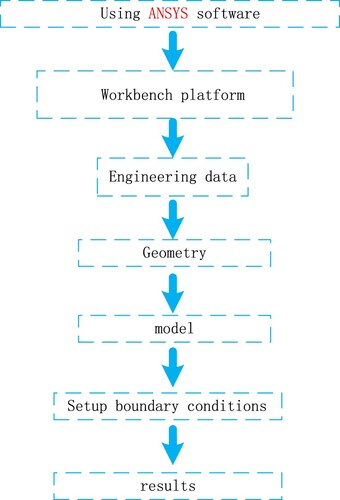
First, use the workbench platform in ANSYS (Carusotti et al. Citation2023). Then use the steady-state-thermal module in the workbench platform to build the model. Collect engineering data, establish a geometric model, divide the grid, set the boundary conditions and temperature, and finally display the temperature field results (Rajamohan et al. Citation2022).
3.2. Geometric size
The collective dimensions of the outer diameter of the ductile iron thermal pipe, the wall thickness of the working pipe, and the length and height of the convex socket are shown in and .
Figure 5. Geometrical dimensions of ductile iron pipe.
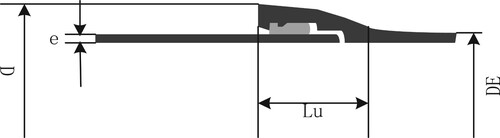
Table 1. Pipe geometry of each pipe diameter.
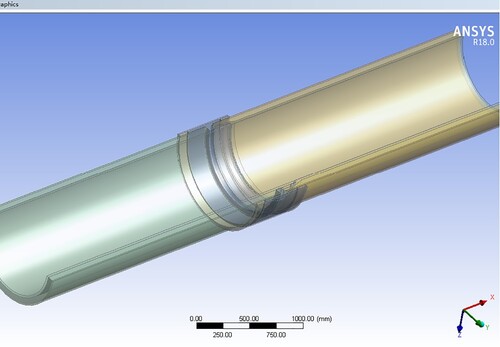
To ensure model accuracy, ANSYS is used, and a 1:1 geometric model is established using DN300 working pipeline as an example, as shown in .
Figure 6. Pipe geometry model.
is the three-dimensional model of ductile cast iron pipe established by using a workbench platform in ANSYS software. According to the actual size of ductile iron thermal pipeline engineering establishing a 1:1 geometric model can not only make the model and the actual better connection. It also lays a good foundation for better analysis of pipe thermal bridge heat transfer, and no conversion between units can greatly reduce the workload.
Figure 7. Three-dimensional model.
3.3. Assumptions
Assuming proper boundary conditions can effectively reduce the calculation workload while ensuring the accuracy of the model and correctly reflecting the heat transfer mechanism. To achieve this, the following simplifications can be made:
The soil can be considered homogeneous (Wenchao and Gao Citation2018).
The physical properties of each material layer remain invariant with variations in temperature.
It is reasonable to assume that the operational pipeline and thermal-insulating layer maintain effective contact with the outer protective tube, resulting in a negligible presence of contact thermal resistance.
The heat transfer mechanism can be simplified to encompass convective heat exchange between the hot water within the pipe and the interior wall of the operational pipeline, with no consideration for vaporisation or condensation of the hot water within the pipe.
Because the process of ductile iron pipe heat transfer only includes heat conduction and convective heat transfer, the influence of soil characteristics can be ignored. The driving force of wet migration in unsaturated soil is the total water potential, and wet migration mainly includes liquid water migration, water vapour migration, and liquid water-water vapour phase transition migration (Gupta et al. Citation2022). Among them, the amount of migration due to phase transition is very small and can be ignored. Therefore, we mainly study the migration of liquid water and soil moisture content caused by the migration of water vapour (He et al. Citation2023). However, in drier soils, wet migration is relatively small. The effect is negligible at less than 0.1% (Oosterkamp, Ytrehus, and Galtung Citation2016).
3.4. Boundary conditions
As shown in . The initial type of boundary condition establishes a constant temperature distribution along the x-axis, specifically on the surface OD. The second type of boundary condition designates surfaces AO and BD as adiabatic, while other adiabatic surfaces aligned with the y-axis maintain a consistent temperature profile, unaffected by variations in pipeline temperature. Lastly, ground surface AB, which interfaces with the atmosphere, constitutes the third type of boundary condition.
Figure 8. Boundary conditions for the heat transfer analysis of two-line heat-supply pipeline buried directly under the soil.
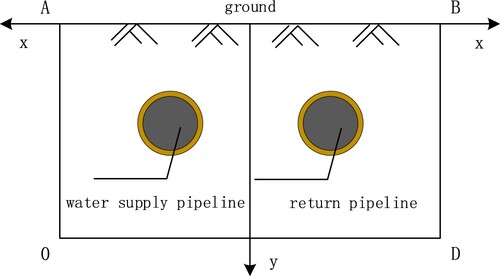
3.4.1. Determination of calculation zone (AODB rectangular zone)
Assuming the underlying soil beneath the surface to be a uniform semi-infinite plane, the temperature distribution within the soil can be described by the Fourier function in both spatial and temporal domains. Assuming that the soil is a homogeneous isotropic heat conductor, the soil temperature distribution can be regarded as a one-dimensional unsteady temperature field without an internal heat source, which can be expressed by one-dimensional transient thermal conduction differential equation (3-1):
(6)
(6) t – Soil temperature (°C);
– time (s); z – Soil depth (m); α – Thermal diffusivity (m2/s).
The periodic boundary conditions can be considered as a simple harmonic. In this way, the change of surface temperature of a semi-infinite body can be written in the form of cosine function formula (3-2):
(7)
(7)
– The excess temperature at any time on the surface of a semi-infinite object y = 0; A – Amplitude of surface temperature wave; T – Period of wave.
The formula (3-3) is obtained by applying the separation variable solution:
(8)
(8)
, Substitute into equation (2-8) to obtain the theoretical calculation model formula of soil temperature field at different depths and at different times (3-4):
(9)
(9) y – The depth of soil below the ground (m);
– Temperature calculation time (s); α – Thermal diffusion coefficient of soil; λ – Soil thermal conductivity (W/(m·°C)); p – Soil density (kg/(m3)); Cp – Specific heat of soil (J/kg·°C).
3.4.2. Determination of OD surface of constant temperature layer
The heat-supply pipeline under consideration has a diameter of DN300. According to the formulas (3-1) ∼ (3-4). Considering the thermal inertia inherent in the soil, an analytical method is applied to ascertain the temperature fluctuations within individual soil layers along the y-axis concerning the atmospheric temperature at ground level, spanning all twelve months of the year. The temperature distribution at y = 0 m represents the average atmospheric temperature in Handan for each month. When y = 10 m, the soil temperature along the x-axis can be regarded as constant, and the temperature distribution is essentially identical to that of y = 12 m. Therefore, the heat transfer in the heat-supply pipeline does not affect the temperature distribution in the soil, and the constant-temperature layer’s OD surface can be established at y = 10 m, as illustrated in .
Figure 9. (a) Layer-wise temperature distribution of soil in different months (b) Monthly distribution of temperature at different burial depths.
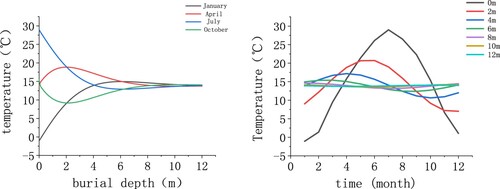
The main physical meaning represented in (a) is the variation of soil temperature with soil burial depth for the four months: 1, 4, 7, and 10. It can be observed that the temperature change remains constant regardless of the month when the burial depth reaches 12 metres. (b) The main physical meaning represented is the temperature changes at soil burial depths of 0, 2, 4, 6, 8, 10, and 12 during the 12 months of the year. It can be observed that at depths of 0, 2, 4, 6, and 8 metres, the annual temperature change differs with the depth. However, when the depth reaches 10 and 12 metres, the annual temperature change between 10 and 12 metres is essentially the same and tends to saturate. The joint findings from (a) and (b) confirm that the temperature is not affected by annual climate changes when the soil depth is 12 metres.
3.4.3. Determination of adiabatic surface AO and BD.
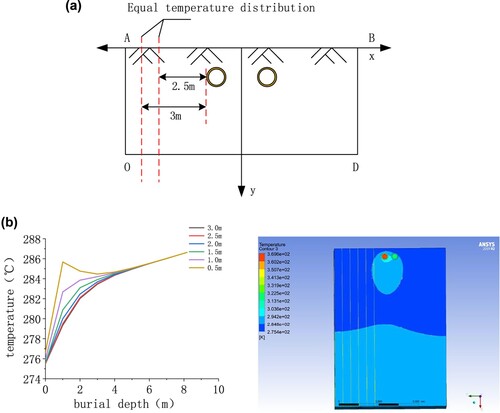
As shown in , when the temperature distribution at a distance of 2.5 and 3 m from the water supply pipeline essentially overlaps, indicating that the horizontal distribution of soil temperature is not significantly affected by the heat transfer from the heat supply pipeline, the location of the adiabatic surface AO can be determined at a distance of 2.5 m from the water supply pipeline. The return water pipe is also located at 2.5 m.
Figure 10. (a) Position diagram of adiabatic surface (b) Temperature distribution along x-axis with different burial depths; (c) simulation of temperature field in the calculation domain.
3.5. Meshing
High-quality mesh division can make the simulation results closer to the actual situation. However, the more grid units are divided, the greater the computational workload becomes. Therefore, to reduce the number of grids, mesh refinement can be applied to important areas where significant changes in velocity and temperature occur, while reducing the number of grids in other areas with less noticeable or less important changes. This approach helps to reduce the computational load while achieving the objective of accurate simulations (Xie et al. Citation2021).
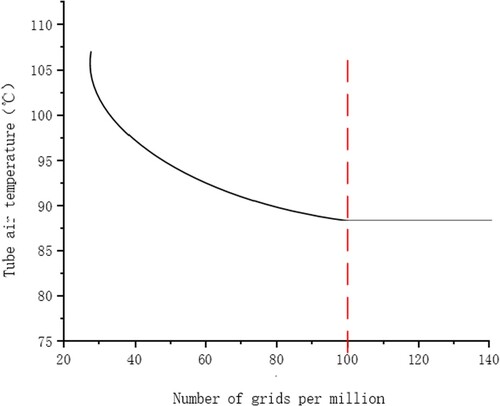
As shown in , the grid independence of the model was examined by using the air temperature 5 m from the pipeline inlet as the benchmark, and the grid dependency was investigated in the numerical simulation calculation. The calculation results are presented in the figure. As the number of grids increased, it was observed that the temperature change trend at the investigation point became gradually stable. Upon reaching one million grids, the temperature change trend showed minimal variation. Hence, it was concluded that a grid count of approximately one million was sufficient for the model.
Figure 11. Grid independence check result curve.
3.6. Generate simulation result
ANSYS software was used to establish a simulation model for the DN300 pipeline, and the heat transfer characteristics of the main body parts of the supply and return water pipelines were simulated, as shown in .
Figure 12. ANSYS simulation model of pipe main body part.

4. Temperature experiment
4.1. Experiment design
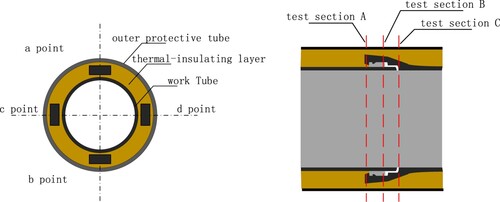
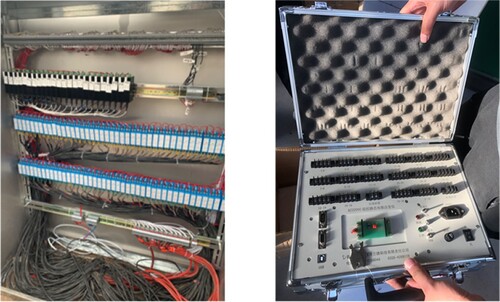
As shown in , typical testing sections were selected, and four measuring points were designated as a, b, c, and d, located at the upper, lower, left, and right positions, respectively. For each interface, three testing sections named A, B, and C were selected. To measure the temperature of the inner wall of the outer protective tube, the inner wall of the thermal-insulating layer, and the outer wall of the working tube, three temperature sensors were placed at each measuring point.
Figure 13. Testing section at the interface.
4.2. Construction of experimental platform
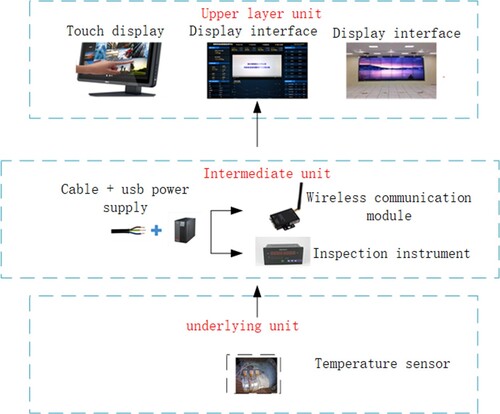
The experimental platform system is shown in :
Underlying unit: mainly includes a temperature sensor.
Intermediate layer unit: data acquisition and transmission system, mainly including field data acquisition equipment, 4G wireless transmission module, etc.
Upper layer unit: headquarters monitoring platform, mainly including cloud platform system, display terminal, etc.
Figure 14. Experimental line experimental platform.
As shown in , during the prefabrication of pipeline insulation and before the pipeline is covered with soil, all kinds of sensors are pasted on the relevant positions of the working pipe, insulation layer, and outer protective pipe in advance; Data acquisition equipment and 4G wireless transmission module are arranged on the ground near the pipeline; The measured data is remotely transmitted to the cloud platform system and display terminal through the 4G wireless transmission module (Wang et al. Citation2023).
Figure 15. Experimental data module Settings.
As shown in , the temperature sensor model PT100 is composed of a thermocouple or thermal resistance and temperature transmitter module, adopts a two-wire system, with a nonlinear correction circuit, can directly measure the temperature of liquid, gas medium, and various special media in the industrial process within the range of −200°C ∼ + 1600°C with high precision cold end compensation circuit.
Figure 16. Temperature sensor.
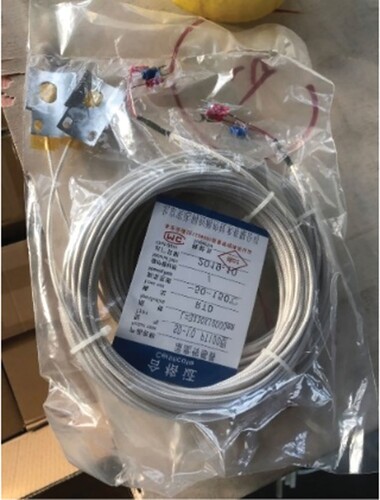
Compensation accuracy ±0.5°C in the whole temperature range;
Basic error: Class A ± 0.2% Class B ± 0.5%;
Impact of ambient temperature change: For class 0.2:0.02% F.S/C for class 0.5:0.05% F.S/ C;
Power consumption: < 0.5W Supply voltage: 14-34VDC;
Thermocouple cold end compensation error: within the operating temperature range, less than 1°C.
5. Comparison of experimental and simulation results
5.1. Method of comparison and analysis
11 specific conditions were selected in the heating season, and the corresponding water supply and return pipe temperatures are shown in .
Table 2. Temperature of water supply and return pipes under 11 specific working conditions.
The relative error Δ can be calculated by:
(10)
(10) where T is the numerical solution: numerical values simulated by ANSYS (°C), S is the experimental value: The actual values tested in the experiment (°C), and Δ is the error.
5.2. Data comparison
As shown in the relative error in temperature (Δ) for the inner wall of the outer protective tube ranges from 5.50% to 10.20%, while the relative error (Δ) for the temperature of the outer wall of the working tube ranges from 1.20% to 4.10%. For the temperature of the thermal-insulating layer, the relative error (Δ) ranges from 1.90% to 8.40%. As a result, the numerical solution obtained by ANSYS can be considered precise.
Figure 17. Temperature numerical solution and experimental value of main body of water supply pipeline.
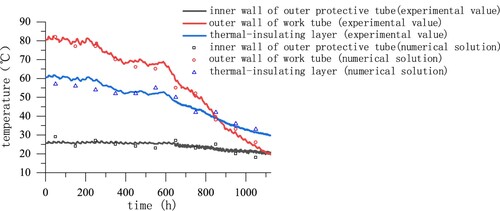
Using the ANSYS simulation model, the numerical solution of the analysis of the main body parts is basically consistent with the change law of the experimental data. Through the error calculation formula, the maximum error between the numerical solution and the experimental value is calculated to be no more than 10.2%, 4.1%, and 8.4%, which indicates that the numerical solution of each part of the pipeline can achieve engineering accuracy by using ANSYS model in this paper.
6. Thermal insulation optimisation of ductile iron heat-supply pipeline
6.1. Heat-affected zone of the novel heat-supply pipeline thermal bridge
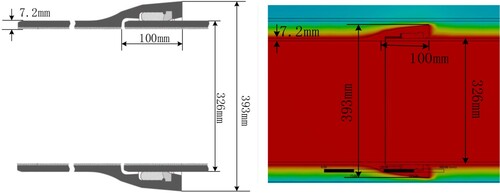
The heat-supply pipeline of interest possesses specific dimensions, including a diameter of 326 mm, a wall thickness of 7.2 mm, and an outer protective pipe wall thickness of 7 mm. This pipeline is buried at a depth of 0.5 m, maintaining a separation distance of 200 mm between the supply and return pipes. The supply water temperature is maintained at 120°C, while the return water temperature is regulated at 60°C. To illustrate, a simulation model of the pipeline’s geometry is established utilising ANSYS, with the thermal bridge unit set at 6 m, and a 40-mm thick hard polyurethane thermal-insulating layer is employed as an illustrative example in the model.
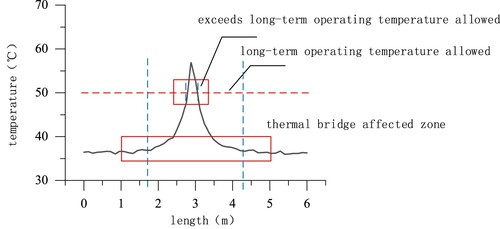
The temperature distribution of the outer protective tube for a 40-mm thick insulating layer is shown in . It is observed that the thermal-insulating layer thickness calculations of a conventional straight pipe are not applicable to ductile iron heat-supply pipelines with a bell mouth, due to the thermal bridge effect.
The outer surface temperature of the outer protection pipe of the main pipe of the pipeline is about 36.2°C, and the highest value of the outer surface temperature of the outer protection pipe at the interface of the ductile iron pipe is about 56.58°C, which corresponds to the centre of the thermal bridge. The temperature difference between the outer surface temperature of the outer protection pipe and the allowable long-term working temperature of the outer protection pipe of the straight pipe section that is not affected by the thermal bridge is about 10°C.
The thermal bridge affected area is (1.76,4.28) with a length of about 2.52 m, and the outer surface area exceeding the allowable long-term working temperature of the outer protective tube is (2.78,3.05) with a length of about 0.27 m.
Figure 18. Temperature distribution on outer wall of outer protective tube under a thermal-insulating layer thickness of 40 mm.
It is obvious that the surface temperature curve of the outer protective tube in the straight pipe section of the original thermal bridge shows a decreasing trend. In the straight pipe section without a thermal bridge, the outer surface temperature of the outer protective tube is obviously lower than the allowable long-term operating temperature of the outer protective tube. Because of the existence of a thermal bridge, the thickness of the insulation layer suitable for the conventional straight pipe section is not suitable for the new ductile iron thermal pipe with the socket.
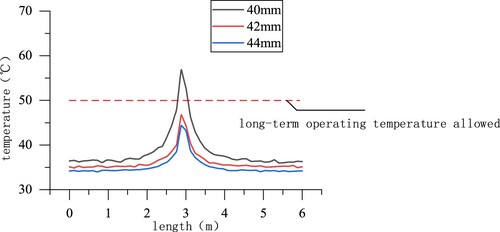
displays the temperature distribution on the outer surface of the outer protective tube DN300 at insulating layer thicknesses of 40, 42, and 44 mm.
When the thickness of the insulation layer is 40 mm, 42 mm, 44 mm, the outer surface temperature of the outer protection pipe of the main pipe is about 36.2°C, 35.12°C, 34.2°C, and the highest surface temperature of the outer protection pipe at the interface part of the ductile iron pipe is about 58.58°C, 46.76°C, 44.37°C. The temperature difference between the surface temperature of the outer protective tube and the allowable long-term working temperature of the outer protective tube is 12.38°C, 11.64°C and 10.17°C, respectively.
At 40, 42, and 44 mm, the thermal bridge affected areas are (1.76,4.28), (1.98,3.78) and (2.24,3.68), respectively, and the lengths are 2.52, 1.8, and 1.44 m, respectively. Only when the thickness is 40 mm, The outer surface area exceeding the allowable long-term operating temperature of the outer protective tube is (2.78,3.05), and the length is approximately 0.27 m.
Figure 19. Temperature distribution of outer surface of the DN300 outer protective pipe.
To sum up, the following conclusions can be drawn:
Increasing the thickness of the overall insulation layer of the pipeline leads to a significant increase in the temperature of the interface section. As a result, the area of the interface section that exceeds the allowable long-term working temperature of the outer protective pipe is significantly reduced.
To effectively reduce the peak temperature of the interface section caused by the thermal bridge effect, it is necessary to increase the thickness of the insulation layer by 2–5 mm.
6.2. Economic thickness of thermal-insulating layer of ductile iron heat-supply pipeline
To attain the highest economic efficiency, the primary objective is the minimisation of both the annual heat dissipation loss cost and the annual allocation cost associated with the thermal insulation project investment. The thickness of insulation that fulfils this condition is referred to as the economic thickness of the thermal-insulating layer. and depict the economic thickness of the thermal-insulating layer in the presence and absence of the thermal bridge effect, respectively. It is noteworthy that the economic thickness of the thermal-insulating layer is 31 and 39 mm with and without the thermal bridge effect, respectively.
Figure 20. Economic thickness of thermal-insulating layer (in absence of thermal bridge effect).
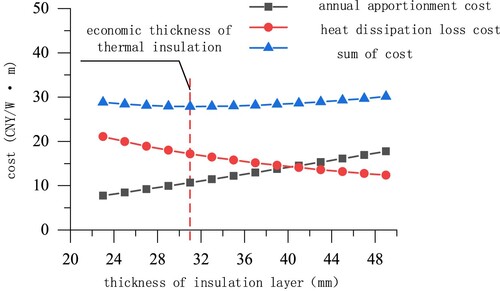
Figure 21. Economic thickness of thermal-insulating layer (in presence of thermal bridge effect).
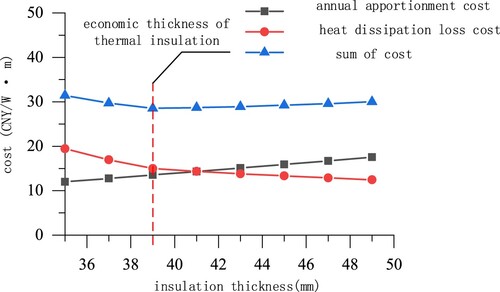
The inclusion of the thermal bridge effect leads to an increase in the economic thickness of the thermal-insulating layer from 31 mm to 39 mm.
7. Conclusion
Innovation point:
According to the problems of the old model of steel thermal pipe, a new model of ductile iron pipe with flexible socket connection is put forward. Based on the existing thermal pipeline model, the ductile iron thermal pipeline is studied. ANSYS software was used to establish a simulation model, and the heat transfer characteristics of thermal insulation weak links and thermal insulation optimisation methods were deeply studied. By establishing an experimental platform for the ductile iron thermal pipeline test line, the numerical solution of model analysis was compared with the experimental value to verify the engineering accuracy of the numerical solution.
The following conclusions are drawn:
The model is simplified by analyzing the heat transfer characteristics of the new heat pipeline and soil under certain assumptions. After analyzing the influence of soil temperature, buried depth of the pipeline and annual temperature change, the constant temperature layer 10 m from the vertical distance of the pipeline and the adiabatic surface 2.5 m from the horizontal distance of the pipeline are determined, and the calculation domain of the model is established. While keeping the ANSYS model consistent with the actual experiment, the calculation amount is greatly reduced. It lays a theoretical foundation for further research.
The grid independence check was carried out. When the number of grids was more than 1 million, the temperature change trend at the investigation point was slow, and the number of grids in the model was finally determined to be about 1 million, which greatly reduced the calculation amount of the model under the premise of ensuring the relatively accurate calculation results. It lays a certain foundation for the following simulation calculation.
The numerical solution analyzed by the ANSYS simulation model is basically consistent with the change law of the experimental value. Through the error calculation formula, the maximum error between the numerical solution and the experimental value is between 0.2% and 10.2%, and the temperature change trend of each part is basically the same, which can achieve engineering accuracy. The accuracy of the simulation model is fully demonstrated.
The thermal insulation of the pipe interface is optimised, and it is found that the peak temperature can be effectively reduced by increasing the thickness of the thermal insulation layer at the interface by 2∼5 mm, indicating that the heat dissipation at the interface can be optimised by increasing the overall insulation thickness suitably. It provides a feasible scheme for optimising the heat dissipation of ductile iron pipes.
Under the same conditions, the economic thickness of the insulation layer with thermal bridge effect of DN300 ductile iron pipe moves to the right, from the original 31 mm to 39 mm, an increase of 8 mm. Its impact cannot be ignored.
Limitations:
The specific implementation plan needs further refinement and improvement in engineering practice. For the simulation model built using ANSYS software, there is a potential for further refinement of its boundary conditions. Additionally, there is a need for further research and exploration regarding the optimisation design of other components such as ductile iron tees and elbows in the heat pipeline system.
Disclosure statement
No potential conflict of interest was reported by the author(s).
Correction Statement
This article has been corrected with minor changes. These changes do not impact the academic content of the article.
References
- Amanowicz, Łukasz. 2018. “Influence of Geometrical Parameters on the Flow Characteristics of Multi-Pipe Earth-to-Air Heat Exchangers – Experimental and CFD Investigations.” Applied Energy 226: 849–861. https://doi.org/10.1016/j.apenergy.2018.05.096.
- Carusotti, S., R. Lombroni, P. Fanelli, L. Jackson, F. Giorgetti, P. F. Buxton, G. Calabrò, M. Romanelli, and E. R. de Villa Valdes. 2023. “Structural Behaviour Characterization of ST40 Inner Vacuum Chamber (IVC2) During a Plasma VDE Using ANSYS Workbench.” Fusion Engineering and Design 192: 113772. https://doi.org/10.1016/j.fusengdes.2023.113772.
- Fan, H., S. Tariq, and T. Zayed. 2022. “Acoustic Leak Detection Approaches for Water Pipelines.” Automation in Construction 138: 104226. https://doi.org/10.1016/j.autcon.2022.104226.
- Gupta, R., B. Lukić, A. Tengattini, F. Dufour, and M. Briffaut. 2022. “Experimental Characterisation of Transient Condensed Water Vapour Migration Through Cracked Concrete as Revealed by Neutron and x-ray Imaging: Effect of Initial Saturation.” Cement and Concrete Research 162: 106987. https://doi.org/10.1016/j.cemconres.2022.106987.
- He, T., J. Hu, Y. Luo, P. Zhu, S. Cai, Y. Wang, H. Hou, G. Zou, and X. Ji. 2023. “Dual-Vapour-Thermal Engineering Evoking Bound Water Pathways of Vanadium Oxide for High-Rate and Durable Zinc-ion Storage.” Chemical Engineering Journal 471: 144739. https://doi.org/10.1016/j.cej.2023.144739.
- Hu, P., S. Geng, X. Liu, C. Li, R. Zhu, and X. He. 2023. “A Three-Dimensional Numerical Pressure Transient Analysis Model for Fractured Horizontal Wells in Shale gas Reservoirs.” Journal of Hydrology 620: 129545. https://doi.org/10.1016/j.jhydrol.2023.129545.
- Izadi, M., S. F. Taghavi, S. H. N. Safavi, F. Afsharpanah, and W. Yaïci. 2023. “Thermal Management of Shelter Building Walls by PCM Macro-Encapsulation in Commercial Hollow Bricks.” Case Studies in Thermal Engineering 47: 103081.
- Kowtharapu, L. P., N. K. Katari, S. K. Muchakayala, and V. M. Marisetti. 2023. “Green Metric Tools for Analytical Methods Assessment Critical Review, Case Studies and Crucify.” TrAC Trends in Analytical Chemistry 166: 117196. https://doi.org/10.1016/j.trac.2023.117196.
- Kowtharapu, L. P., N. K. Katari, S. K. Muchakayala, S. P. R. Pydimarry, V. K. Rekulapally, and C. A. Sandoval. 2023. “QbD Green Analytical Procedure for Novel Study of a Genotoxic and Carcinogenic Compound Trace Determination in Physiological Solution Compatibility.” Sustainable Chemistry and Pharmacy 33: 101079. https://doi.org/10.1016/j.scp.2023.101079.
- Li, Y., S. Chang, L. Fu, and S. Zhang. 2016. “A Technology Review on Recovering Waste Heat from the Condensers of Large Turbine Units in China.” Renewable and Sustainable Energy Reviews 58: 287–296. https://doi.org/10.1016/j.rser.2015.12.059.
- Li, C., and J. Li. 2023. “Thermal Characteristics of a Flat Plate Pulsating Heat Pipe Module for Onsite Cooling of High Power Server CPUs.” Thermal Science and Engineering Progress 37: 101542. https://doi.org/10.1016/j.tsep.2022.101542.
- Ling, Y., X. She, X. Zhang, T. Chen, X. Lin, and J. Feng. 2022. “A PCM-Based Thermal Management System Combining Three-Dimensional Pulsating Heat Pipe with Forcedair Cooling.” Applied Thermal Engineering 213: 118732. https://doi.org/10.1016/j.applthermaleng.2022.118732.
- Liu, Wei Na, et al. 2021. “Urban Water Plant Expansion Project in Gu’an County: Study on the Construction Scheme for the Installation of Nodular Cast Iron Pipe Outside the Source Pipe.” Hebei Water Conservancy 5: 46–47.
- Mathur, A., A. K. Surana, and S. Mathur. 2016. “Numerical Investigation of the Performance and Soil Temperature Recovery of an EATHE System Under Intermittent Operations.” Renewable Energy 95: 510–521. https://doi.org/10.1016/j.renene.2016.04.037.
- National Rubber Sealing Product Quality Supervision and Inspection Center. 2020. Heat-Resistant Rubber for Thermal PipelinesRubber Inspection Report. Shaanxi: National Quality Supervision and Inspection of Rubber Sealing ProductsHeart.
- Oosterkamp, A., T. Ytrehus, and S. T. Galtung. 2016. “Effect of the Choice of Boundary Conditions on Modelling Ambient to Soil Heat Transfer Near a Buried Pipeline.” Applied Thermal Engineering 100: 367–377.
- Qian, N., F. Jiang, M. Marengo, J. Chen, Y. Fu, J. Zhang, and J. Xu. 2023. “Start-up Behavior of Oscillating Heat Pipe in Grinding Wheel Under Axial-Rotation Conditions.” Applied Thermal Engineering 219: 119443. https://doi.org/10.1016/j.applthermaleng.2022.119443.
- Rajamohan, S., A. Vinod, M. P. V. S. Aditya, H. G. Vadivudaiyanayaki, M. Arıcı, S. Nižetić, T. T. Le, R. Hidayat, and D. T. Nguyen. 2022. “Approaches in Performance and Structural Analysis of Wind Turbines – A Review.” Sustainable Energy Technologies and Assessments 53: 102570. https://doi.org/10.1016/j.seta.2022.102570.
- Shen, J., and H. Yu. 2023. “Radial Quadrature Method for Evaluating the Beam Shape Coefficients in Spherical Coordinates.” Journal of Quantitative Spectroscopy and Radiative Transfer 305: 108627. https://doi.org/10.1016/j.jqsrt.2023.108627.
- Terdtoon, P. 2022. “Thermal Performance of Various Adiabatic Section Lengths of Closed-Loop Pulsating Heat Pipe Designed for Energy Recovery Applications.” Energy Reports 8: 731–737. https://doi.org/10.1016/j.egyr.2022.10.149.
- Valizadeh, R., A. Arman, and R. Ghobadian. 2023. “The Effect of the Pipe Angle and Protective Inclined Apron on the Scouring and Sedimentation Pattern Around a Semi-Buried Pipe in a 90° Mild Bend.” Ocean Engineering 286: 115711. https://doi.org/10.1016/j.oceaneng.2023.115711.
- Wang, R., W. Cao, S. Wu, M. Jia, and X. Wang. 2023. “Optical Character Correction of Large-Curvature Annular Sector Text in Polar Coordinate System.” Pattern Recognition Letters 167: 157–163. https://doi.org/10.1016/j.patrec.2023.02.013.
- Wang, G., C. Cong, X. Zheng, H. Li, F. Jiang, X. Wang, R. Li, et al. 2023. “Alignment of Fe3O4/CNT Electrodes via Magnetic Blade Printing for Wireless Stress-Direction-Recognizing Strain Sensor.” Chemical Engineering Journal 474: 145825. https://doi.org/10.1016/j.cej.2023.145825.
- Wang, W., H. Yang, H. Zhang, T. Xu, F. Zhao, and S. Wu. 2023. “Pulsating Heat Pipe and Thermo-Electric Generator Jointly Applied in Renewable Energy Exploitation: Analytical and Experimental Investigations.” Energy 263: 125573. https://doi.org/10.1016/j.energy.2022.125573.
- Wei Ke, Li, et al. 2021. “Discussion on the Construction Technology of DN1000 Ductile Cast Iron Pipe for Dragging Pipeline in Shanghai Beiheng River.” Engineering Technology Research 6 (17): 18–20.
- Wenchao, Zu, and Yanan Gao. 2018. “Building Thermal Energy.” Ventilation and Air Conditioning 37 (01): 71–74.
- Wu, Q., Z. Chen, Y. Ding, L. Yin, M. Yang, D. E. Erişen, T. Liu, M. Li, L. Yang, and S. Cui. 2023. “A Flexible Double Network Aerogel Reinforced by SiO2/ZrO2 Fibers Paper with Excellent Thermal Insulation at High-Temperature.” Ceramics International. https://doi.org/10.1016/j.ceramint.2023.09.283.
- Xie, K., Y. Jin, Y. Peng, G. Liu, and B. Wan. 2021. “Research on High Quality Mesh Method of Armored Umbilical Cable for Deep sea Equipment.” Ocean Engineering 221: 108550. https://doi.org/10.1016/j.oceaneng.2020.108550.
- Xu, Hong. 2019. “Analysis of Current Energy Consumption and Energy-Saving Technology of Central Heating.” Petrochemical Technology 26 (10): 221–223.