
 ?Mathematical formulae have been encoded as MathML and are displayed in this HTML version using MathJax in order to improve their display. Uncheck the box to turn MathJax off. This feature requires Javascript. Click on a formula to zoom.
ABSTRACT
This study addresses the challenge of decarbonizing India's transportation and power sectors, which jointly contribute to around 35% of the nation's emissions. The research introduces a transport model designed to project the growth of EVs within the 2-wheeler (2W) and 4-wheeler passenger (4W) segments, considering different policy scenarios. These scenarios are assessed for their impact on technology adoption, fossil fuel demand, power requirements, and CO2 emissions. Additionally, the study presents a demand model to forecast national electricity demand. The power model is also developed and linked with the transport and demand models to evaluate different fuel mix options for meeting the projected national power demand through 2050. The findings reveal that ambitious policy scenarios can drive EVs to constitute roughly 45% of all 2W and 4W vehicles on Indian roads by 2050, substantially increasing electricity demand to an estimated 295 TWh with a 40% reduction in CO2 emissions within the transport sector. Significantly, the soft linkage between these models underscores the potential for India to meet up to 90% of its national electricity demand through renewable sources like wind, solar, and hydropower. The research underscores the feasibility of transitioning towards a low-carbon energy system through renewable energy and EV integration.
1. Introduction
India, with its 1.4 billion inhabitants, presents a unique set of challenges and opportunities concerning its energy landscape. As the world's most populous country and one of its fastest-growing economies, India's development trajectory is intrinsically linked to its increasing energy demand (United Nations projects. U N Citationn.d.). This demand surge not only fuels the nation's socio-economic and political progress but also contributes significantly to global energy consumption (Shastri, Mohapatra, and Giri Citation2020). The outcome is a complex and multifaceted energy landscape where energy security, climate action, and sustainable development intersect.
The urgency of addressing these intertwined challenges cannot be overstated. India's rapid economic growth has lifted millions out of poverty and set the stage for a more prosperous future. However, this growth has come at a cost, notably in the form of increased greenhouse gas emissions (INDC – Submissions Citationn.d.; Wiley Online Library Citation2017). India currently stands as the third-largest emitter of carbon dioxide (CO2) in the world, with annual emissions totaling 3.6 gigatons and a trajectory that could reach 7.3 gigatons per year by 2050 (Hossain et al. Citation2023b). As a result, the nation finds itself at a crossroads, balancing its commitment to socio-economic development with the imperative of curbing its growing carbon footprint.
Recognising these challenges, India unveiled its climate action plan, ‘Panchamrit,’ during COP26. This comprehensive plan comprises five core elements, including achieving a non-fossil energy capacity of 500 gigawatts by 2030, sourcing 50% of its energy from renewable sources by the same year, reducing projected carbon emissions by a staggering one billion tons between 2021 and 2030, decreasing the carbon intensity of its economy by 45% compared to 2005 levels, and striving to achieve net-zero emissions by 2070 (India’s Stand at COP-Citation26 n.d.). While these goals demonstrate India's commitment to mitigating climate change, the key lies in the practical steps needed to achieve them.
However, attaining this target is further complicated by the pivotal role played by the transportation and power sectors in driving up carbon emissions. They are collectively responsible for responsible for 7% and 26% of the nation's CO2 emissions (Dhar and Shukla Citation2015; Gulagi et al. Citation2022; Zakari, Vuille, and Lehning Citation2022). The transportation sector, which encompasses various modes of mobility, from personal vehicles to public transport, is a vital lifeline for India's burgeoning population. However, the sector is also a significant source of CO2 emissions. The reliance on conventional internal combustion engine vehicles, particularly in the 2-wheeler and 4-wheeler segments, has led to a surge in emissions. As the Indian populace aspires to higher living standards, this sector's emissions are projected to rise significantly if not addressed. Simultaneously, the power sector, responsible for supplying the energy necessary to power the nation, faces its set of challenges. With a substantial portion of its energy generation relying on fossil fuels, particularly coal, the power sector is a major contributor to India's carbon emissions. While coal has historically played a crucial role in meeting the energy demands of the nation, it has come at the cost of escalating carbon emissions.
As India works towards achieving its climate targets addressing emissions from these critical sectors is paramount. Recognising that their symbiotic relationship necessitates coordinated and integrated solutions, this study proposes a multi-sectoral approach. Hence rather than isolating and addressing the challenges in the transportation and power sectors in isolation, this study takes a holistic view. While there has been extensive research and analysis conducted individually in both the transport (Gupta et al. Citation2022; Dhar and Shukla Citation2015) and power sectors (Gulagi et al. Citation2022; Zakari, Vuille, and Lehning Citation2022), the novelty of the study lies in the convergence and harmonisation of efforts including both sectors.
One promising approach to addressing the environmental challenges in these sectors is the concerted promotion of electric vehicles (EVs) (Vidhi and Shrivastava Citation2018; IEA Citationn.d.a; Requia et al. Citation2018) and the integration of renewable energy sources into the power sector (Fischer and Newell Citation2008; Krey and Clarke Citation2011; Mathiesen, Lund, and Karlsson Citation2011). In the transportation sector, the widespread adoption of electric vehicles offers a compelling opportunity to reduce greenhouse gas emissions. EVs are inherently more energy-efficient and have the capacity to operate on electricity generated from cleaner, renewable sources (Harvey Citation2020). Simultaneously, the power sector stands as a pivotal domain for ushering in a sustainable and low-carbon future. The integration of renewable energy sources, such as solar, wind, and hydro power etc., into the power generation mix offers a potent means to mitigate emissions. This transition not only curbs the release of CO2 but also contributes to enhanced energy security and economic growth by harnessing India's abundant clean energy resources.
Following the idea, a transport model, power demand prediction model and power model is developed. The transport model forecasts the growth of EVs, particularly in the 2W and 4W passenger segments due to the substantial increase in the number of 2W and 4W vehicles on the roads (Vahan Sewa | Dashboard Citationn.d.). The model considers various policy scenarios that could influence EV adoption, acknowledging the pivotal role these vehicles can play in emissions reduction. Simultaneously, a demand projection model is developed to predict the nation's power demand. A power model is used to map the supply and demand by detailing how the power generation side aligns with the ever-evolving energy demand in the nation. The interconnection between the transport and power sectors is emphasised through a soft-linking framework, which harmonises the transport model, demand projection model, and power model. This holistic approach enables the exploration of diverse fuel mix scenarios, spanning renewable and non-renewable energy resources, to meet India's projected national power demand up to 2050.
Through this innovative approach, the research aims to bridge the gap between the climate commitments and tangible, actionable steps. It endeavours to provide a roadmap that aligns India's climate objectives with pragmatic policies and practices. It empowers policymakers, researchers, and stakeholders with insights that can guide them in making informed decisions and shaping the future trajectory of India's sustainable and low-carbon transformation.
2. Literature review
The transport sector in India contributes nearly 7% of the country's CO2 emissions, with road transport accounting for 90% of this total (Gupta et al. Citation2022; Ritchie, Roser, and Rosado Citation2020; Singh, Mishra, and Banerjee Citation2022). The registered vehicle stock in the country is approximately 296.5 million, with 2W and 4W (passenger cars) comprising 75% of the total (Vahan Sewa | Dashboard Citationn.d.). shows the fuel consumption of 2Ws and 4Ws in India from 2020 to 2021.
Figure 1. Annual fuel Consumption of 2W (left) and 4W (right) vehicles in India.
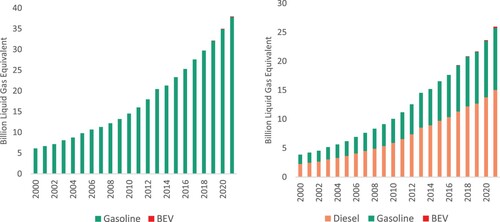
The increasing socio-economic development and purchasing power in India have led to a growth rate of 10.4% for 2-wheelers (2Ws) and 11% for 4-wheelers (4Ws) from 2001 to 2015, resulting in higher emission levels (The OECD Citationn.d.; World Bank Open Data Citationn.d.; Singh, Mishra, and Banerjee Citation2020). The majority of vehicles, around 85%, run on petrol or petrol mixed with alternative fuels such as CNG, LPG, ethanol, & methanol, while 15% use diesel or diesel mixtures (Singh, Mishra, and Banerjee Citation2020).
As vehicle ownership continues to rise, CO2 emissions from the transportation sector are projected to increase by 4.1% to 6.1% annually, potentially resulting in a sevenfold increase by 2050 compared to 2010 levels (Singh, Mishra, and Banerjee Citation2020; Dhar et al. Citation2017a). However, the Indian government has implemented various policies and schemes to mitigate emissions from the transport sector, with a specific focus on EV integration (Singh, Mishra, and Banerjee Citation2020; Cabinet approves India’s Updated Nationally Determined Contribution to be communicated to the United Nations Framework Convention on Climate Change Citationn.d.). Noteworthy schemes include the Faster Adoption and Manufacturing of Hybrid & Electric Vehicles in India (FAME), which provides incentives and financial support to promote the adoption and manufacturing of hybrid and EVs (Bhat, Verma, and Verma Citation2021). The Vehicle Fuel Efficiency Programme establishes efficiency standards for new cars, and there are plans to transition from Bharat Stage IV (BS IV) fuels to Bharat Stage V (BS V)/Bharat Stage VI (BS VI) fuels nationwide (Mirgal Citation2020).
Furthermore, the government has invested in mass transit facilities such as trains and metro services to promote public transportation (India’s Stand at COP-Citation26 n.d.). The FAME scheme, initiated in 2015 and currently in phase II, has a budget allocation of 100 billion INR (approximately US$ 1.5 billion) and has contributed to a 10% increase in EV integration over the last five years. Additionally, the Department of Heavy Industries has sanctioned the establishment of 2,636 charging stations across 62 cities under the FAME India scheme phase II (National Level Policy Citationn.d.). Despite these efforts, EVs currently constitute only 0.5% of the total vehicle population in India, indicating the need for further steps to decarbonise the transport sector (Vahan Sewa | Dashboard Citationn.d.).
The power sector in India accounts for 26% of the country's emissions, despite renewable energy sources holding a 40% share of the installed generation capacity after fossil fuels (Protection of Environment | Government of India | Ministry of Power Citationn.d.). However, approximately 70% of the power demand is still met by fossil fuels (Overview | Government of India | Ministry of Power Citationn.d.). This reliance on fossil fuels is primarily driven by the rapid growth in power demand, which has been increasing at a steady rate of 5% annually over the past decade, with even higher growth rates projected for the near future (Barbar, Mallapragada, and Stoner Citation2023). Furthermore, the increasing power demand is also driven by the need to address climate impacts such as rising temperatures and droughts, with an expected increase in the demand for space cooling in the coming years (Mukherjee et al. Citation2020).
While India is making significant progress in renewable electricity, with new capacity additions projected to double by 2026, there is still a need for further integration of into the power system (Gulagi et al. Citation2022). India had set a target to achieve 175 GW of renewable capacity by 2022, encompassing solar, wind, biomass, and hydro power, but the actual installation has reached 113 GW, covering 65% of the target (Abhyankar et al. Citation2023). Therefore, there is a requirement to expedite the deployment of renewable energy sources in India to meet the increasing power demand and mitigate climate change effectively.
Several studies have examined the challenges and opportunities associated with decarbonising the transport and power sectors in India. One study utilised the ANSWER MARKAL energy system model to analyse sustainable strategies for passenger and freight mobility, vehicle technologies, and fuels, highlighting the potential for improved energy security, air quality, and reduced CO2 emissions in India through a sustainable low-carbon transport scenario (Dhar and Shukla Citation2015). Another study reviewed government initiatives in developing clean fuels in India and emphasised the importance of implementing the Biofuel Policy to promote indigenous production of biofuels, EVs, and hydrogen as decarbonisation options for the transport sector (Gupta et al. Citation2022). A spatially contextualised analysis of energy use for commuting in India projected a significant increase in energy demand and emphasised the need for demand and supply-side policy interventions to achieve deep decarbonisation (Ahmad and Creutzig Citation2019). Additionally, a study focused on the opportunities for India in the production of green hydrogen as a carbon-free fuel, emphasising the advantage of India's growing renewable power generation capacity in producing green hydrogen (Sontakke and Jaju Citation2021). Pathways for achieving a 1.5°C scenario for land transport in emerging economies, including India, highlighted the need for significant changes in travel patterns, technology, and fuels to achieve deep decarbonisation in the transport sector (Arioli, Fulton, and Lah Citation2020).
In one study, the authors highlighted the role of renewables in rapidly transitioning the power sector across states in India, emphasising the need for both state and national-level actions to promote renewable energy and achieve deep decarbonisation (Gulagi et al. Citation2022). Another study investigated current and prospective energy transition scenarios in the Indian landscape, analysing the impact of the COVID-19 pandemic and recommending revamped policy approaches and elemental reforms for deep decarbonisation (Indrajayanthan et al. Citation2022). A study on the climate change impact assessment for future wind and solar energy installations in India emphasised India's aggressive renewable energy policies and the urgent need to decarbonise the power sector (Dhar and Shukla Citation2015). Another study assessed the clean energy transition potential in major power-producing states of India and utilised multi-criteria decision analysis methodologies to evaluate the clean energy potential, policy support, and carbon dependency of different states (Zakari, Vuille, and Lehning Citation2022).
Furthermore, the concept of sector coupling has also been explored in the literature. In a study, the authors used the German context as a case study to evaluate the potential of sector coupling and analysed the linking of the power and transport sectors on a worldwide, EU, and German level (Robinius et al. Citation2017). Another study investigated the role of storage technologies in the decarbonisation of the sector-coupled European energy system, analysing interactions among generation and storage technologies and highlighting the cost-effectiveness of battery and hydrogen storage for achieving deep decarbonisation (Brown et al. Citation2018). Another study discussed the advantages of coupling the electricity, heating, and transport sectors, particularly in urban areas, emphasising the potential of sector coupling for power curtailment, load shedding, and congestion management in Italian context (Prina et al. Citation2020). The impacts of high vehicle-to-grid (V2G) participation in a 100% renewable energy system were explored, highlighting the mutual benefits of V2G in achieving sector coupling between the transport and power sectors in a region in Finland (Child, Nordling, and Breyer Citation2018). An integrated multi-sectoral model assessed the role of electricity in decarbonising European road transport, considering approximately 50 vehicle technologies and analysing the potential of sector coupling to achieve decarbonisation goals (Helgeson and Peter Citation2020). Additionally, the challenges of air pollution in India were discussed including contributions from the residential, industrial, power generation and transport sectors (Lal et al. Citation2022).
Despite these valuable contributions, a comprehensive assessment that integrates the transition of the transport and power sectors and analyses their interdependencies within the specific context of India's energy system is currently lacking. To address this research gap, the present study develops a soft linking framework to holistically evaluate the energy transition in India's transport and power sectors. Given that 2Ws and 4Ws account for 75% of the vehicles on Indian roads, the study recognises the importance of focusing on these modes of transportation. In particular, the transition to EVs is highlighted as a key aspect to be considered in achieving decarbonisation goals. By analysing various fuel mix scenarios, the study seeks to understand how the growing transportation demand and other power demands in the country can be met.
3. Method
The research methodology employed in this study involves the use of three models: the transport model, the demand model, and the power model. These models collectively provide a comprehensive analysis of the energy demand and emissions in the transportation sector and the associated power generation requirements. The transport model serves as the foundation for understanding the sales projections, energy demand, and emissions from 2Ws and 4Ws in India. The demand model complements the transport model by providing a broader perspective on the national electricity demand across various sectors, including agriculture, residential, service, commercial, industrial, and transportation sectors (excluding 2Ws and 4Ws). The power model analyses the power generation requirements and explores different scenarios to meet the energy demand from both the transport sector (2Ws and 4Ws) and other sectors as estimated by the demand model. It considers the current fuel mix in the power sector, as well as the potential integration of renewable energy sources such as solar, wind, and hydro power. The power model evaluates the feasibility of different scenarios, assesses the potential for emissions reduction, and highlights the importance of transitioning to a sustainable and low-carbon energy system.
3.1. Transport model
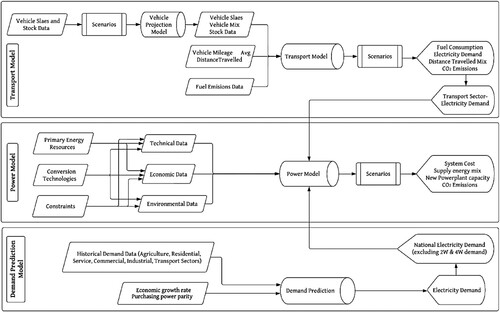
The transport model () used in this study is an excel-based model that projects the sales of 2Ws and 4Ws from 2000 to 2050. The transport model provides three major outputs: the projection of the number of vehicles, energy demand (including the fuel mix of fossil fuel and electricity), and emissions from vehicles based on different defined scenarios.
Figure 2. Soft linking framework used to combine the transport model, demand model, and power model to collectively assess the energy and environmental implications of changes in India's transportation and power sectors.
Projection of the number of vehicles: The model uses historical and literature data for projections. Model uses vehicle sales (Download Reports |Ministry of Statistics and Program Implementation |Government of India Citationn.d.; Government of India Citationn.d.),compound annual growth rate (CAGR), which is assumed to be 10% based on the projection from Asian Development Bank (Helgeson and Peter Citation2020) during the specified time horizon, vehicle lifetime (Government of India Citationn.d.; Dhar et al. Citation2017b), current technology mix (Government of India Citationn.d.; Dhar, Pathak, and Shukla Citation2018) to estimate the number of vehicles for each vehicle type for the year, t (Equation 1).
(1)
(1) n = number of years between the previous year and the projected year.
Energy demand: The energy demand for each vehicle type is estimated based on the projected number of vehicles, average distance traveled per year (Download Reports | Ministry of Statistics and Program Implementation | Government of India Citationn.d.; Government of India Citationn.d.) and fuel consumption rate. Parameters such as fuel efficiency, battery efficiency (Government of India Citationn.d.), vehicle efficiency and average occupancy per vehicle (Download Reports | Ministry of Statistics and Program Implementation | Government of India Citationn.d.; Government of India Citationn.d.) are used to calculate the fuel consumption rate for each vehicle type.
(2)
(2) The energy demand is expressed in MWh, the number of vehicles is counted, the average distance traveled per year is expressed in hundreds of kilometers, and the fuel consumption rate is expressed in MWh/100 km.
Emissions from vehicles: The CO2 emissions from each vehicle type is calculated from the estimated energy demand and emission factors for different fuel types (Equation 3).
(3)
(3) The energy demand is expressed in MWh and the emission factors are expressed in Megawatt-hour (tonnsCO2/MWh) and hence the unit of emissions is tons of CO2. To account for future technological advancements, such as improvements in fuel efficiency and battery efficiency, the model incorporates these advancements as parameters that change over time. While the specific equations may vary depending on the parameter, the general approach to incorporating technological advancements is in Equation (4).
(4)
(4) R = Rate of improvement.
3.1.1. Scenario development
Scenario definition plays a crucial role in the model analysis as it enables the exploration of potential future pathways. Instead of predicting a single future, scenarios offer a range of possible trajectories (Hossain et al. Citation2023b; Greiner et al. Citation2014; Hossain et al. Citation2023a). Energy scenarios provide a framework for examining future energy perspectives by considering different combinations of technological options and their implications (UNDP Citationn.d.). Scenario analysis offers a straightforward approach to exploring decision-making in the context of alternative futures (DeCarolis et al. Citation2017). Scenarios can be categorised into predictive, explorative, and normative typologies, each serving different purposes (Börjeson et al. Citation2006). This study incorporates both explorative scenarios, which provide descriptive insights, and normative scenarios, which offer prescriptive guidance.
Within the model, scenarios are defined based on the extension of the current system and the expected future evolution of the system. These scenarios are motivated by India's plan to increase the share of EVs by 2050. provides an overview of the Transport Model (TM) scenarios used in the analysis. The Business-as-Usual (BAU) scenario assumes no changes in existing policies and no introduction of new policies. This scenario examines the growth of EVs within the current policy framework, particularly focusing on the ongoing FAME scheme, which is currently in its second phase. The BAU scenario is descriptive in nature and does not assign a specific system target. The Announced Pledges Scenario (APS), investigates the case where the transport sector achieves a 30% EV share in the market, meaning that at least 30% of vehicles sold annually are EVs. The APS scenario represents a normative scenario, wherein the system strives to attain a specific target. Finally, the High Ambitious Scenario (HAS) explores a future where only EVs are sold in the market. This scenario also falls under the normative category, as it sets a target for the system to exclusively rely on EVs. By defining these scenarios, the model enables an examination of various possible outcomes and their associated implications. The BAU scenario provides a reference point to understand the trajectory without additional policy interventions. On the other hand, the APS and HAS scenarios represent ambitious targets that guide decision-making towards achieving higher EV penetration in the market.
Table 1. Transport model (TM) scenarios.
3.2. Demand prediction model
The demand prediction model estimates the national electricity demand for agriculture, residential, service, commercial, industrial, and transport sectors (excluding 2W & 4W). A regression model (Dai et al. Citation2023) considering factors like historical demand from agriculture, industry, residential, road (excluding 2W and 4W), rail, commercial, and other factors like economic growth, and purchasing power parity (PPP) is used and is represented by Equation (5).
D(t): Estimated electricity demand (GWh) for the current year, t; β0, β1, β2, … . , β8: regression coefficients; AGR(t): Electricity consumption (GWh) for the agriculture sector in the current year, t; IND(t): Electricity consumption (GWh) for the industry sector in the current year, t; RSD(t): Electricity consumption (GWh) for the residential sector in the current year, t; ROT(t): Electricity consumption (GWh) for the road sector (excluding 2w and 4w) in the current year, t; RAT(t): Electricity consumption (GWh) for the rail sector in the current year, t; COM(t): Electricity consumption (GWh)for the commercial sector in the current year, t; EGR(t): Economic growth (%) in the current year, t; PPP(t): Purchasing power parity in the current year, t.
The regression coefficients (β0, β1, β2, β3, β4, β5, β6, β7, β8) in the model represent the relationships between the independent variables (agriculture, industry, residential, road, rail, commercial, economic growth, PPP) and electricity demand and quantify the impact of each factor on electricity demand. The regression coefficients are estimated using historical data on electricity consumption for each sector, economic growth, and PPP through regression analysis following which the model predicts the future electricity demand by inputting the values of the independent variables for the specific year of interest.
3.3. Power model
The power model employed in this study is a techno-economic model developed using single objective linear programming (SpringerLink Citationn.d.). This model incorporates detailed information on existing power plants, power demand, and the generation potential of renewable energy sources. A prediction model is utilised to estimate the available potential of wind, solar, and hydro resources (Mattsson et al. Citation2021). Additional data, such as techno-economic and environmental-related information, emission data, fuel consumption, fuel efficiency, plant expenditures, and the Levelized Cost of Energy (Renewable Energy Finance – 1st Edition Citationn.d.) for different plants, is also incorporated into the model. The energy demand provided to the power model is derived from the transport model and a demand prediction model. The primary objective of the power model is to determine an optimal input energy mix that minimises the total system cost to meet the national power demand in a future year, such as 2050, under various scenarios. The objective function of the model is defined to minimise the total system cost for generating the power. In the model, similar types of power plants are aggregated for ease of computation (e.g. demand from all coal plants as summed up, generation capacity from onshore wind is aggregated). Equation 6 describes the objective function of the model.
(6)
(6) x: generation from plant type k (MWh); n: number of type of plants; α: fuel efficiency (kg/MWh); β: fuel cost ($/kg); γ: operating & maintanence cost, fixed ($/MWh); ϵ: operating & maintanence cost, varable ($/MWh); δ: LCOE, calculated for new power plants ($/MWh).
The constraints limiting the objective function mainly include power demand, installed capacity, and potential generation by RES. Two types of constraints are employed, one for existing plants and the other for new plants added to meet increased demand. Equation 7, 8, and Equation 9 describe the constraints.

Ð: electricity demand (MWh).

Þ: Generation potential of new power plants (MWh); Þ = f (capacity factor,prediction of RES, hours of operation).

![]() : Generation from existing power plants;
: Generation from existing power plants; ![]() = f (capacity factor, hours of operation, installed capacity).
= f (capacity factor, hours of operation, installed capacity).
The model considers whether to meet the demand using existing power plants or through investments in new power plants. It can incorporate cost, emission data, and other constraints to make strategic decisions regarding the electricity generation mix. To facilitate computational efficiency, similar types of power plants are aggregated in the model. For instance, the demand from all coal plants is summed up, and the generation capacity from onshore wind is aggregated. A comprehensive description of the model framework can be found in (Sobha Citation2022), and illustrates the model's overall structure. The transport model estimates the electricity demand for 2W and 4W and the demand prediction model estimates the national electricity demand for agriculture, residential, service, commercial, industrial, and transport sectors (excluding 2W & 4W) which is used in power model as demand constraint (Equation 7).
3.3.1. Scenario development
The scenarios developed for the power model in this study are motivated by the Sustainable Development Goals (SDGs) and India's plan to increase the share of RES in its power sector by 2050 (Shastri, Mohapatra, and Giri Citation2020). provides an overview of the Power Model (PM) scenarios used in the analysis. The BAU scenario in the power model assumes no changes in existing policies and no introduction of new policies in the power sector. This scenario assesses how the power sector can meet the national demand, taking into account the increased demand resulting from the integration of EVs under various scenarios. The BAU scenario is descriptive in nature and does not assign a specific system target.
Table 2. Power model (PM) scenarios.
APS in the power model sets a minimum requirement for the share of RES generation, which is 60% of the total power demand. This scenario reflects a normative perspective, where the system strives to achieve a specific target in terms of RES integration. HAS in the power model sets a higher minimum requirement for the share of RES generation, which is 100% of the total power demand. This scenario also falls under the normative category, as it represents an ambitious target for achieving complete dominance of renewable energy sources in the power sector. By defining these scenarios, the power model enables an assessment of different pathways for increasing the share of renewable energy in the power sector, aligning with India's long-term goals and the global sustainability agenda. The BAU scenario provides a baseline reference, while the APS and HAS scenarios provide targets that guide decision-making towards greater RES integration.
3.4. Soft linking models
This section explains the soft-linking framework for the transport model, demand model and power model. The power model is fed with electricity demand data from the transport and demand prediction model. The soft linked system (Lindholt and Wei Citation2023; Zhang et al. Citation2023) investigates how can the power demand be met under various PM scenarios for the transition to a sustainable future. . shows the soft linking framework of the models.
4. Results
The section explains the results from the transport model, power model, demand prediction model, and the soft-linked set.
4.1. Transport model results
The transport model results offer crucial insights into the growth of 2Ws and 4Ws, and they illuminate several reasons behind these trends. shows the anticipated growth of 2Ws and 4Ws in India between 2020 and 2050 across various transport scenarios, as outlined in . Firstly, the model projections indicate that the growth of 2Ws is expected to be significantly higher compared to 4Ws, with projected increases of 264%, 75%, and 46% during the years 2030, 2040, and 2050, respectively, across all considered scenarios. Several factors contribute to this trend. One of the key reasons is the economic trajectory of the country. Prior to the COVID-19 pandemic, India was experiencing robust economic growth (Barbar et al. Citation2021). This upward trajectory in GDP growth rate is a strong driver of increased personal income and purchasing power among the population (Bank Citation2022). As people's financial means improve, there's a natural tendency to invest in personal mobility, and 2Ws, being a more affordable and accessible mode of transportation than 4Ws, are often the preferred choice. Secondly, the prominence of 2Ws on Indian roads is noteworthy. In 2022, 73% of the vehicles on Indian roads were 2Ws. This prevalence is influenced by various factors, including affordability, ease of maneuverability in crowded urban areas, and fuel efficiency, which makes 2Ws an attractive option for many. The model expects this trend to continue due to the persistent economic growth of the country.
Figure 3. Estimated growth of 2W and 4W vehicles in India, presented in millions of vehicles for years 2020–2050. The projections are analysed across three distinct scenarios, BAU (Stated Policy Scenario), APS (Announced Pledges Scenario) and HAS (High Ambitious Scenario).
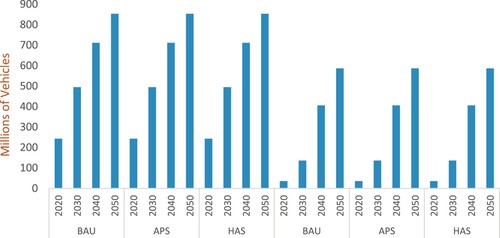
Furthermore, although there was a recent decline in 2W sales in India, dropping from 21.18 million units in the financial year 2018–2019 to 13.47 million units in the financial year 2021–2022, this decline is not projected to have a lasting impact on the long-term growth of 2Ws (IEA Citationn.d.b). This is because, despite short-term fluctuations, the underlying factors such as economic growth and urbanisation continue to drive the demand for personal mobility, especially in the form of 2Ws. However, this escalating number of vehicles, particularly 2Ws, poses a significant environmental threat. The transportation sector is a major contributor to air pollution and greenhouse gas emissions, which are primary drivers of climate change. In response to these challenges, the following section of the study delves into scenario analysis to explore measures for decarbonising the transport sector, thus addressing these environmental concerns.
The fuel mix composition, as depicted in , provides information on the transition towards electrification in the context of two-wheelers (2Ws) and four-wheelers (4Ws). The model's findings reveal trends, influenced by several factors. Firstly, the model predicts a higher electrification rate for 4Ws compared to 2Ws. This outcome is partly due to the larger growth rate anticipated for 2Ws (Chakraborty and Chakravarty Citation2023). The economic factors, including income growth and urbanisation, are driving the increased demand for mobility, especially in the form of 2Ws, which are often more affordable and maneuverable for daily commuting in crowded urban areas. Secondly, the model places constraints on the growth of diesel cars in the APS and HAS, aligning with real-world observations. Over the past five years, there has been a notable decline of over 50% in diesel car sales in India (UNFCCC Citationn.d.). This decline is a result of changing economic dynamics and fuel price trends. Diesel cars, which were once preferred for their fuel efficiency, have become less attractive due to the rising costs of diesel and the increasing focus on environmental concerns. This aligns with the model's constraints, which aim to steer the transportation sector away from diesel vehicles.
Figure 4. Fuel mix used by 2W and 4W vehicles in India across three distinct scenarios, BAU (Stated Policy Scenario), APS (Announced Pledges Scenario) and HAS (High Ambitious Scenario).
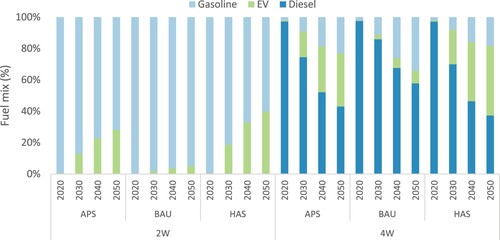
HAS envisions a substantial growth in EVs in India by 2050. In this scenario, 40% of 2Ws on the road are expected to be electric, compared to 28% in the more conservative APS. This divergence is largely attributed to policy-driven interventions and a strong push for electrification in the HAS. In contrast, in the BAU scenario, there is sluggish growth in electrification throughout the entire model horizon. This scenario reflects a lack of significant policy incentives for EV adoption, resulting in slower progress. In terms of 4Ws, the share of EVs in the fuel mix reaches 44% in the HAS and 34% in the BAU scenario by 2050. Again, the difference is influenced by the level of policy support and market dynamics. In the BAU case, where electrification receives less support, the growth of EVs is more limited. Diesel vehicles are expected to comprise 37% of vehicles on Indian roads in 2050 in the HAS scenario, while the BAU scenario anticipates a higher share of diesel cars (48%). This growth in the BAU case can be attributed to the expanding Indian economy, expected increases in petrol prices, and the relatively low cost of diesel fuel. These findings highlight the significance of policy interventions and market dynamics in shaping the future of India's transportation sector and its transition towards a more sustainable and electrified future.
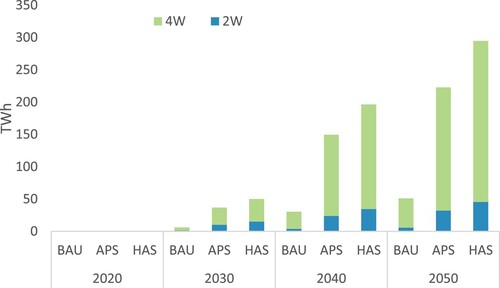
depicts the combined emissions in millions of tons of CO2 from 2Ws and 4Ws. The model results project that CO2 emissions from these vehicles will reach 1 Gt in 2050. The APS scenario reduces emissions by 27%, while the HAS scenario achieves a 40% reduction compared to the BAU scenario. The analysis includes emissions from the current power sector, with an emission factor of 0.79 tCO2/MWh, representing the weighted average of the Indian Grid for FY 2020–2021 (Protection of Environment | Government of India | Ministry of Power Citationn.d.). illustrates the power demand required for charging 2W and 4W EVs (in TWh) on the roads. In the BAU scenario, the electricity demand is projected to reach 50 TWh in 2050. However, in the APS and HAS scenarios, the demand increases by 336% and 476% respectively compared to the BAU scenario. In the BAU scenarios, electricity has a significantly lower share in the fuel mix, losing out to gasoline and diesel vehicles. In the APS and HAS scenarios, which exhibit higher electrification rates, the level of electrification surges around or after the year 2030 and continues until 2050.
Figure 5. Combined CO2 emissions attributed to 2W and 4W vehicles in India across three distinct scenarios, BAU (Stated Policy Scenario), APS (Announced Pledges Scenario) and HAS (High Ambitious Scenario).
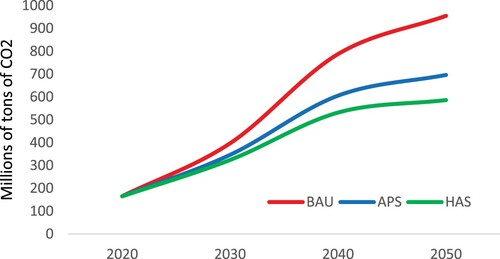
Figure 6. Power demand required for charging 2W and 4W EVs in TWh in India across three distinct scenarios, BAU (Stated Policy Scenario), APS (Announced Pledges Scenario) and HAS (High Ambitious Scenario).
The emissions from 2Ws and 4Ws are a critical aspect of understanding the environmental impact of the transportation sector's transition. provides the model's projections regarding the emissions produced by these vehicles. The model results indicate that without substantial policy-driven interventions, CO2 emissions from 2Ws and 4Ws in India are projected to be substantial, reaching 1 gigaton (1 Gt) of CO2 emissions in 2050. This is a concerning figure, given the detrimental impact of CO2 emissions on climate change and air quality. However, the model scenarios offer a more optimistic outlook. The APS is expected to reduce emissions by 27% compared to the BAU scenario. This reduction is a result of the model's constraints on diesel cars and the promotion of electrification in this scenario. It's an encouraging sign that relatively modest policy interventions can lead to a significant decrease in emissions. The HAS showcases even more promising results. In this scenario, a 40% reduction in emissions is projected when compared to the BAU scenario. The greater reduction can be attributed to the ambitious policy initiatives that drive a faster transition towards EVs and other low-carbon options. To understand the context better, the analysis includes emissions from the current power sector, represented by an emission factor of 0.79 tons of CO2 per megawatt-hour (tCO2/MWh), which is based on the weighted average of the Indian Grid for FY 2020–2021 (Protection of Environment | Government of India | Ministry of Power Citationn.d.). This is essential because it reflects the emissions generated from the electricity used to charge EVs. The decarbonisation of the power sector plays a crucial role in reducing the overall emissions from the transportation sector, particularly as EV adoption increases. Therefore, power sector emissions have a direct impact on the total emissions from 2Ws and 4Ws.
provides insights into the power demand required for charging 2W and 4W EVs, measured in terawatt-hours (TWh). In the BAU scenario, the electricity demand for charging EVs is projected to reach 50 TWh in 2050. This scenario reflects a future where electrification is not a priority, and other conventional fuel vehicles, such as gasoline and diesel, still dominate the market. However, in the APS and HAS, which encourage higher electrification rates, the demand for electricity increases significantly. In these scenarios, the level of electrification begins to surge around or after the year 2030 and continues until 2050. This illustrates the critical role of electrification in India's transportation sector and the increasing demand for electricity to charge EVs.
4.2. Demand prediction model results
The findings regarding India's electricity demand offer insights into the complex interplay of various sectors and factors influencing the nation's power consumption. Historically, rail transport has been a major contributor to India's electricity demand, as mentioned in previous studies (Satapathy, Jena, and Sahu Citation2023). This is due to the extensive rail network in the country and the energy requirements of running electric trains. Furthermore, metro services and freight transport, especially the infrastructure involved, have played significant roles in driving up electricity demand (Singh, Mishra, and Banerjee Citation2020). As urbanisation and industrialisation continue, these sectors are expected to experience a substantial increase in electricity consumption. The rising demand for electricity in the residential and commercial sectors is a noteworthy trend. This demand surge is primarily a response to increasing temperatures and the need for cooling solutions. Rising temperatures and heatwaves are becoming more frequent due to climate change, and this has led to a higher demand for air conditioning. The projection estimates that by 2050, around two-thirds of households globally will have air conditioning, with China, India, and Indonesia being responsible for a significant portion of this demand (IEA Citationn.d.b). The increasing electricity consumption for cooling in India reflects the urgent need for adequate and sustainable cooling solutions to address both the demand for comfort and the energy efficiency aspects associated with cooling technologies.
However, it's important to note that the data presented in also consider the impact of the COVID-19 pandemic on energy demand. Initially, prior to the pandemic, India's energy demand was on a trajectory to increase by nearly 50% between 2019 and 2030 (Renewable Energy Finance – 1st Edition Citationn.d.). The pandemic resulted in a sudden drop in power demand, as many economic activities were disrupted (Deshwal, Sangwan, and Dahiya Citation2021). However, what's particularly interesting is that the data now indicate a rapid recovery in power demand. This suggests that despite the short-term decline due to the pandemic, the long-term trend of increasing electricity consumption in India remains robust. The recovery in power demand is likely influenced by the resumption of economic activities and the continued growth of industries and urban centres. In summary, the findings underscore the complexity of factors shaping India's electricity demand, including the dominant role of rail transport, the increasing need for cooling in response to climate change, and the resilience of the long-term trend in power demand despite pandemic-related disruptions. These insights are crucial for energy planning and policy development in India, especially in ensuring a reliable and sustainable power supply to meet the evolving needs of the nation.
Table 3. Demand prediction model output.
4.3. Soft linking results
This section presents the outcomes obtained through the integration of the transport model, power model, and demand model. The transport model estimates the electricity demand for 2W and 4W vehicles, while the demand prediction model estimates the national electricity demand across various sectors, excluding 2W and 4W, and provides input to the power model.
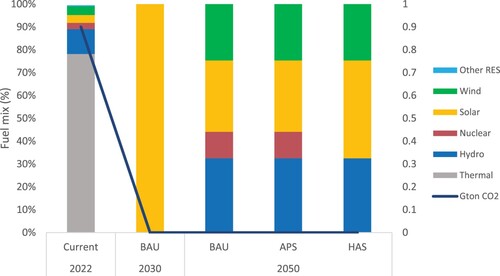
displays the results of the power model scenario analysis (refer to ) after incorporating the transport model results. In this analysis, the power model evaluates different scenarios to meet the power demand generated by the transport model. The current fuel mix depicted in represents the existing combination of fuels used to meet the national power demand. The model results indicate that the power demand from 2W and 4W vehicles can be entirely fulfilled by harnessing the solar potential of the country by the year 2030. This holds true for all scenarios, including BAU, APS, and HAS, owing to the cost efficiency of photovoltaic (PV) panels. Furthermore, the results reveal that the transport demand from 2W and 4W vehicles can be satisfied by utilising 100% renewable energy sources in the energy mix. The model demonstrates that solar energy has the highest potential to meet the country's energy demand, followed by hydro and wind. In the power model, only the emissions resulting from power plant operation are considered, resulting in zero CO2 emissions in scenarios that rely solely on renewable energy sources.
Figure 7. Fuel mix utilised to meet the power demand of the transportation sector in India, focusing on 2W & 4W in three distinct scenarios, BAU (Stated Policy Scenario), APS (Announced Pledges Scenario) and HAS (High Ambitious Scenario).
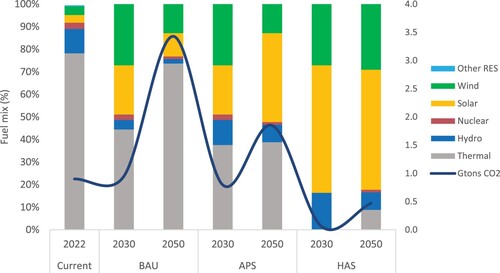
showcases the results of the power model scenario analysis (refer to ) on the national power demand, encompassing the demand from the transport sector. Here, the power model incorporates the power demand from 2W and 4W vehicles, as well as the national power demand projected by the demand prediction model explained in section 2.2. At present, fossil fuels account for 78% of the input fuel mix in the power sector. In the BAU scenario, this share experiences a slight reduction to 74% by 2050. In the APS scenario, the proportion of fossil fuel decreases to approximately 39%. The HAS scenario, on the other hand, considers a 100% renewable energy mix, with solar, wind, and hydro meeting the majority of the demand by 2030. By 2050, the demand surpasses the capacity of solar, wind, and hydro potential, prompting the model to invest in other renewable sources, which can also be regarded as additional storage options. Nevertheless, the model outcomes indicate that the projected national power demand for 2050, including the increased demand from the transportation sector, can be satisfied with 100% renewable energy sources. As renewables are integrated into the system, CO2 emissions from power generation display a declining trend. In comparison to the BAU scenario, the APS scenario exhibits approximately 1.5 times lower CO2 emissions, while the HAS scenario shows a reduction of around 6 times in CO2 emissions.
Figure 8. Composition of the energy sources or fuel types used to meet the national power demand in India in three distinct scenarios, BAU (Stated Policy Scenario), APS (Announced Pledges Scenario) and HAS (High Ambitious Scenario).
The study's results are in line with existing research in the two sectors. Firstly, the findings regarding the Indian transportation sector harmonise with previous studies, which project an annual compounded growth rate of around 7% from 2012 to 2030 (Irfan, Mahapatra, and Shahbaz Citation2023). Secondly, in the domain of the power sector, the study's results are in agreement with similar research that suggests solar and wind energy combined would contribute approximately 85% to the total generation capacity in 2050 (Das et al. Citation2023). Furthermore, by considering renewable energy sources capacity targets and the introduction of a carbon tax, the study's findings align with the notion that these measures can lead to potential future generation mixes conducive to achieving the goal of power sector decarbonisation in India (Chakraborty and Chakravarty Citation2023).
5. Discussion
The findings presented in this study highlight the urgency and significance of policy interventions to accelerate the electrification of the transport sector and integrate renewable energy into power generation. To ensure a sustainable and low-carbon future, it is crucial for policymakers to prioritise the following key areas:
EV Penetration Targets: Setting ambitious targets for EV penetration, especially in the 2W and 4W segments, can be a transformative step towards reducing carbon emissions in the transportation sector. To achieve this, creating a supportive environment for the growth of the 2W EV market, implementing targeted policies and incentives, and ensuring the availability of decarbonised electricity for charging EVs are recommended.
Managing Demand and Enhancing Energy Efficiency: Prioritising energy-efficient technologies and practices can significantly contribute to reducing energy consumption and relieving strain on the power grid (e.g. efficient cooling). Policymakers may consider implementing stringent building codes and standards, promoting the adoption of efficient cooling appliances, and raising consumer awareness about responsible energy use to achieve lower carbon emissions, improved energy security, and sustainable cooling solutions.
Integrating Renewable Energy Sources: Policymakers are encouraged to prioritise the integration of renewable energy sources into the power generation mix. This can be accomplished by creating a conducive environment for investment in renewable energy projects, streamlining regulatory processes, and providing incentives for renewable energy technologies. By shifting towards a higher share of renewable energy, India can achieve substantial reductions in carbon emissions, enhance energy security, and foster economic growth.
Promoting Policy Synergies and Collaborations: Collaboration across sectors is crucial for achieving sustainable and low-carbon development. Policymakers should aim to integrate transport and power sector planning, optimising infrastructure development and coordinating the deployment of charging infrastructure while effectively utilising renewable energy resources. By fostering collaboration among policymakers, researchers, industry stakeholders, and civil society, comprehensive policies can be developed and implemented to address energy demand, transportation emissions, and climate change challenges effectively.
While this study provides valuable insights into the integration of renewable energy and EVs in India's power and transportation sectors, there are certain limitations that warrant further research and exploration. One limitation is that the current model treats EVs as an aggregated section, without distinguishing between different types of batteries and fuel cells. Future work should expand the model to incorporate the growth and impact of various battery technologies and fuel cells, allowing for a more comprehensive analysis of their influence on power demand. Additionally, the transport model would benefit from incorporating more detailed data to accurately mimic people's purchase behaviour, enabling a more precise assessment of the factors influencing EV adoption. Furthermore, the power model can be further developed by considering the cradle to grave emissions associated with all energy supply sources. By including emissions throughout the entire lifecycle, from production to disposal, a more accurate assessment of the environmental impact of different energy sources can be achieved. Additionally, the category of ‘other renewable energy sources’ should be expanded to identify the potential of biomass, waste-to-energy, and other emerging renewable technologies. These expansions and improvements to the models will enhance their accuracy and provide policymakers with more robust insights for decision-making. By addressing these limitations and incorporating the suggested improvements, future research can contribute to a more comprehensive understanding of the potential of renewable energy integration and EV adoption in India. Such research will aid in the formulation of more effective policies and strategies to accelerate the transition to a sustainable and low-carbon energy system.
6. Conclusion
In conclusion, this study underscores the substantial potential of renewable energy sources and EV adoption in addressing India's power demand and transportation sector emissions. Transitioning toward a sustainable and low-carbon energy system is feasible by integrating renewables into power generation and promoting EVs. The results project significant vehicle growth in India, particularly in two-wheelers (2Ws) and four-wheelers (4Ws). By 2030, we anticipate a remarkable 264% increase in 2Ws and a 75% growth in 4Ws. Looking ahead to 2050, the model suggests a robust 46% growth in 2Ws, solidifying their dominance in India's vehicle landscape. Furthermore, the model illustrates a rapid transition in the fuel mix. Notably, the electrification rate for 4Ws is remarkable, with up to 40% of electric vehicles by 2050 in the High Ambitious Scenario (HAS), while the Business-as-Usual (APS) scenario predicts slower electrification growth. Significant changes in diesel car sales are also forecast, driven by economic dynamics and fuel price trends. Decarbonising the transport sector is paramount, as emissions from 2Ws and 4Ws in the BAU scenario are projected to reach 1 Gt in 2050. However, policy-driven interventions lead to substantial reductions, with the HAS scenario achieving a 40% reduction compared to BAU. The study emphasises the growing demand for electricity to charge 2Ws and 4Ws. In the HAS scenario, electricity demand is estimated to reach 50 TWh by 2030. This underscores India's remarkable potential in renewables, especially solar energy. The power model analysis shows that by 2030, solar alone can meet the power demand from 2Ws and 4Ws in all scenarios. Solar, wind, and hydro sources play pivotal roles in India's energy mix. The most compelling finding is the prospect of zero CO2 emissions. Our analysis indicates that renewables can meet the increased power demand from electric vehicles and the national power demand, even in the APS scenario, with some fossil fuel components, emissions see a stark reduction compared to the BAU scenario.
Looking ahead, the work can expand to include a broader spectrum of vehicles, such as commercial vehicles, buses, and three-wheelers, which are integral to India's transport landscape. The study could delve into the intricate dynamics of electrification in these segments, analysing their growth patterns and emissions. Moreover, assessing the impact of charging infrastructure development and advancements in battery technology on electric vehicle adoption will be pivotal. This research provides a solid foundation for more comprehensive models that integrate the complexities of multiple vehicle types, offering a holistic view of India's transportation decarbonisation journey.
Author contribution
Parvathy Sobha conceptualised and designed the study, formulating the main idea and providing overall direction and planning. She developed the Power Model, conducted the power model scenario analysis.
Akshayan Muthusamypillai contributed by developing the Transport model, carrying out the transport scenario analysis, and obtaining the transport model results.
Midhun Xavier supported in developing the demand projection model and actively contributed to communicating the research findings effectively.
All authors actively participated in writing, proofreading and reviewing the paper to ensure its quality and coherence.
Correction Statement
This article has been corrected with minor changes. These changes do not impact the academic content of the article.
References
- Abhyankar, N., P. Mohanty, S. Deorah, N. Karali, U. Paliwal, J. Kersey, et al. 2023. “India’s Path Towards Energy Independence and a Clean Future: Harnessing India’s Renewable Edge for Cost-Effective Energy Independence by 2047.” The Electricity Journal 36 (5): 107273. https://doi.org/10.1016/j.tej.2023.107273.
- Ahmad, S., and F. Creutzig. 2019. “Spatially Contextualized Analysis of Energy use for Commuting in India.” Environmental Research Letters 14: 045007. https://doi.org/10.1088/1748-9326/ab011f.
- Arioli, M., L. Fulton, and O. Lah. 2020. “Transportation Strategies for a 1.5 °C World: A Comparison of Four Countries.” Transportation Research Part D: Transport and Environment 87: 102526. https://doi.org/10.1016/j.trd.2020.102526.
- Bank, A. D. 2022. ADB Annual Report 2021. Asian Development Bank.
- Barbar, M., D. S. Mallapragada, M. Alsup, and R. Stoner. 2021. “Scenarios of Future Indian Electricity Demand Accounting for Space Cooling and Electric Vehicle Adoption.” Scientific Data 8: 178. https://doi.org/10.1038/s41597-021-00951-6.
- Barbar, M., D. S. Mallapragada, and R. J. Stoner. 2023. “Impact of Demand Growth on Decarbonizing India’s Electricity Sector and the Role for Energy Storage.” Energy and Climate Change 4: 100098. https://doi.org/10.1016/j.egycc.2023.100098.
- Bhat, F. A., M. Verma, and A. Verma. 2021. “Measuring and Modelling Electric Vehicle Adoption of Indian Consumers.” Transportation in Developing Economies 8: 6. https://doi.org/10.1007/s40890-021-00143-2.
- Börjeson, L., M. Höjer, K.-H. Dreborg, T. Ekvall, and G. Finnveden. 2006. “Scenario Types and Techniques: Towards a User’s Guide.” Futures 38 (7): 723–739. https://doi.org/10.1016/j.futures.2005.12.002.
- Brown, T., D. Schlachtberger, A. Kies, S. Schramm, and M. Greiner. 2018. “Synergies of Sector Coupling and Transmission Reinforcement in a Cost-Optimised, Highly Renewable European Energy System.” Energy 160: 720–739. https://doi.org/10.1016/j.energy.2018.06.222.
- Cabinet approves India’s Updated Nationally Determined Contribution to be communicated to the United Nations Framework Convention on Climate Change. n.d. Accessed July 2, 2023. https://pib.gov.in/pib.gov.in/Pressreleaseshare.aspx?PRID=1847813.
- Chakraborty, R., and S. Chakravarty. 2023. “Factors Affecting Acceptance of Electric two-Wheelers in India: A Discrete Choice Survey.” Transport Policy 132: 27–41. https://doi.org/10.1016/j.tranpol.2022.12.015.
- Child, M., A. Nordling, and C. Breyer. 2018. “The Impacts of High V2G Participation in a 100% Renewable Åland Energy System.” Energies 11: 2206. https://doi.org/10.3390/en11092206.
- Dai, T.-Y., P. Radhakrishnan, K. Nweye, R. Estrada, D. Niyogi, and Z. Nagy. 2023. “Analyzing the Impact of COVID-19 on the Electricity Demand in Austin, TX Using an Ensemble-Model Based Counterfactual and 400,000 Smart Meters.” Computational Urban Science 3, https://doi.org/10.1007/s43762-023-00095-w.
- Das, A., V. Saini, K. Parikh, J. Parikh, P. Ghosh, and M. Tot. 2023. “Pathways to net Zero Emissions for the Indian Power Sector.” Energy Strategy Reviews 45: 101042. https://doi.org/10.1016/j.esr.2022.101042.
- DeCarolis, J., H. Daly, P. Dodds, I. Keppo, F. Li, W. McDowall, et al. 2017. “Formalizing Best Practice for Energy System Optimization Modelling.” Applied Energy 194: 184–198. https://doi.org/10.1016/j.apenergy.2017.03.001.
- Deshwal, D., P. Sangwan, and N. Dahiya. 2021. “How Will COVID-19 Impact Renewable Energy in India? Exploring Challenges, Lessons and Emerging Opportunities.” Energy Research & Social Science 77: 102097. https://doi.org/10.1016/j.erss.2021.102097.
- Dhar, S., M. Pathak, and P. R. Shukla. 2017a. “Electric Vehicles and India’s low Carbon Passenger Transport: A Long-Term co-Benefits Assessment.” Journal of Cleaner Production 146: 139–148. https://doi.org/10.1016/j.jclepro.2016.05.111.
- Dhar, S., M. Pathak, and P. R. Shukla. 2018. “Transformation of India’s Transport Sector Under Global Warming of 2 °C and 1.5 °C Scenario.” Journal of Cleaner Production 172: 417–427. https://doi.org/10.1016/j.jclepro.2017.10.076.
- Dhar, S., and P. R. Shukla. 2015. “Low Carbon Scenarios for Transport in India: Co-Benefits Analysis.” Energy Policy 81: 186–198. https://doi.org/10.1016/j.enpol.2014.11.026.
- Dhar, S., P. R. Shukla, and M. Pathak. 2017b. “India’s INDC for Transport and 2 C Stabilization Target.” Chem Eng Trans 56: 31–36. https://doi.org/10.3303/CET1756006.
- Download Reports | Ministry of Statistics and Program Implementation | Government of India. n.d. Accessed July 2, 2023. https://www.mospi.gov.in/download-reports.
- Fischer, C., and R. G. Newell. 2008. “Environmental and Technology Policies for Climate Mitigation.” Journal of Environmental Economics and Management 55 (2): 142–162. https://doi.org/10.1016/j.jeem.2007.11.001.
- Government of India. n.d. Road Transport Year Book 2017-18 & 2018-19 | Ministry of Road Transport & Highways. Accessed July 2, 2023. https://morth.nic.in/road-transport-year-book-2017-18-2018-19.
- Greiner, R., J. Puig, C. Huchery, N. Collier, and S. T. Garnett. 2014. “Scenario Modelling to Support Industry Strategic Planning and Decision Making.” Environmental Modelling & Software 55: 120–131. https://doi.org/10.1016/j.envsoft.2014.01.011.
- Gulagi, A., M. Ram, D. Bogdanov, S. Sarin, T. N. O. Mensah, and C. Breyer. 2022. “The Role of Renewables for Rapid Transitioning of the Power Sector Across States in India.” Nature Communications 13: 5499. https://doi.org/10.1038/s41467-022-33048-8.
- Gupta, S., S. K. Kar, and S. Harichandan. 2022. “India’s Emerging Fuel mix for 2050: Actions and Strategies to Decarbonize the Transport Sector.” International Journal of Energy Sector Management 16 (5): 924–945. https://doi.org/10.1108/IJESM-02-2021-0005.
- Harvey, L. D. D. 2020. “Rethinking Electric Vehicle Subsidies, Rediscovering Energy Efficiency.” Energy Policy 146: 111760. https://doi.org/10.1016/j.enpol.2020.111760.
- Helgeson, B., and J. Peter. 2020. “The Role of Electricity in Decarbonizing European Road Transport – Development and Assessment of an Integrated Multi-Sectoral Model.” Applied Energy 262: 114365. https://doi.org/10.1016/j.apenergy.2019.114365.
- Hossain, M. S., Y. R. Fang, T. Ma, C. Huang, and H. Dai. 2023a. “The Role of Electric Vehicles in Decarbonizing India’s Road Passenger Toward Carbon Neutrality and Clean air: A State-Level Analysis.” Energy 273: 127218. https://doi.org/10.1016/j.energy.2023.127218.
- Hossain, M. S., Y. R. Fang, T. Ma, C. Huang, W. Peng, J. Urpelainen, et al. 2023b. “Narrowing Fossil Fuel Consumption in the Indian Road Transport Sector Towards Reaching Carbon Neutrality.” Energy Policy 172: 113330. https://doi.org/10.1016/j.enpol.2022.113330.
- IEA. n.d.a Global EV Outlook 2021 – Analysis. Accessed October 15, 2023. https://www.iea.org/reports/global-ev-outlook-2021.
- IEA. n.d.b India Energy Outlook 2021 – Analysis. Accessed July 2, 2023. https://www.iea.org/reports/india-energy-outlook-2021.
- INDC – Submissions. n.d. Accessed July 2, 2023. https://www4.unfccc.int/sites/submissions/INDC/Submission%20Pages/submissions.aspx.
- India’s Stand at COP-26. n.d. Accessed July 2, 2023. https://pib.gov.in/pib.gov.in/Pressreleaseshare.aspx?PRID=1795071.
- Indrajayanthan, V., N. K. Mohanty, R. M. Elavarasan, and L. Mihet-Popa. 2022. “Investigation on Current and Prospective Energy Transition Scenarios in Indian Landscape Using Integrated SWOT-MCDA Methodology.” Sustainability 14: 4940. https://doi.org/10.3390/su14094940.
- Irfan, M., B. Mahapatra, and M. Shahbaz. 2023. “Energy Efficiency in the Indian Transportation Sector: Effect on Carbon Emissions.” Environment, Development and Sustainability, https://doi.org/10.1007/s10668-023-02981-z.
- Krey, V., and L. Clarke. 2011. “Role of Renewable Energy in Climate Mitigation: A Synthesis of Recent Scenarios.” Climate Policy 11 (4): 1131–1158. https://doi.org/10.1080/14693062.2011.579308.
- Lal, R. M., K. Tibrewal, C. Venkataraman, K. Tong, A. Fang, Q. Ma, et al. 2022. “Impact of Circular, Waste-Heat Reuse Pathways on PM2.5-Air Quality, CO2 Emissions, and Human Health in India: Comparison with Material Exchange Potential.” Environmental Science & Technology 56 (13): 9773–9783. https://doi.org/10.1021/acs.est.1c05897.
- Lamb, W. F., & Steinberger, J. K. (2017). Human well-being and climate change mitigation. Wiley Interdisciplinary Reviews: Climate Change, 8(5), e485. https://doi-org.proxy.lib.ltu.se/10.1002/wcc.485.
- Lindholt, L., and T. Wei. 2023. “The Effects on Energy Markets of Achieving a 1.5 °C Scenario.” International Journal of Environmental Research and Public Health 20), https://doi.org/10.3390/ijerph20054341.
- Mathiesen, B. V., H. Lund, and K. Karlsson. 2011. “100% Renewable Energy Systems, Climate Mitigation and Economic Growth.” Applied Energy 88 (2): 488–501. https://doi.org/10.1016/j.apenergy.2010.03.001.
- Mattsson, N., V. Verendel, F. Hedenus, and L. Reichenberg. 2021. “An Autopilot for Energy Models – Automatic Generation of Renewable Supply Curves, Hourly Capacity Factors and Hourly Synthetic Electricity Demand for Arbitrary World Regions.” Energy Strategy Reviews 33: 100606. https://doi.org/10.1016/j.esr.2020.100606.
- Mirgal, N. 2020. “Indian Automotive Industry Towards Bharat Stage-VI Emission Norms: A Technical Review.” International Journal of Engineering Research and Advanced Technology 3 (11): 9–14. https://doi.org/10.31695/IJERAT.
- Mukherjee, P. K., E. Gibbs, A. Walia, and C. Taylor. 2020. “Staying Cool: The Development of India’s Pioneering Energy Efficiency Policy for Chillers.” WIRES Energy and Environment 9 (4): e372. https://doi.org/10.1002/wene.372.
- National Level Policy. n.d. Accessed July 2, 2023. https://e-amrit.niti.gov.in/national-level-policy.
- The OECD. n.d. Conversion rates – Purchasing power parities (PPP) – OECD Data. Accessed July 2, 2023. http://data.oecd.org/conversion/purchasing-power-parities-ppp.htm.
- Overview | Government of India | Ministry of Power. n.d. Accessed July 2, 2023. https://powermin.gov.in/en/content/overview.
- Prina, M. G., G. Manzolini, D. Moser, R. Vaccaro, and W. Sparber. 2020. “Multi-Objective Optimization Model EPLANopt for Energy Transition Analysis and Comparison with Climate-Change Scenarios.” Energies 13: 3255. https://doi.org/10.3390/en13123255.
- Protection of Environment | Government of India | Ministry of Power. n.d. Accessed July 2, 2023. https://powermin.gov.in/en/content/protection-environment.
- Renewable Energy Finance – 1st Edition. n.d. Accessed July 2, 2023. https://shop.elsevier.com/books/renewable-energy-finance/raikar/978-0-12-816441-9#full-description.
- Requia, W. J., M. Mohamed, C. D. Higgins, A. Arain, and M. Ferguson. 2018. “How Clean are Electric Vehicles? Evidence-Based Review of the Effects of Electric Mobility on air Pollutants, Greenhouse gas Emissions and Human Health.” Atmospheric Environment 185: 64–77. https://doi.org/10.1016/j.atmosenv.2018.04.040.
- Ritchie, H., M. Roser, and P. Rosado. 2020. CO₂ and Greenhouse Gas Emissions. Our World Data.
- Robinius, M., A. Otto, K. Syranidis, D. S. Ryberg, P. Heuser, L. Welder, et al. 2017. “Linking the Power and Transport Sectors—Part 2: Modelling a Sector Coupling Scenario for Germany.” Energies 10: 957. https://doi.org/10.3390/en10070957.
- Satapathy, S., H. Jena, and S. Sahu. 2023. “Sustainability and Safety Challenges in Mining Transportation by Railway in India.” In Transportation Systems Technology and Integrated Management, edited by R. K. Upadhyay, S. K. Sharma, V. Kumar, and H. Valera, 287–302. Singapore: Springer Nature. https://doi.org/10.1007/978-981-99-1517-0_13.
- Shastri, S., G. Mohapatra, and A. K. Giri. 2020. “Economic Growth, Renewable and Nonrenewable Energy Consumption Nexus in India: Evidences from Nonlinear ARDL Approach and Asymmetric Causality Analysis.” International Journal of Energy Sector Management 14 (4): 777–792. https://doi.org/10.1108/IJESM-06-2019-0016.
- Singh, N., T. Mishra, and R. Banerjee. 2020. “Projection of Private Vehicle Stock in India up to 2050.” Transportation Research Procedia 48: 3380–3389. https://doi.org/10.1016/j.trpro.2020.08.116.
- Singh, N., T. Mishra, and R. Banerjee. 2022. “Emission Inventory for Road Transport in India in 2020: Framework and Post Facto Policy Impact Assessment.” Environmental Science and Pollution Research 29 (14): 20844–20863. https://doi.org/10.1007/s11356-021-17238-3.
- Sobha, P. 2022. “Decarbonizing Indian Electricity Grid.” In Innovations in Electrical and Electronic Engineering, edited by S. Mekhilef, R. N. Shaw, and P. Siano, 312–322. Singapore: Springer Nature. https://doi.org/10.1007/978-981-19-1742-4_26.
- Sontakke, U., and S. Jaju. 2021. “Green Hydrogen Economy and Opportunities for India.” IOP Conference Series: Materials Science and Engineering 1206 (1): 012005. https://doi.org/10.1088/1757-899X/1206/1/012005.
- SpringerLink. n.d. Linear Programming: Foundations and Extensions. Accessed July 2, 2023. https://link.springer.com/article/10.1057palgrave.jors.2600987.
- UNDP. n.d. World Energy Assessment: Energy and the Challenge of Sustainability | United Nations Development Programme. Accessed July 2, 2023. https://www.undp.org/publications/world-energy-assessment-energy-and-challenge-sustainability.
- UNFCCC. n.d. India. Biennial update report (BUR). BUR3. Accessed July 2, 2023. https://unfccc.int/documents/268470.
- United Nations projects. U N. n.d. Nations U. India to overtake China as world’s most populous country in April 2023. Accessed July 2, 2023. https://www.un.org/en/desa/india-overtake-china-world-most-populous-country-april-2023-united-nations-projects.
- Vahan Sewa | Dashboard. n.d. Accessed July 2, 2023. https://vahan.parivahan.gov.in/vahan4dashboard/.
- Vidhi, R., and P. Shrivastava. 2018. “A Review of Electric Vehicle Lifecycle Emissions and Policy Recommendations to Increase EV Penetration in India.” Energies 11: 483. https://doi.org/10.3390/en11030483.
- World Bank Open Data. n.d. World Bank Open Data. Accessed July 2, 2023. https://data.worldbank.org.
- Zakari, Y., F. Vuille, and M. Lehning. 2022. “Climate Change Impact Assessment for Future Wind and Solar Energy Installations in India.” Frontiers in Energy Research 10: 859321. https://doi.org/10.3389/fenrg.2022.859321.
- Zhang, S., Y. Yu, A. Kharrazi, and T. Ma. 2023. “How Would Sustainable Transformations in the Electricity Sector of Megacities Impact Employment Levels? A Case Study of Beijing.” Energy 270, https://doi.org/10.1016/j.energy.2023.126862.