
 ?Mathematical formulae have been encoded as MathML and are displayed in this HTML version using MathJax in order to improve their display. Uncheck the box to turn MathJax off. This feature requires Javascript. Click on a formula to zoom.
ABSTRACT
Self-harvesting and consumption of electrical energy from a small-scale photovoltaic (PV) system became quite a beneficial option for households who seek for an economical, independent and environment-friendly power alternative. However, in practice, prosumers without battery storage systems face some energy flow management issues, when only part of the generated energy is consumed instantly in place, while the rest is exported to the distribution grid or simply lost. The paper examines profiles of some preselected prosumers with small-scale PV installations with the purpose to evaluate losses caused by the inability to consume instantly all generated energy and thus resulting in redundant energy exchange between prosumer’s microgrid and distribution grid. The analysis reveals certain anomalies, when local PV system produces enough power to cover all the electricity demand of the household, but energy is still imported from the DSO grid at the same time. These simultaneous flows of import and export active energy were calculated and showed quite significant numbers. The paper digs into this problem through a quantitative evaluation of energy flows within one preselected microgrid using one-second resolution experimental data. The results presented here help us distinguish the main factors leading to inefficient distribution of generated power in households.
1. Introduction
Climate change has become one of the greatest challenges of today’s society. According to the International Energy Agency (IEA) report (Climate Change Citation2023), energy accounts for two-thirds of total greenhouse gas, which means the energy sector is the central player in efforts to reduce emissions and mitigate climate change. European Union (EU) countries set a goal to become climate-neutral by 2050, as stated in the European Green Deal (“Energy and the Green Deal” Citation2023). One of the EU Clean Energy Package (CEP) (“Clean Energy for All Europeans Package” Citation2019) directives, establishes an ambitious plan, according to which renewable electricity will constitute at least 32% of total electricity generation by 2030 (later EU Commission proposed a few revisions of the package to accelerate the take-up of renewables in the EU and to reach at least 45% by 2030) (“European Parliament” Citation2022). It also invites citizens to play an active role in the development of renewables by enabling renewable energy communities and self-consumption of renewable energy.
Self-generation and self-consumption of renewable electrical energy can provide financial, environmental and security benefits for households, grid operators and society at large (Strielkowski et al. Citation2021). However, rapid expansion of renewables within households brings some unexpected challenges both to the users and grid operators, since the conventional grid suffers resulting changes in energy flows. In this paper, we will focus on a situation of households with small solar plants in Lithuania who participate in the electricity trade market as prosumers (the energy-producing consumers). The paper examines profiles of some preselected prosumers with small (under 30 kW) photovoltaic (PV) installations and analyses some typical self-consumption efficiency-related issues and limitations.
2. Current situation of PV prosumers
In Lithuania, as in the rest of Europe, a rapid growth in the popularity of solar power plants among private sector households has been observed over the last few years. This was particularly encouraged by the drop in technology costs and the increase in the number of service providers as well as financial support from a country’s government, which made PV installations the most cost-effective and widely available alternative for households (Bertsch, Geldermann, and Lühn Citation2017; Bórawski, Holden, and Bełdycka-Bórawska Citation2023; Fernández, Payán, and Santos Citation2021; Wicki, Pietrzykowski, and Kusz Citation2022). This tendency probably will remain in the future as the EU and member state governments actively support the solar energy development strategy (“EU Market Outlook” Citation2023; “EU Solar Energy Strategy” Citation2022).
Theoretically, the optimal utilisation of self-generated PV electrical energy would be if all this energy were immediately consumed in a local microgrid (a single household or community). Unfortunately, this goal is not easily achievable due to different generation and consumption patterns (Interreg Europe Citation2020). Therefore, self-consumption can cover only a part of the energy demand, while some excess generated energy is supplied to the Distribution System Operator’s (DSO) grid (Fernández, Payán, and Santos Citation2021; McKenna, Pless, and Darby Citation2018). Higher rates of self-consumption can be achieved by other means (e.g. integrating of battery storage systems (Ciocia et al. Citation2021; Hassan et al. Citation2023; Luthander et al. Citation2015; Stephant et al. Citation2021), hot water heating appliances (Amabile et al. Citation2021; Pater Citation2023), smart energy management systems (Balakumar et al. Citation2022; Fustero et al. Citation2023), though with additional costs).
The problem on the larger scale stems from the limitations of conventional power grids, which have been focused on large, centralised power plants and one-way transmission and distribution. Distributed renewables make grid management more complicated because of their variability and intermittency, which generally makes matching supply and demand difficult. The growing number of prosumers in the grid only worsens the situation.
The disparity between self-generated PV electricity and household electricity consumption generally means that most of the electricity is generated during the day when people are (usually) not at home, and peak electricity consumption is in the morning and evening (Interreg Europe Citation2020). Storing the energy produced during the day and using it when it is most needed would be the right solution. A report from the European Commission reveals that with a locally installed energy storage system, the electricity self-consumption rate of an average Central European household with PV could increase up to 75% from 30% without it (Interreg Europe Citation2020; SWD Citation2015). However, batteries remain an expensive option for small users, and until their cost comes down and their capacity improves, high costs and long amortisation mean that they are unlikely to be widely adopted. Until these technologies mature, intermittency will remain a key issue.
One solution that does not require energy storage is the adjustment of individual energy consumption pattern and shifting most power-demanding consumption to midday hours (Afzalan and Jazizadeh Citation2019; Luthander et al. Citation2015; Öhrlunda et al. Citation2020). This can be achieved with smart devices that can be programmed to run at a given time. However, load shifting will require not only technological innovations, but also behaviour change efforts, which might be challenging and even unacceptable for some users.
Yet another way to increase self-consumption is cooperation between neighbouring individual prosumers by forming closed communities of prosumers. Collaboration between them in terms of energy generation, sharing and accumulation, helps to minimise a total mismatch between generated and demanded power within community (Balakumar et al. Citation2022; González-Romera et al. Citation2019; Hassan et al. Citation2023; Stephant et al. Citation2021; Tercan et al. Citation2022). Despite having many advantages over the individual prosumer, communities are still a relatively new option whose prevalence will depend on legal, financial and social incentives in each country.
Lithuania promotes an alternative way of energy storage for small-scale prosumers (Ciocia et al. Citation2021). According to the Law on Energy from Renewable Sources (Citation2011), excess electricity produced by a solar installation can be fed into the DSO grid and sent back to the self-generating prosumers when electricity is not produced (net-metering). For the self-generated and consumed amount of electricity prosumers are exempt from paying any taxes. However, they have to pay the fee for the use of the electricity grid (it was 0.04477 €/kWh in 2022) set by the National Commission for Energy Control and Prices (NCC). Despite the fact that the fee is relatively small today, it has a tendency to increase yearly along with the increase numbers of active prosumers in the grid.
Distribution and network costs are no less important aspects in the final electricity price estimation (Hennig et al. Citation2022). The retail price of electricity is comprised of three parts: the energy itself, transmission and distribution costs, and taxes/surcharges (Ciocia et al. Citation2021; CEER Paper on Electricity Distribution Tariffs Supporting the Energy Transition Citation2020). In practice, only those who consume electricity from the DSO grid pay the full price. Articles 15 and 16 of Directive (EU) 2019/944 of the European Parliament (Directive (EU) Citation2019) state that active consumers and citizen energy communities should be subject to network charges that account separately for the electricity fed into the grid and the electricity consumed from the grid. This applies to prosumers that use the grid metering service, which allows the grid to be used as a backup system for their excess power production and to partially avoid electricity transmission and distribution charges. If the current distribution network tariff system was reviewed, this would probably mean higher charges for all grid-connected prosumers. It should also encourage them to use behind-the-meter storage and use as much locally generated energy as possible, rather than choosing grid-scale storage solutions.
There is another important issue related to the exchange of energy between the DSO and the consumer microgrid, which arises in practice and is rarely discussed in the literature: a number of residential electricity consumers with photovoltaic systems connected to the local three-phase microgrid report about inefficient energy distribution between the local grid and the DSO grid. According to their solar inverter monitoring data, the energy produced by local PV systems during certain hours is sufficient to meet the local demand (excess energy is even transferred to the DSO grid), but at the same time, additional energy is consumed from the DSO grid. This means a double energy feed which results in additional costs for the household and unnecessary load on the grid. Although this problem is relevant to many users, there is no wider discussion on its causes and ways to solve it. Next, we will analyse the situation at prosumers end in detail.
3. Analysis of prosumers profiles
In order to assess the nature and extent of the problem, the historical data of grid users’ electricity consumption profiles throughout the year 2020 in Lithuania were collected and studied. Then the daily graphs of electricity exchange between the DSO grid and 32 different prosumers’ household grids (microgrids) with solar PV installations located across different Lithuania regions were selected and used for analysis. During that period, the selected prosumers did not use any power accumulators (battery systems, hot water tanks, etc.). The data were obtained from standard three-phase smart meters with remote data transfer function. Each set of recorded data included numerical values of accumulated hourly imported energy Ec (taken from the DSO grid and consumed locally) and exported energy Eg (excess of the generated in PV system, which was transferred to the DSO grid) covering the period from 1 January 2020 to 31 December 2020.
A standard bidirectional smart meter measures the average of import and export active power and
values over the ith time interval
. The import and export energy values
and
are calculated by integrating power values:
(1)
(1) where
and
are the import and export energy over ith time interval, respectively, and
is the number of time intervals.
In the case of the three-phase household microgrid, the values of and
are found as follows:
(2)
(2) where
,
,
are import energies from DSO grid and
,
,
are export energies through three-phase lines
,
and
over ith time interval.
Analogously, the values of and
are found as follows:
(3)
(3) where
,
,
are imported and
,
,
are exported power values over ith time interval in three-phase lines
,
and
.
Smart meters used in households have a time interval equal to 1 h, so they record the energy in kilowatt-hours (kWh). Each data set of
and
had an array of 365 × 24 = 8760 lines. For better clarity, we introduced an additional index j, which denotes the number of the day in the year (
,
). Since both the imported power
and exported power
were accumulated during 1-h period (
= 1 h), the numerical values of energies correspond to kWh. illustrate a full year data of
and
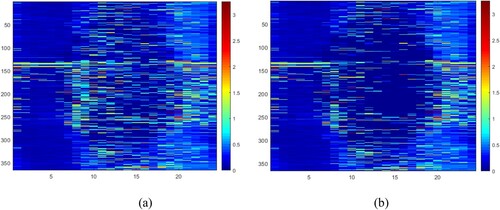
from the three typical households with different installed power ratings. The X-axis represents the hours of the day, and the Y-axis represents the days of the year. Exported and imported power is shown in colour, which value in kW is denoted in a vertical colour bar on the right.
Figure 1. Yearly distribution of exported power Pgij (a) and imported power Pcij (b) in kW of the household No. 1. Total installed power – 4 kW.
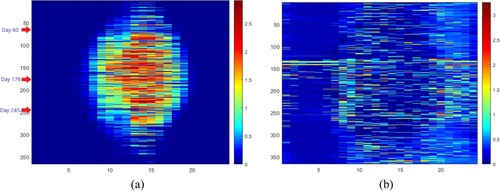
Figure 2. Yearly distribution of exported power Pgij (a) and imported power Pcij (b) in kW of the household No. 5. Total installed power – 15 kW.
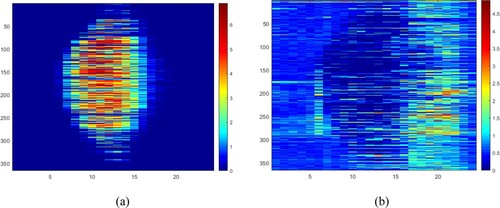
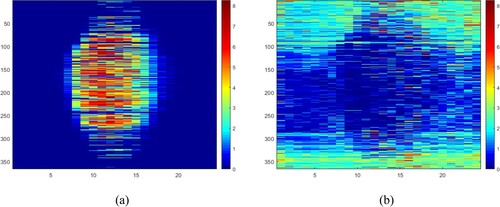
Figure 3. Yearly distribution of exported power Pgij (a) and imported power Pcij (b) in kW of the household No. 8. Total installed power – 20 kW.
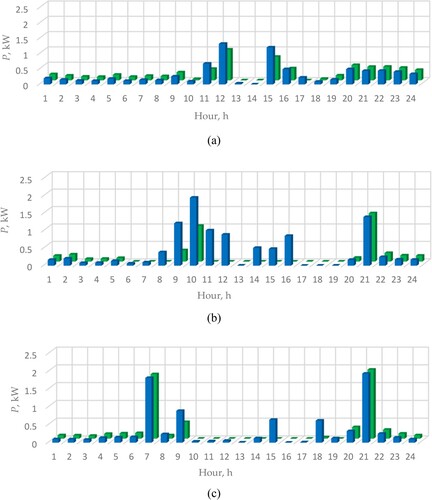
It is easy to track overlaps of import and export power within given datasets during daytime, when the PV system excess energy is exported yet another energy is imported from the DSO grid at the same time. To see this situation in more detail, gives three examples of hourly distribution of the imported power (blue columns) and exported power
(red columns) over the jth day (Δt = 1 h, i = 1 … 24) for the household, which yearly data are presented in (certain days are marked with the red arrows in ).
Figure 4. A detailed view of imported power Pcij (blue columns) and exported power Pcij (red columns) distribution during certain days: 60th (a), 176th (b) and 245th (c).
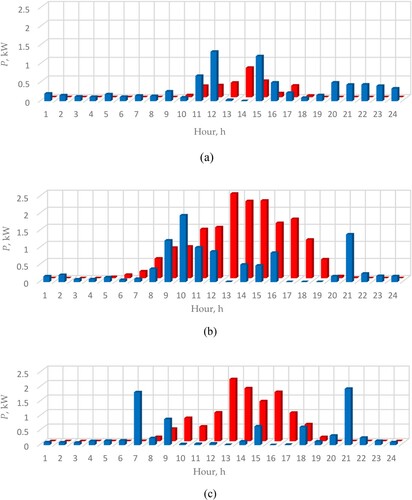
As a particular example, we can take hours 8:00, 11:00 and 12:00 in (b), when power is consumed from the DSO grid (blue columns), although the power exported to the DSO grid at that time (red columns) is higher and would be enough to cover all demand. Even if generation was not enough to meet the full demand like during hours 9:00 and 10:00, it would still be possible to substantially reduce power import by utilising locally generated energy. The data from the last day of February and the first day of September are shown in (a,c). It can be observed here that even with lower PV generation and different consumption pattern, the above-mentioned problem remains relevant.
In order to quantify the amount of energy transferred inefficiently in this way, the calculations were made using the original measurement data. As it was shown above, during each 1-h time interval , both import and export power can flow through a smart meter.
The difference of these two powers during ith hour:
(4)
(4)
A positive value indicates that the PV system generates enough power (energy) and part of this power can be used to fully compensate import. This condition is valid for all periods where the generation is not equal to zero. When
is negative, all power generated by PV system could be used to partially compensate import, since generation is not enough to cover all local demand. To use the full potential of the local PV system and obtain maximum benefits from it, the priority must always be the maximum utilisation of locally generated energy instead of imported. In this case the total amount of reduced export power
could be
(5)
(5) and the deficient amount of power
, that must be imported anyway
(6)
(6)
Equations (5) and (6) define the condition of energy flows optimisation we aim for. A comparison between the original imported power and the potentially reduced imported power
during one year for the object shown in is given in .
Figure 5. Comparison between the measured imported power Pcij (a) and the optimised imported power (b) in kW over the year.
shows more detailed pictures of both measured and calculated imported power during the three preselected days mentioned above (). Here we can notice that even with a small PV generation ((c)), such a system can be used more efficiently and a certain amount of energy import still can be reduced. However, this effect depends on PV generation: during long sunny summer days, the decrease in power import is more significant than during spring or autumn periods. In the winter period generation is very low, so the improvement is negligible.
Figure 6. A detailed view of measured imported power Pcij (blue columns) and optimised imported power (green columns) during the three aforementioned days: 60th (a), 176th (b) and 245th (c).
A total decrease of the imported power over the jth day can by expressed as
(7)
(7) and over the year
(8)
(8) where M is the number of hours in a day and N is the number of days in a year.
shows the calculated values of imported power and exported power
of the potentially optimised microgrid for the same household during the same three days of the year.
Figure 7. Calculated optimised imported power (green columns) and optimised exported power
(orange columns) over the three days of the year: 60th (a), 176th (b) and 245th (c).
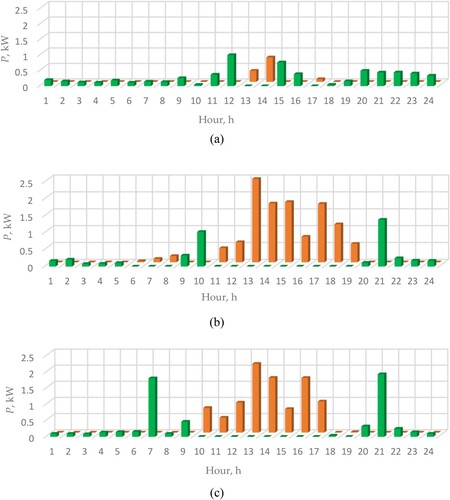
Comparing these data with the measured data presented in , we see a decrease in both imported and exported power flows between the DSO grid and the household microgrid. Besides, no overlaps of imported and exported power are present in those examples. In order to quantify the power flows over the jth day for each household, total imported power , total exported power
and a ratio
of these quantities were calculated:
(9)
(9)
This ratio shows what part of the power is exported to the DSO grid during the jth day of the year, comparing it with the total power imported from the grid on the same day.
Another important parameter , which represents the ratio of the decrease of imported power
after microgrid optimisation and the original imported power
, was calculated:
(10)
(10)
This parameter shows the theoretical relative reduction of import power on the jth day after microgrid optimisation, when energy flow overlaps during each hour are eliminated. Both parameters and
were calculated for all 32 households for each day of the year. shows the results for the three preselected days of the household mentioned in .
Table 1. Analytical data for the three days of the household from .
It can be seen from the table that when the power generated by the PV system is high (176th day), the total amount of decrease of the imported power per day after optimisation is up to 60.3% of the total power import before optimisation. In the case of a lower PV generation, this percentage value is lower as well, but also significant: 19.4% on the 60th day, and 27.1% on the 245th. The transfer of this energy to the DSO grid puts an additional load on it, which requires additional investments in increasing the power of the DSO grid and developing its infrastructure. The table also shows a certain correlation between and
, which is not coincidental, since both of them depend on PV generation and power export.
In a similar way, the above-mentioned accumulated parameters over the year were calculated for all 32 households. The preliminary results were published in our previous work (Šiupša et al. Citation2022). Total decrease of the imported power over the year
(11)
(11) and the ratios
and
:
(12)
(12)
(13)
(13) where M is the number of hours in a day and N is the number of days in a year.
Both these ratios represent some mean values over the year; however, the range of their dispersion might be much larger, since they are an outcome of coincidental interaction between fluctuating PV generation and erratic electricity consumption. Therefore the additional parameter – the standard deviation of daily parameter – was used to describe the dispersion of power import decrease over one year:
(14)
(14) where
is the average of
over the year.
All 32 households were arranged in ascendant order according to installed power, and parameters ,
,
were calculated for each of them. summarises the calculated results with 8 typical households’ data.
Table 2. Analytical data of household power import/export during the year of 2020.
The results apparently demonstrate dependence between installed power and ratio r0Y: the highest ratio is observed at the lowest installed power and it decreases as this power increases. This means the prosumers with the lower power installations (naturally, lower annual energy consumption as well) can expect greater benefits from microgrid power flows optimisation.
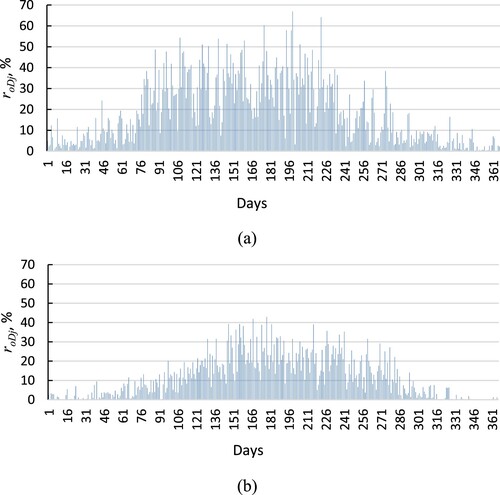
Household No.1 has the highest value among all 32 households. Also households with lower power installation have a slightly higher dissipation of parameter
. In order to better understand the distribution law of the parameter
and its origin, it was graphically depicted in for each day of the year for two households: household No. 1, which has the lowest installed power and household No. 8 with the highest installed power. It can be seen from the figure that the maximum values of the parameter coincide with the periods of maximum generation, i.e. during the summer months. In the winter period, the parameter values drop down close to zero. Other factors, like total installed power, individual consumption pattern, have little effect on the nature of the parameter variation.
Figure 8. The distribution of parameter r0Dj during the year for household No. 1 (a) and household No. 8 (b).
Parameter describes how installed PV system power corresponds to household yearly power demand. As we can see from , the best situation is in households No.1 and No.5, where ratio
is close to 100%. However, ratio
has no significant influence on
, which is obvious from households No.5 and No.6 situation: both of them have the same installed power and very different power demand but still similar r0Y values.
4. Experimental research of microgrid power flows
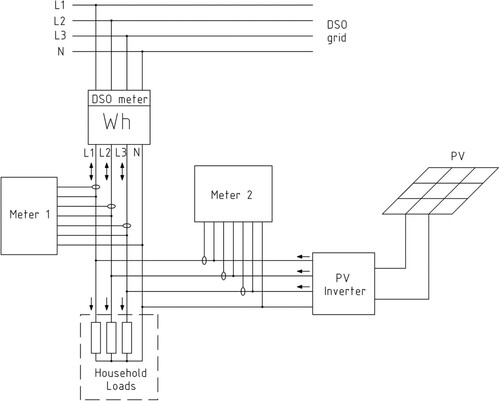
The results presented in the previous section showed a significant portion of energy transfer in both directions between prosumers microgrid and DSO grid during each hour of a day. The data of exported and imported power used in our research were obtained from the standard DSO smart meter, where power is averaged over the course of each hour and summed over all three-phase lines data. In our previous work (Šiupša et al. Citation2022) we raised a hypothesis that situations with bidirectional power flows arise due to the asymmetric and time-varying phase load distribution of the three-phase household grid, when one heavily loaded microgrid line consumes both PV-generated and DSO grid power, while others two consume and export only PV generated excess power at the same time. However, there might be other reasons for this phenomenon, like variation in solar irradiation intensity or high power load switching during 1-h period. In order to investigate the power consumption and generation processes in a household microgrid with a PV power plant in more detail, an additional experiment was carried out. The experiment took place in one selected household, with three-phase microgrid of 20 kW total power installed and PV system with no backup. The scheme of the experiment equipment is shown in . Measurements were made with two smart bidirectional electricity meters – Meter 1 and Meter 2 – which measure power flow on each of three-phase lines. These two meters were connected to the measuring lines via current transformers, which are factory calibrated with each meter to ensure accuracy. The measuring accuracy of the meters is 1% and the maximum time resolution is 1 s. Meter 1 measures the imported and exported power, while Meter 2 measures the power generated by the PV plant. Meter 2 can measure the power flow from household microgrid to the PV plant, however in practice it was small, used for PV inverter’s own use only, and therefore was neglected. The meters have been configured to continuously send every second measured data to the SQL server. All data accumulated on the server were further processed according to the methodology described in Section 4, taking into account the fact that in this case the period is equal to 1 s. The hourly data from the standard DSO smart meter were collected as well. The period of data collection covered the months of February–May 2023. Such a structure allowed not only to assess the dynamism of ongoing processes more accurately but also to estimate the impact of the power generated by the PV plant on both household consumption and export. In addition, this made it possible to evaluate the ongoing processes in each phase line of a three-phase microgrid.
Figure 9. Scheme of experiment equipment arrangement.
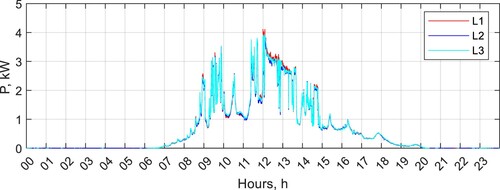
As an example, shows the data obtained from the Meter 2 on 9 April 2023. These data reflect the fluctuations of solar radiation during the day. As mentioned above, Meter 2 measures generated power values over i-th one-second time interval on three-phase lines L1, L2 and L3. Let us denote these power values as ,
and
. These values with one-second time resolution are shown in red, blue and green, respectively, and time is expressed in hours on the X-axis. As we see, power generation begins approximately from 7:00 and lasts till 20:00 and all three curves practically coincide, which indicates, that the inverter of PV system is symmetrical, i.e. it distributes generated power evenly across all phase lines.
Figure 10. Generated power in each power line during one day.
Power consumed by the household in each power line , (x = 1, 2, 3) during nth one-second time interval can be calculated as follows:
where x = 1, 2, 3 is number of power line;
and
are exported and imported powers, measured by Meter 1 on the Lx line.
shows an example of power calculated with one-second time resolution during the same day as in (a) shows consumed power
in line L1, (b,c) shows consumed power
and
in lines L2 and L3, respectively. Similarly, the imported
power and exported power
from Meter 1 during the same day are presented in . Here the values of imported power are shown as negative quantities.
Figure 11. Consumed power in three power lines: L1 (a), L2 (b) and L3 (c).
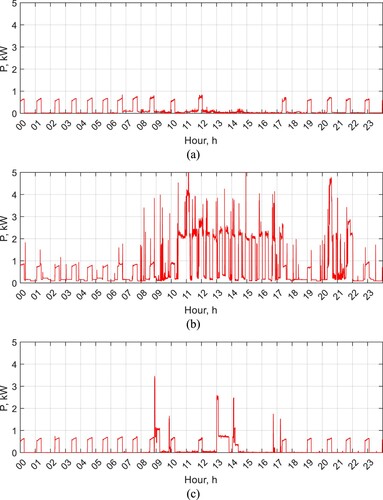
Figure 12. Daily imported (red line) and exported (blue line) power in power lines L1 (a), L2 (b) and L3 (c).
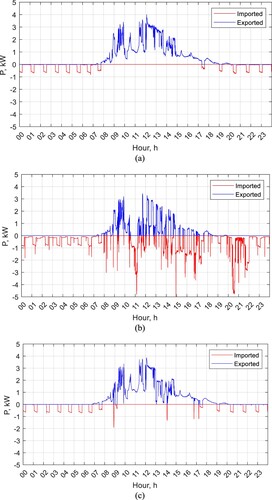
It is obvious from the consumption graphs () that the lines in household are loaded asymmetrically. The asymmetry is especially evident between 8:00 and 18:00 and between 20:00 and 23:00, when energy consumption in the line L2 increases prominently.
Since the load on lines L1 and L3 is low, when the PV system generates power (approx. between 8:00 and 20:00, ), almost all of this power is exported ((a,c)). However, the line L2, which had a high load at that time, do not always have enough solar power and then the power needed to be imported ((b)). Thus, there are certain time intervals when at the same moment line L2 is importing power and lines L1 and L3 are exporting excess of power, i.e. instantaneous bidirectional power flows occur between the household microgrid and the DSO grid.
Obviously, the problem of bidirectional power flows arises, when the PV plant generates a power. This problem becomes particularly noticeable when the generation of the PV system exceeds the demand of the household grid in at least one of the three-phase lines, and in at least one of other lines, this generated power is insufficient due to the heavy load there. The power generated by the household PV system depends on solar radiation and is a slow process compared to the process of load variation. This is well illustrated in , where an example of data observed in a household for an incomplete minute time interval is provided. These are data obtained in one afternoon of February 2023. The X-axis represents the time of day (one-second time resolution), while the Y-axis represents the power generated by the PV system (data acquired from Meter 2, blue shade columns) and imported and exported power (data acquired from Meter 1, brown shade columns) every second in each of the three-phase lines. Imported power data are depicted as columns of negative values.
Figure 13. Example of power flows switching in three-phase microgrid during 1-min time interval.
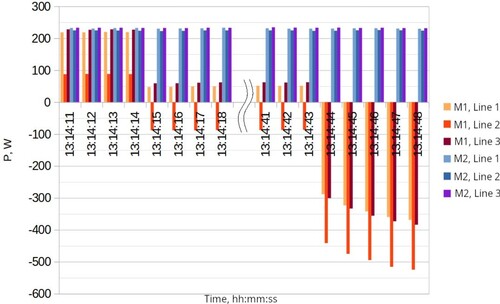
From the power histogram in , it can be seen that the power generated by the PV system (blue shade columns) over the considered period of time from 13:14:11 to 13:14:48 practically does not change and is approximately the same in all three-phase lines. It also means that during this period the solar radiation is constant and the PV inverter generates symmetrical power in all three-phase lines. Examining the power histogram of Meter 1, we can distinguish three operating modes in the microgrid with PV plant:
In the time interval 13:14:11–13:14:14, the electricity consumption in lines L1 and L3 is very low and almost all the power produced by the PV system in these lines is exported. There is a little bit higher household consumption in the line L2, but the power generated by the PV system is sufficient to cover this consumption, so the rest of the power is also exported. Thus, the household microgrid generates exportable power in all lines.
In the interval 13:14:15–13:14:43, a mid-power three-phase energy-consuming equipment is switched on in the microgrid, the power consumption of which is still covered by the PV plant in lines L1 and L3. An additional load is connected to the line L2 and the PV generation is no longer sufficient to meet this demand, so the deficient amount of power is imported. Thus, the household microgrid exports power through lines L1 and L3, and imports power through line L2.
In the time interval 13:14:44–13:14:48, a powerful three-phase equipment is switched on in the microgrid and the energy generated by the PV system is no longer enough, so the household microgrid imports energy through all three lines L1, L2, and L3.
This shows that the operating modes of the household three-phase microgrid can change very fast: depending on the variation of microgrid load, the ratio of imported and exported power in three-phase lines may change several times per minute. Therefore, evaluating these processes with 1-h power flow measurement resolution, as used in standard meters, is not accurate.
To compare the effect of resolution, the parameter was calculated using one-second and one-hour resolution data acquired over the same time period. Data from 84 days obtained from February to April 2023 were used to calculate this parameter. The one-hour resolution data of the exported power
and imported power
were recalculated from the one-second (s) resolution data by accumulating the data per hour in each three-phase power line and summing the data of all lines:
(16)
(16) where H is a number of seconds per hour (H = 3600) and x = 1, 2, 3 is the number of power line.
The daily parameter was calculated according to the methodology presented in Chapter 3, using both one-second (s) resolution and one-hour (h) resolution data:
(17)
(17)
A total reduction of the imported power and
over the jth day was calculated according to (6) and (7) formulas, keeping in mind, that M = 24 at (h) resolution and M = 86,400 at (s) resolution.
Total imported power over the jth day by one-hour data resolution:
(18)
(18) where M is the number of hours in a day (M = 24).
The results of calculations are presented in . Parameter percentage values calculated with one-hour resolution data are shown in blue, and values
using one-second resolution data are shown in red.
Figure 14. Distribution of calculated parameter using 1-h time resolution data (blue columns) and one-second time resolution data (red columns) during 82-day period.
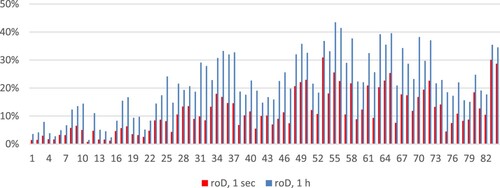
From the obtained results, it can be seen that using more accurate one-second resolution data, values of the parameter are approximately two times smaller than values of parameter
. The average of
over certain 84-day period is 11%, and the average of
is 21%. We can reasonably state that one-second resolution allows to eliminate the influence of factors that change slowly in time, such as the variation of the intensity of the sun or load switching. In this way, the main factor causing double power flows remains the asymmetric phase load distribution of the three-phase grid.
5. Conclusions
The rapid growth of small-scale PV system installations within households brings some unexpected challenges regarding the effective management of PV-generated power flows in three-phase microgrid.
An analysis of data from DSO smart meters in 32 prosumer households has revealed that, despite sufficient PV generation, these households continue to import energy from the grid at the same time. It was calculated that the yearly overlap of imported and exported energy was approximately from 6% to 18% and varies between different households. On specific days this ratio reaches 60% and more. The highest
values are observed at the lowest installed power and it decreases at higher power. This means the prosumers with the lower power installations and lower consumption can expect greater benefits from microgrid power flows optimisation.
Another benefit is for grid operator, since the power flows optimisation reduces load on the DSO grid and saves resources of its infrastructure.
To determine factors of power flow overlaps during a 1-h period, the experimental data from one household were collected, using one-second time resolution smart meters. Analysis of one-second resolution data showed that approximately half of bidirectional power flows arise due to the asymmetric and time-varying phase load distribution of the three-phase household grid. Another half is due to other reasons like variation in solar irradiation intensity or high power load switching during a 1-h period. An experimental study involving more households is needed to achieve a more accurate estimate of this distribution.
Disclosure statement
No potential conflict of interest was reported by the author(s).
Correction Statement
This article has been corrected with minor changes. These changes do not impact the academic content of the article.
Additional information
Funding
References
- Afzalan, M., and F. Jazizadeh. 2019. “Residential Loads Flexibility Potential for Demand Response Using Energy Consumption Patterns and User Segments.” Applied Energy 254: 17 p. https://doi.org/10.1016/j.apenergy.2019.113693.
- Amabile, L., D. Bresch-Pietri, G. El Hajje, S. Labbé, and N. Petit. 2021. “Optimizing the Self-Consumption of Residential Photovoltaic Energy and Quantification of the Impact of Production Forecast Uncertainties.” Advances in Applied Energy 2: 100020, 11 p. https://doi.org/10.1016/j.adapen.2021.100020.
- Balakumar, P., T. Vinopraba, S. Sankar, S. Santhoshkumar, and K. Chandrasekaran. 2022. “Smart Hybrid Microgrid for Effective Distributed Renewable Energy Sharing of PV Prosumers.” Journal of Energy Storage 49: 104033, 21 p. https://doi.org/10.1016/j.est.2022.104033.
- Bertsch, V., J. Geldermann, and T. Lühn. 2017. “What Drives the Profitability of Household PV Investments, Self-Consumption and Self-Sufficiency?” Applied Energy 204: 1–15. https://doi.org/10.1016/j.apenergy.2017.06.055.
- “Best Practices on Renewable Energy Self-Consumption | Accompanying the Document Communication from the Commission to the European Parliament, the Council, the European Economic and Social Committee and the Committee of the Regions Delivering a New Deal for Energy Consumers.” 2015. Commission Staff Working Document SWD (2015) 141 final. Brussels, July 15. Accessed January 31, 2023. https://eur-lex.europa.eu/legal-content/EN/ALL/?uri=CELEX:52015SC0141.
- Bórawski, P., L. Holden, and A. Bełdycka-Bórawska. 2023. “Perspectives of Photovoltaic Energy Market Development in the European Union.” Energy 270: 126804, 19 p. https://doi.org/10.1016/j.energy.2023.126804.
- “CEER Paper on Electricity Distribution Tariffs Supporting the Energy Transition.” 2020. Ref: C19-DS-55-04, April 20. Council of European Energy Regulators. Accessed January 31, 2023. https://www.ceer.eu/documents/104400/-/-/fd5890e1-894e-0a7a-21d9-fa22b6ec9da0.
- Ciocia, A., A. Amato, P. Di Leo, S. Fichera, G. Malgaroli, F. Spertino, and S. Tzanova. 2021. “Self-Consumption and Self-Sufficiency in Photovoltaic Systems: Effect of Grid Limitation and Storage Installation.” Energies 14 (6): 1591, 24 p. https://doi.org/10.3390/en14061591.
- “Clean Energy for All Europeans Package.” 2019. Accessed January 31, 2023. https://energy.ec.europa.eu/topics/energy-strategy/clean-energy-all-europeans-package_en#documents.
- Climate Change. 2023. “Energy Sector is Central to Efforts to Combat Climate Change.” Accessed January 31, 2023. https://www.iea.org/topics/climate-change.
- “Directive (EU) 2019/944 of the European Parliament and of the Council of 5 June 2019 on Common Rules for the Internal Market for Electricity and Amending Directive 2012/27/EU.” 2019. Official Journal of the European Union, June 14. Accessed January 31, 2023. https://eur-lex.europa.eu/legal-content/EN/TXT/PDF/?uri=CELEX:32019L0944.
- “Energy and the Green Deal.” 2023. Accessed January 31, 2023. https://commission.europa.eu/strategy-and-policy/priorities-2019-2024/european-green-deal/energy-and-green-deal_en.
- “EU Market Outlook for Solar Power 2022–2026.” 2023. Accessed January 31, 2023. https://api.solarpowereurope.org/uploads/5222_SPE_EMO_2022_full_report_ver_03_1_319d70ca42.pdf.
- “EU Solar Energy Strategy.” 2022. Communication from the Commission to the European Parliament, the Council, the European Economic and Social Committee and the Committee of the Regions COM (2022) 221 final. Brussels, May 18. Accessed January 31, 2023. https://eur-lex.europa.eu/legal-content/EN/TXT/?uri=COM%3A2022%3A221%3AFIN.
- “European Parliament Backs 45% Renewable Energy Goal for 2030.” 2022. September 14. Accessed January 31, 2023. https://www.euractiv.com/section/energy-environment/news/european-parliament-to-adopt-a-45-renewable-energy-goal-for-2030.
- Fernández, J. M. R., M. B. Payán, and J. M. R. Santos. 2021. “Profitability of Household Photovoltaic Self-Consumption in Spain.” Journal of Cleaner Production 279: 123439, 161 p. https://doi.org/10.1016/j.jclepro.2020.123439.
- Fustero, C., A. Clemente, R. Costa-Castelló, and C. Ocampo-Martinez. 2023. “Energy Management Using Predictive Control and Neural Networks in Microgrid with Hybrid Storage System.” In 2023 IEEE 28th International Conference on Emerging Technologies and Factory Automation (ETFA), 1–8, Sinaia, Romania. https://doi.org/10.1109/ETFA54631.2023.10275493.
- González-Romera, E., M. Ruiz-Cortés, M.-I. Milanés-Montero, F. Barrero-González, E. Romero-Cadaval, R. A. Lopes, and J. Martins. 2019. “Advantages of Minimizing Energy Exchange Instead of Energy Cost in Prosumer Microgrids.” Energies 12 (4): 719. https://doi.org/10.3390/en12040719.
- Hassan, Q., M. K. Abbas, V. S. T. S. Tohidi, M. A.-H. M. Jaszczur, A. Z. Sameen, and H. M. Salman. 2023. “Collective Self-Consumption of Solar Photovoltaic and Batteries for a Micro-Grid Energy System.” Results in Engineering 17: 100925, 14 p. https://doi.org/10.1016/j.rineng.2023.100925.
- Hennig, R. J., D. Ribó-Pérez, L. J. de Vries, and S. H. Tindemans. 2022. “What is a Good Distribution Network Tariff? – Developing Indicators for Performance Assessment.” Applied Energy 318: 119186, 17 p. https://doi.org/10.1016/j.apenergy.2022.119186.
- Law on Energy from Renewable Sources. 2011. No XI-1375, May 12. Accessed January 31, 2023. https://e-seimas.lrs.lt/portal/legalAct/lt/TAD/TAIS.448947.
- Luthander, R., J. Widén, D. Nilsson, and J. Palm. 2015. “Photovoltaic Self-Consumption in Buildings: A Review.” Applied Energy 142: 80–94. https://doi.org/10.1016/j.apenergy.2014.12.028.
- McKenna, E., J. Pless, and S. J. Darby. 2018. “Solar Photovoltaic Self-Consumption in the UK Residential Sector: New Estimates from a Smart Grid Demonstration Project.” Energy Policy 118: 482–491. https://doi.org/10.1016/j.enpol.2018.04.006.
- Öhrlunda, I., B. Stikvoortb, M. Schultzbergc, and C. Bartuscha. 2020. “Rising with the Sun? Encouraging Solar Electricity Self-Consumption among Apartment Owners in Sweden.” Energy Research & Social Science 64: 16 p. https://doi.org/10.1016/j.erss.2020.101424.
- Pater, S. 2023. “Increasing Energy Self-Consumption in Residential Photovoltaic Systems with Heat Pumps in Poland.” Energies 16 (10): 4003, 14 p. https://doi.org/10.3390/en16104003.
- A Policy Brief from the Policy Learning Platform on Low-carbon economy. September 2020. Interreg Europe. 2020. Accessed January 31, 2023. https://www.interregeurope.eu/sites/default/files/2021-12/Policy%20brief%20on%20renewable%20energy%20self-consumption.pdf.
- Stephant, M., D. Abbes, K. Hassam-Ouari, A. Labrunie, and B. Robyns. 2021. “Distributed Optimization of Energy Profiles to Improve Photovoltaic Self-Consumption on a Local Energy Community.” Simulation Modelling Practice and Theory 108: 102242, 13 p. https://doi.org/10.1016/j.simpat.2020.102242.
- Strielkowski, W., L. Civín, E. Tarkhanova, M. Tvaronavičienė, and Y. Petrenko. 2021. “Renewable Energy in the Sustainable Development of Electrical Power Sector: A Review.” Energies 14: 8240. https://doi.org/10.3390/en14248240.
- Šiupša, L., J. Dosinas, M. Vaitkūnas, A. Jonaitis, A. Baronas, and S. Gudžiūtė. 2022. “Employment of a DC Microgrid for More Efficient Use of Solar Energy in Household Buildings.” In 2022 IEEE 63th International Scientific Conference on Power and Electrical Engineering of Riga Technical University (RTUCON), October 10–12, 5 p. https://doi.org/10.1109/RTUCON56726.2022.
- Tercan, S. M., A. Demirci, E. Gokalp, and U. Cali. 2022. “Maximizing Self-Consumption Rates and Power Quality Towards Two-Stage Evaluation for Solar Energy and Shared Energy Storage Empowered Microgrids.” Journal of Energy Storage 51: 104561, 13 p. https://doi.org/10.1016/j.est.2022.104561.
- Wicki, L., R. Pietrzykowski, and D. Kusz. 2022. “Factors Determining the Development of Prosumer Photovoltaic Installations in Poland.” Energies 15: 5897. https://doi.org/10.3390/en15165897.