
 ?Mathematical formulae have been encoded as MathML and are displayed in this HTML version using MathJax in order to improve their display. Uncheck the box to turn MathJax off. This feature requires Javascript. Click on a formula to zoom.
ABSTRACT
Wind energy is a promising renewable source, necessitating effective monitoring of wind turbine (WT) conditions for reliable and cost-effective energy production, amidst environmental challenges. Condition monitoring of WTs employs traditional methods, signal processing, and emerging artificial intelligence (AI) approaches. AI-driven techniques excel in data-driven decision-making, addressing big data challenges in condition monitoring. This review paper presents a comprehensive overview of all streams of condition monitoring associated with WT, offering detailed insights into the related tasks. It also provides details on AI-based approaches and their application in executing various tasks within condition monitoring for WT. Finally, the study summarises the current trends, advantages, and disadvantages of AI-based techniques for real-world decision making in condition monitoring. This systematic review covers fundamentals to future developments in AI-driven approaches in condition monitoring for WT, serving as a valuable resource for readers and novice researchers in this field.
1. Introduction
In today's world, there is an ever-increasing demand for electricity, which has resulted in increased carbon emissions (Perez-Sanjines et al. Citation2023; Gielen et al. Citation2019). Wind power remains a promising energy resource for environmental protection and sustainable development. Among renewable energy resources, wind power plays a significant role in boosting global growth, with promising future prospects (Gielen et al. Citation2019). According to the global wind report 2022, the overall worldwide wind power capacity has now reached 837 GW, guiding the world limit over 1.2 billion tonnes of CO2 per year (Turi et al. Citation2022). In established wind farms, wind energy is used to generate electricity by converting the kinetic energy of moving air into electricity. Wind turbines (WT), are complex electromechanical machines, help to convert the kinetic energy of the wind into electrical energy. Wind rotates the rotor blades in modern WT, converting kinetic energy into rotational energy. This rotational energy is transferred to the generator via a shaft, resulting in the generation of electrical energy. WT in wind farms is subjected to stochastic and harsh environmental factors, which pose a variety of structural health risks to the turbines (Ou et al. Citation2021). Therefore, adequate, and appropriate operational and management (O&M) of WT are necessary to ensure the continuity and development of wind power generation. O&M prevents irregular loads and operational discrepancies caused by the complexity of deployed turbine environments and provides compensatory actions to correct any faults that occur.
Condition-based monitoring (CBM) is an essential part of O&M (Scheu et al. Citation2019). It is a strategy for machine maintenance that enables tracking the actual state of a machine by gathering data to understand the machine’s actual wear and degradation and ascertain whether a significant change has occurred or not. CBM is a predictive maintenance strategy that identifies the type of maintenance that must be performed and when it must be performed, with the focus on preventing machine failures and downtime (Catelani et al. Citation2020). CBM in WT involves fault detection, prediction, and diagnosis in various WT components such as blades, bearings, gearboxes, generator brushes, and so on. CBM in WT facilitates early detection of any degradation or impending faults before they can result in catastrophic failures. As a result, CBM can aid in keeping the WT healthy and operational, reducing outages caused by redundantly scheduled maintenance activities. The most common and frequently used CBM for WT includes signal processing (vibration/acoustic signals) or physics-based numerical models. With the advent of Artificial Intelligence (AI) approaches that provide accurate data-driven decisions and solutions in a variety of fields such as healthcare, defence, and finance, it is now being used for CBM in WT (Azar, Hajiakhondi-Meybodi, and Naderkhani Citation2022). AI has resulted in numerous advancements and improvements in CBM for WT. Supervisory Control & Acquisition (SCADA) systems offers a plethora of data at various time resolutions over the course of a turbine's operational life (Yang, Court, and Jiang Citation2013). AI based approaches are used to learn the SCADA and perform several decision-making tasks in CBM of WT. The inherent ability of AI-based approaches to model time series data is critical in analysing the vibrational and acoustics signals collected during CBM, which were previously performed by traditional signal processing approaches. Conventional methods like vibration and oil analysis fall short in providing detailed insights into WT health due to their limited spatiotemporal resolution. In contrast, AI-driven spatiotemporal models enhance fault detection by simultaneously considering both spatial and temporal dimensions in data, effectively capturing dynamic sensor patterns crucial for identifying evolving issues in various turbine components (Liang et al. Citation2019). Meanwhile, the rising prominence of explainable AI models, such as rule-based systems, contributes to transparency in fault detection, fostering trust (Brusa et al. Citation2023). Additionally, interpretable models play a pivotal role in providing clear insights into the internal mechanisms of AI algorithms, ensuring effective collaboration (Liu, Wang, and Chu Citation2024). Despite notable advancements, challenges persist in integrating spatiotemporal models into decision-making processes, primarily related to data quality, interpretability, and scalability. AI based approaches are applied for CBM of a variety of WT components such as gearbox, turbine blade, turbine generator, and bearings (Márquez et al. Citation2012).
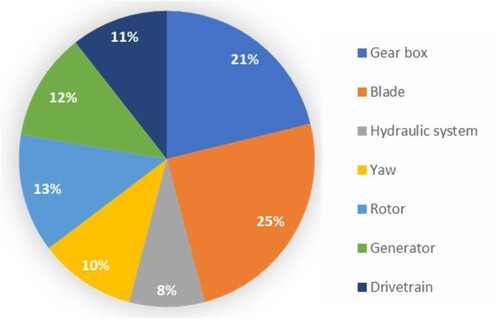
In CBM, a variety of tasks such as failure diagnosis, prediction/prognosis, health evaluation and anomaly detection are performed using various AI based algorithms. This survey paper investigates all types of tasks performed in the CBM of all components of a WT. It reviews around 160 papers (2016 onwards). The papers were searched in Google Scholar, Web of Science (WoS) and Scopus websites using search keywords like ‘condition monitoring wind turbine’, ‘artificial intelligence-based classification’, ‘artificial intelligence-based regression’, and so on. The results were filtered by year (>2016). shows the proportion of the primary components of WT that have been condition monitored for identifying faults in WT in the final filtered articles for review. illustrates the gearbox and turbine blade as two major components of WT that are extensively explored for condition monitoring in WT.
Figure 1. Proportion of WT primary components investigated for condition monitoring in the filtered articles for review.
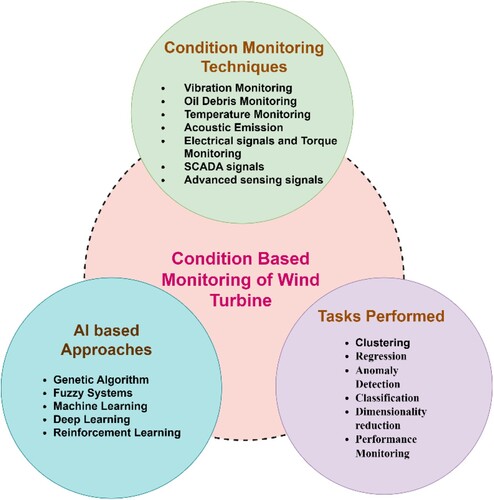
The filtered papers are grouped and discussed in three sections as shown in . Additionally, the paper also discusses on the challenges and future trends in AI-based approaches for WT condition monitoring.
Figure 2. Overview of the survey.
In this review, on the retrieved papers, the following research questions are been investigated, to benefit anyone doing research in CBM of WT.
How does CBM help with fault diagnosis, prognosis, and overall health assessment of various WT components?
What are the various application tasks to be performed in the CBM of WT, and how are they accomplished in a traditional approach to data-driven approach?
What are the state-of-art AI algorithms available for the various application tasks carried out in the CBM of WT?
What is the current state of technical research (multi-sensor approach, hybrid algorithms and so on) going under various application tasks performed in the CBM of WT?
What are the future trends of research that can take place in the data driven approaches for CBM of WT?
Following a manual investigation of the above-mentioned research questions from the 150 papers retrieved from a search, the following contributions are made in this review paper.
It provides preliminary insights on condition-based monitoring and their applicability in the fault diagnosis, fault prognosis and health assessment of a WT.
It provides insights on the feasibility of data-driven approaches for CBM of WT and discusses their advantages and challenges.
It gives a holistic overview of all current state-of art AI-based approaches and algorithms used in various application tasks performed in the CBM of WT.
In addition to the benefits of AI algorithms, its constraints, future trends, and proper guidelines for the selecting the right algorithm for each application tasks to be performed in the CBM of WT are reviewed and consolidated in this research article.
From these contributions in this survey paper, the reader gains knowledge on all preliminaries of CBM of WT, AI algorithms, and various application tasks performed in the CBM of WT. Furthermore, the paper enables the reader to grasp current scientific research trends in CBM of WT, reducing the possibility of research redundancy. The remaining sections of this survey paper are consolidated as follows: Section 2 discusses on the preliminary background study on Condition based monitoring of WT, Section 3 discusses the preliminaries of AI algorithms and their applicability in CBM of WT, Section 4 discusses the various tasks performed by AI algorithms in CBM of WT, Section 5 discusses the challenges and Section 6 provides the future trends of AI algorithms in CBM of WT. Finally, Section 7 concludes the survey with a clear comprehension on the entire work done.
2. Condition based monitoring of wind turbines
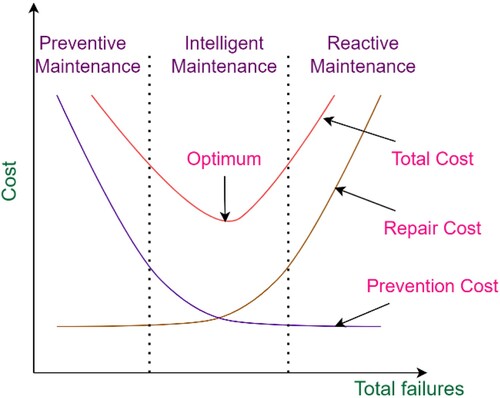
CBM plays a vital role in O&M. The processes in O&M of WT includes monitoring, management, and maintenance. The maintenance in WT effects in interventions and high costs (Zitrou, Bedford, and Walls Citation2016). The main objective of CBM is to decrease O&M expenditure, which is currently anticipated to account around 20%–30% of total WT entire life costs. This section offers insights on the fundamentals of the different CBM strategies that are available for WT. The type of maintenance available with O&M are of three types (Cheng et al. Citation2020), namely, (1) Reactive or corrective maintenance (run to failure); (2) Preventive maintenance (time-based); (3) Predictive maintenance (condition-based). Reactive maintenance is when a failure or complete breakdown occurs, with preventive measures being given the least consideration. Preventive maintenance involves scheduling maintenance on a regular basis, which results in a very low failure rate at a high cost of prevention. By following maintenance based on a CBM strategy, predictive maintenance finds an optimal solution when compared to reactive and preventive maintenance as shown in .
Figure 3. Maintenance based on a CBM strategy.
In predictive maintenance, the CBM strategy can have fine granularity at each component of the WT or coarse granularity at the entire WT. During CBM, characteristics are captured in the form of signals obtained from various types of sensors. Based on the physical implications introduced by the sensors on the component the CBM is classified as, (1) Intrusive Monitoring and (2) Non- intrusive monitoring (Albano et al. Citation2020). Intrusive monitoring imposes a cost or wear on the component that is being monitored. Some of its types includes vibration signal analysis, oil debris monitoring, shock pulse methods and so on. Unlike the intrusive approach, the component being monitored is not interfered with in a non-intrusive monitoring. Visual examination, ultrasonic sound analysis, thermography, power signal analysis, acoustic signals analysis, emission, and so on are some of the examples of non- intrusive monitoring. The primary objective of any CBM is to either identify an existing fault or predict a failure that is likely to occur in the future. Fault diagnosis is the classification of an occurring fault into one of its types. Prediction of component wear, remaining useful life, or future operational intervention due to failure is referred to as fault prognosis. The conventional approaches for CBM mostly monitors the WT components externally by capturing data of their behavioural patterns. Signals are the most common form of these captured data, and appropriate signal processing algorithms are used for feature extraction. With the emergence of AI, modeling the features extracted from these signals help in fault diagnosis and prognosis. Some of the Conventional CBM approaches in WT are discussed in detail as follows.
2.1. Vibration monitoring
Vibration monitoring is a well-known and widely used CBM for rotating devices of a WT (Scheu et al. Citation2019). In a WT, VM is used for performing CBM for many components such as bearing, shaft, gearbox, blades, and generator. A combination of vibration sensors, appropriate signal conditioning, and an acquisition charge amplifier device enables continuous high-frequency monitoring of vibration signals in critical positions in the WT drivetrain. Position transducers, which operate in the low-frequency range of 1–100 Hz, velocity sensors, which operate in the mid-frequency range of 10–1 kHz, and accelerometers, which operate in the high-frequency range of 1–30 kHz are some of the vibration sensors and they are placed at several places in a WT drive train (Yu Citation2020). The ISO10816 defines the location and application of sensors for vibration monitoring in WT (Mehlan and Nejad Citation2023). The time-domain signals obtained from these sensors are converted to frequency domain, where the fault-related frequency components of the signal are captured for fault diagnosis/prognosis. Fourier Transform and Wavelet transform are some of the common transforms used for this purpose (Strömbergsson et al. Citation2019). Based on the analysis of the magnitude and the mode of the vibration signal, the identification of the fault as well as its severity is done. Vibration monitoring is performed on various components of WT under different load and speed environments. Vibration monitoring is generally well suited for condition monitoring rotating parts of a WT such as rotor and blades, but it is least applicable to non-moving electrical components of a WT. Also, these approaches find it less appropriate for identifying initial stage faults which occur at low-frequency, even with advanced signal processing approaches (Peng et al. Citation2022). Though, vibration monitoring techniques are easy to implement into already-existing component hardware, this method calls for the use of additional hardware and software, which drives up the price of production. With the emergence of AI based approaches, modeling the features extracted from these signals and searching of optimised solutions has made it possible to achieve efficient performance in terms of accurate fault detection and prediction.
2.2. Oil debris monitoring
In order to protect the WT components, oil debris analysis is used to monitor the condition and quality of the lubrication oil in the rolling components and identify its deterioration and contamination (Coronado and Wenske Citation2018). The viscosity analysis, Particle count analysis, Oxidation analysis, Water and acid content analysis, Temperature analysis, and Machine wear analysis are some of the common practices in Oil Debris Monitoring that allows to find the size, shape, amount and composition of particles in the oil which in turn helps to determine the health of the rolling and rotating components. Based on the type of data sensing and sampling this approach can either be online or offline. Using particle counting sensor, flow/pressure drop sensor, electromagnetic sensors and optical debris sensors the approach can be made an online approach well suited for all components in the gearbox of a WT. however, the production cost of such an approach is expensive. A laboratory-based technique involving manual sampling and analysis using an optical emission spectrometer or a viscometer is used in the offline approach. Although the oil debris approach is effective for CBM of WT, it is highly dependent on the kind, quantity, and location of the sensors on the drivetrain. Furthermore, due to the complex gearbox configuration of WT, establishing a cost effective and universal oil debris monitoring approach across all WT is challenging (Yang Citation2016).
2.3. Temperature monitoring
Temperature monitoring is one common method of CBM which employs sensors such as resistant thermometers, optical pyrometers, and thermocouples to monitor the temperature of the components of WT (Abboud Citation2021). Every component of WT has a limited operational temperature. The temperature of the component deviates from its operational temperature when there is a deterioration process in the WT component, such as damaged gears and bearings, a poor electrical connection, or inadequate lubricant properties. Analysing the properties of the components in terms of its temperature deviations significantly benefits to detect a fault that is currently occurring in components such as bearing, rotor, gearbox, generator and windings (Li et al. Citation2023). However, this approach is less suited for fault prognosis related application. Also, it is less appropriate to detect the incipient faults due to the influence of the environmental temperatures in the components of WT.
2.4. Acoustic emission analysis
The AE sensors such as piezoelectric transducers and optical fibre displacement sensors are generally used to measure the change in the sound information obtained from the components of WT (Worms et al. Citation2017). This method has the potential to aid in the detection and prediction of faults in gearboxes, bearings, generators, shafts, and rotors, and it has the advantages of a wide frequency range and a relatively high signal-to-noise ratio. However, handling this approach requires proper placement of sensors at close proximity to the device, expensive data acquisition and signal processing techniques, and high operational cost for prevention of failures. This approach is well suited for accurate early-stage fault detection when combined with the conventional vibration monitoring approach (Frankenstein et al. Citation2009). Following the introduction of AI-based approaches, the complex and advanced signal processing requirements in this approach are excluded, making the process more practical for real-time applications.
2.5. Electrical signals and torque monitoring
The electrical signals and the speed signal obtained from the WT components can be analysed to identify fault-specific features in them. The electrical signals such as current, flux, voltage and speed signals under various load and operational speed gives a clear and straightforward analysis of the faults occurring in gearbox, blades, generator and bearings (Yang et al. Citation2011). The torque and speed measuring sensors are placed in-line with the rotating components of WT. Although the monitoring procedure is simple and non-intrusive, it is not widely used due to the high number of inaccuracies and false alarms associated with fault detections performed using this method. The torque monitoring techniques are highly dependent on load and require advanced signal processing approaches for identifying the fault spectra in the signals when compared to the vibration signal (Dahiya Citation2018). Also, these approaches are suited to identify the faults that are currently occurring and are less suited for fault prognosis related application.
2.6. SCADA signal analysis
The WT is observed under remote controlled supervised operational condition settings, and health assessment signals from various WT components are observed. For the purpose of analysing various fault types in different WT components, the WT health signals are collected and analysed in both normal operational mode and faulty mode (Jin, Xu, and Qiao Citation2020). The SCADA health signals are measured using various sensors under various workloads and speed conditions. These health signals are potential source for identification and prediction of faults in WT. With advanced signal processing algorithms and AI algorithms the efficient fault diagnosis and prognosis are carried out using the SCADA health signals (Dao et al. Citation2018). However, the low sampling rate of the SCADA signals is the major setback in this approach. Since SCADA signals do not encompass the entire operating region of WT, they are prone to false alarms in diagnosis. Therefore, commercialisation of the approach is not reliable.
2.7. Advanced sensing focused CBM of WT
Some of the advanced sensing focused CBM of WT includes thermography analysis, -ray micro-tomography analysis, Fiber Bragg grating (FBG) sensor measurement analysis, Shock pulse method, and ultrasonic testing analysis (Yang and Sun Citation2013). Every component is susceptible to temperature during its normal operations and faulty operations. Their thermal image analysis can help in identifying and predicting faults in gearbox shafts, bearing and blades of WT. However, incipient-stage fault identification is less suited with this approach as the change in temperature is a slow and constantly changing factor. Similarly, approaches using sensors such as shock pulse transducers and probe piezoelectric accelerometers can be utilised to analyse the peak, mode and amplitude of shock waves in the bearings (Bogue Citation2013). This in turn yields valuable information on the faults occurring and likely to occur in the bearings and other rolling components of WT. However, this approach requires the knowledge of the structure of the bearing in WT.
Analysing the acoustic wave field image obtained by using sensors such as air-coupled transducers, laser interferometric sensor, and electromagnetic acoustic transducers can be analysed to identify and predict faults in a WT (Soman Citation2022; Yang, He, and Zhang Citation2016). Some of the signal processing transforms used in this approach includes wavelet transform, Wigner-Ville distribution, and Hilbert-Huang transform. Unlike other non-intrusive approaches, this method is least affected by the environmental factors and is therefore reliable and effective in determining the characteristics of the faults in the various components of WT. Likewise, a Fiber Bragg grating sensor is a thin, flexible, and transparent optic fibre that is specially designed to reflect light at a specific wavelength when subjected to external stimulus such as stress, strain, and temperature. The sensed signals from these sensors are effective in fault diagnosis and prognosis. This method is well suited for identifying stress in WT blades and is intended to provide a low-cost monitoring solution. Finally, the X-ray micro-tomography approach is a 3D inspection, proven effective in identifying the initial-stage faults occurring in gearbox, bearings and structural discontinuities in a WT (Danielsen et al. Citation2019). The main benefit of this approach is that it is non-intrusive and promising in terms of providing accurate condition monitoring solutions; however, it is expensive.
3. Overview on AI-based approaches
Traditional models utilised in WT condition monitoring encounter substantial challenges, specifically associated with uncertainty, disturbances, and model-reality mismatch, subsequently affecting their precision. Environmental uncertainties arise from dynamic conditions and intricate interactions within the turbine system. Sudden changes in wind speed and external forces, exemplified by extreme weather events, challenge traditional models in timely adaptation. The model-reality mismatch reflects disparities between assumed and actual turbine behaviour, influenced by dynamic operational conditions and aging. These challenges acknowledge the imperative for adaptive methodologies through the integration of advanced data analytics, AI, and real-time monitoring, augmenting the resilience of traditional models. This integration facilitates advanced systems that enable prompt responses to disturbances and adaptation to evolving conditions, offering a more precise assessment of WT health within real-world operational contexts. Also, the escalating complexity of contemporary WT generators necessitates intelligent, resilient, and precise monitoring systems to optimise power generation and ensure system flexibility.
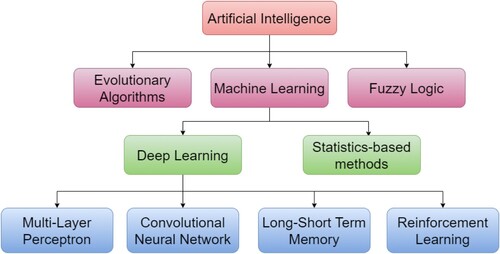
In the last two decades, AI for WT condition monitoring has advanced significantly, with the majority of the work concentrating on modelling and optimisation using methods like statistical approaches, trend analysis, time, and frequency-domain analysis, and more. AI-based condition monitoring of WT typically concentrates on fault identification, decision-making, and optimisation. The AI algorithms used for WT condition monitoring are broadly classified as shown in .
Figure 4. Schematic diagram of classification of AI-based algorithms.
3.1. Computational approaches
3.1.1. Evolutionary algorithms
Increased offshore WT construction to gather more wind energy necessitates extensive condition monitoring and maintenance. However, because of the environment that surrounds it, maintaining offshore WT is more challenging. Choosing the appropriate condition monitoring and maintenance plan turns into a challenging optimisation problem with multiple constraints and objectives (Gonzalo et al. Citation2022). EAs are search-based optimisation algorithms that use genetic and natural laws to discover the best solution for condition monitoring optimisation problems. In these algorithms, the duplication and mutation process eventually discover the best optimal solution for a problem out of a pool of potential alternatives. Each EA has a different search strategy for the best solution. The fact that the evolutionary algorithm does not require complicated mathematical modelling means that it can produce a solution that is close to being optimal in a reasonable amount of time. When looking for the best solutions, the well-known EA known as the genetic algorithm (GA) follows the steps depicted in .
Figure 5. Genetic algorithm architecture.
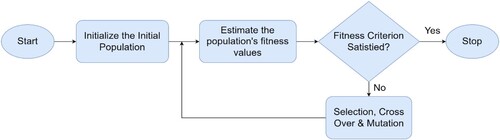
The GA algorithm in is described in the following manner.
Create or initialise a baseline population
Each member of the population is assessed for their ability to meet a goal.
For mutation and cross over, the individuals with the highest fitness values are chosen.
Individuals with higher fitness levels are substituted with those with lower fitness ratings.
The search is carried out in the manner described above until the best option is found.
Genetic algorithms, a subset of evolutionary algorithms, use evolutionary biology concepts including selection, reproduction, mutation, crossover, and hybridisation to find the optimal answers. GA aims to improve resilience and strike a balance between performance and costs required for a population to survive in a variety of circumstances (Ghaheri et al. Citation2015). Another well-known EA that draws inspiration from biological systems is swarm intelligence (SI). It is made up of a population of straightforward agents that adhere to straightforward rules without the use of a centralised control architecture in order to find the best way to accomplish a goal. It demonstrates that a population of agents’ collective knowledge is superior to that of a single agent (Ab Wahab, Nefti-Meziani, and Atyabi Citation2015). Ant colony optimisation, artificial bee colony optimisation, social spider optimisation, and others are some of the popular SI methods (Thirunavukkarasu, Sawle, and Lala Citation2023). Overall, EA exhibit robustness in WT condition monitoring, showcasing adaptability to diverse operational conditions and ability to optimise parameters for fault detection. However, their reliance on iterative processes and careful consideration of optimisation function may hinder real-time applications, potentially impacting reliability.
3.1.2. Fuzzy logic
Fuzzy systems are especially helpful in scenarios involving very complex systems whose behaviours are poorly understood and in circumstances where an approximative but quick solution is sought. It is a type of reasoning that uses distorted and unreliable data to generate logical conclusions that resemble human thinking. To provide definitive outputs, fuzzy logic systems consider every conceivable input logic. Another benefit of fuzzy systems is that current expert knowledge can be applied to enhance approximation through modifying, eliminating, or adding membership functions and rules. It is a type of reasoning that uses distorted and unreliable data to generate logical conclusions that resemble human thinking. Fuzzy logic structures include all potential input logics into the system to provide definitive output. The fuzzy logic architecture comprises of four modules namely as shown in .
Figure 6. Fuzzy logic architecture.
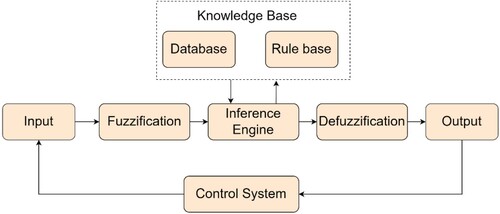
The fuzzy logic algorithm in is described in the sections that follow,
Fuzzification module: The first step is the fuzzification module, which converts a crisp input into a fuzzified input with values that span from very big positives to very large negatives. With the aid of a membership function, which is a graph that specifies how to represent an input in the input space with values ranging from 0 to 1, this transformation of inputs is accomplished.
Knowledge Base: This term indicates the rule store that contains the expert-recommended If–Then rules.
Inference Engines: The brain of the fuzzy system, these engines determine which rules are most appropriate for a given input and activate them accordingly. Combining the fired rules results in controllable actions.
Defuzzification: Using a suitable defuzzification strategy, the fuzzified inputs are turned back into crisp values in this phase.
In the WT condition monitoring Fuzzy logic is frequently used for decision-making when costs, failure modes, and preventative maintenance are taken into account in order to identify and predict early faults (Bai et al. Citation2017; Shayeghi and Hashemi Citation2015). While using SCADA and large data, fuzzy logic is used to assess the condition of a wind farm. The wind farm was optimised as a result of their strategy's decreased number of false alarms (Benmessaoud et al. Citation2018).
Fuzzy Logic is frequently integrated with other AI approaches to optimise diverse processes in WT construction and condition management. This includes tasks like power dispatch, maintenance scheduling, and monitoring gearbox states utilising temperature or vibration data (Singh and Fernandez Citation2017; Mao, Dai, and Li Citation2019). Despite challenges related to the potential difficulty in defining precise fuzzy rules, which can lead to interpretability issues, Fuzzy Logic exhibits robustness and reliability in WT condition monitoring, particularly in handling imprecise data.
3.2. Machine learning algorithms
ML is a prominent AI modelling approach in which the model is taught to solve a problem using past data instances with less explicit programming g. In this way, the trained model becomes capable of mining information and finding patterns from previously unknown data of an identical problem. Recent advancements in sensors, signal processing systems, big data management, and computational power have created opportunities for machine learning (ML) to support in-depth condition monitoring analytics (Scheu et al. Citation2019). ML can model different types of data from specific measurements like vibration analysis, strain measurement, thermography, and acoustic emissions and help WT condition monitoring decision-makers make well-informed, dependable, economical, and robust decisions (Bach-Andersen, Rømer-Odgaard, and Winther Citation2018). The WT condition monitoring uses ML techniques to observe a WT's components and spot operational changes that might indicate a developing failure. Machine learning algorithms are widely classified as follows:
Supervised Algorithms: The data instances are labelled in these machine learning algorithms. During training, the model associates the input with its corresponding output in order to learn a function that transforms the input to the desired output. Two common tasks performed using supervised machine learning includes regression and classification. Some of the commonly used supervised ML algorithms for WT condition monitoring are Support Vector Machines (SVM) (Ibrahim, Weinert, and Watson Citation2016), Random Forest (RF) (Li et al. Citation2021), Decision Trees (DT) (Abdallah et al. Citation2018), Linear Regression (LR) (Abdusamad, Gao, and Muljadi Citation2013), and so on. The key steps in modeling WT health data with ML algorithms are: (i) data pre-processing to handle missing and outlier data; (ii) class balancing so that the predicted classes are evenly distributed so that the model is unbiased; (iii) feature selection and extraction to retain only those features relevant for modeling. (iv) model-fit classification estimates the model parameters, and (v) finally cross-validation tests the generalizability of the model. During regression tasks, ML helps model the normal state of the WT component and determine the abnormalities or the remaining useful life of the component (Orozco, Sheng, and Phillips Citation2018). Similarly, in classification tasks, ML models capture multiple error characteristics to determine the class of unseen data (Ibrahim, Weinert, and Watson Citation2016).
Unsupervised learning: In unsupervised machine learning, the training data instances are unlabelled. The unsupervised ML algorithms aid in grouping the data instances in WT condition monitoring according to their similarities. The marked data are subsequently used for anomaly detection or classification tasks (Wang and Shao Citation2018; Yang, Liu, and Jiang Citation2018). Unsupervised machine learning methods are also employed in the condition monitoring of WT to find hidden structures in the WT health data and to reduce dimensionality in big data (Jiang et al. Citation2017). K-means algorithm (Rodriguez et al. Citation2023), autoencoder (Liu et al. Citation2023), Restricted Boltzmann Machine (Salakhutdinov and Larochelle Citation2010) are common unsupervised ML algorithm used in condition monitoring of WT. Although unsupervised algorithms can detect anomalies or perform classification without the need for data labelling using a grouping technique(Yeter, Garbatov, and Soares Citation2022), but the real challenge for these models is determining a threshold for distinguishing between conditions of health. Generally, the threshold is frequently established based on experience or even different types of computation techniques. As a result, the threshold's ambiguity will unavoidably have an impact on the quality of the monitoring process and may lead to inaccurate diagnoses. However, unsupervised machine learning algorithms are capable of developing a self-adjusting threshold that can overcome this bottleneck in WT monitoring (Chen et al. Citation2021).
Semi-Supervised Algorithm: This type of ML method combines supervised and unsupervised ML strategies (Zhou, Diehl, and Tang Citation2023). It contains both labelled and unlabelled data that are used to train a model. Although the model is mainly trained similarly to an unsupervised model, it has some advantages above what labelled data could provide because labelled data is more expensive to get (Wang et al. Citation2020). Semi-supervised algorithms can aid soft sensors or virtual sensors used in the condition monitoring of WT, where several measurements are analysed simultaneously and the interaction of the signals can be used to determine values that do not need to be monitored (Dong et al. Citation2022). When employing the semi-supervised approach for classification, a pseudo-labeled data set is produced from an unlabeled data set. In order to account for the temporal correlation of time series data, a time weight vector is added, followed by the application of a similarity measure. Finally, for the primary fault localisation of likely faults in a WT component, a classifier model is built and trained on the pseudo-labeled data set (Jiang, Hu, and Li Citation2020).
The research findings demonstrate that machine learning algorithms excel in robust and reliable WT condition monitoring, utilising diverse datasets for accurate fault detection. Challenges arise in interpretability, requiring high-quality training data. Periodic updates and continuous refinement are essential for sustaining adaptability to evolving WT operational conditions.
3.3. Deep learning algorithms
DL algorithms are a subclass of machine learning algorithms used to search data for knowledge and patterns using many layers of computations. Deep learning combined with monitored data of WT can assist assess the WT's condition more accurately. Since DL algorithms speed up processing while increasing prediction accuracy, they are frequently used for fault diagnosis, prognosis, and multiparameter data anomaly detection in condition monitoring of WT (Zhu et al. Citation2023). Some of the most prevalent deep learning algorithms used in WT condition monitoring include the Deep Neural Network, Convolutional Neural Network (CNN), and Recurrent Neural Network (RNN).
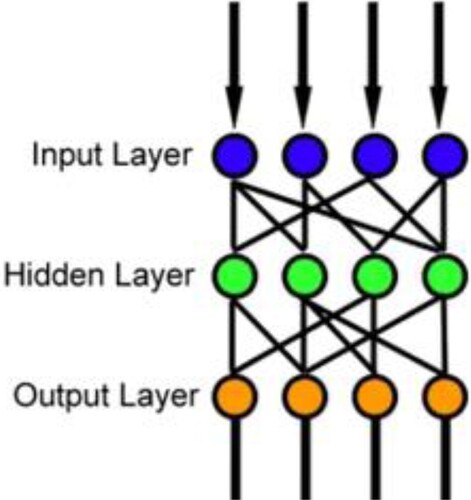
3.3.1. Multilayer perceptron (MLP)
IMcCulloch and Pitts first created the perceptron in 1943, which uses calculations to find features. A multilayer perceptron (MLP) is a type of feedforward artificial neural network that works well for any task such as regression and classification that involves linear separability of data (Sivakumar and Vaithiyanathan Citation2021). As seen in , the multilayer perceptron (MLP) has at least three perceptron layers (input layer, hidden layer, and output layer) and can handle both linear and non-linear datasets. The MLP is a feed-forward AI method in which the weight parameters acquired through back propagation and each layer is multiplied by a weight matrix. A non-linear function is then performed at the hidden layer to obtain the output after the multiplications. MLP differs from a linear perceptron due to its numerous layers and non-linear activation. It can discriminate between data that cannot be separated linearly (Tian et al. Citation2022). According to linear algebra, any number of layers in a multilayer perceptron can be reduced to a two-layer input-output model if each neuron has a linear activation function, which translates the weighted inputs to each neuron's output. The non-linear functions include sigmoid, tanh, and RELU (Zhang, Cosma, and Watkins Citation2021). MLP has demonstrated success in several areas besides condition monitoring and it doesn't make previous assumptions about the distribution of the data like other classifiers do (Jiang et al. Citation2022). In condition monitoring of WT, MLP is integrated with various deep learning algorithms to produce hybrid approaches that outperform in the field of application. A greedy layer-wise unsupervised learning is employed in a proposed method to stack several sparse autoencoders and learn the deep features present in the input data. In order to maximise the total network, a regression predictor is finally added to the final layer of the stacked sparse autoencoder framework for supervised learning (Xiao et al. Citation2021). Another proposed approach models SCADA data for temperature predictions of the WT bearing using a hybrid combination of numerous LSTM cells and a multi-layer perceptron regression layer. This hybrid combination significantly captures the trend of temperature change by learning the nonlinear, non-stationary, and dynamic feature correlations between temperature and its related variables to alert bearing overheating (Xiao et al. Citation2022). MLP is also playing a vital role in determining faults in the turbine blade and pitch angle of a WT (Feng et al. Citation2023; Joshuva et al. Citation2020).
Figure 7. Architecture of MLP with single hidden layer.
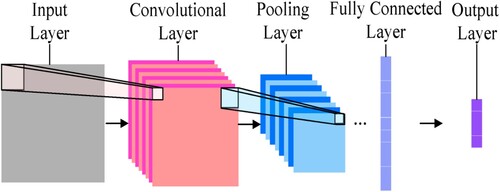
3.3.2. Convolutional neural network (CNN)
CNN is a subclass of DNN in AI that begins with numerous layers of convolutional layers with various filters, each of which can be represented as a kernel matrix as shown in . Through backpropagation, the parameters of the kernel matrix are learned (Yu et al. Citation2019). An image or a matrix sequence that looks like an image often serves as a CNN's input. A non-linear activation function that finds out the non-linear distinctions in the dataset is created by convolving the inputs through the kernel matrix, a pooling layer, and a pooling layer. To add more layers of data abstraction to the data, convolution layers and pooling layers must be added (Jing et al. Citation2017). The more information that can be obtained from the data, the deeper a CNN can be. The total number of classes in the use-case determines how many neurons are present in the output layer. Each neuron's output in the output layer represents the likelihood that an input will belong to a particular class (Kong et al. Citation2020). A CNN architecture is used to extract dynamic changes from SCADA data in order to carry out early alerts for anomaly states and determine the defective component using prediction residuals (Xiang et al. Citation2021). In order to successfully extract multiscale characteristics and categorise mistakes, the vibration signals from the gearbox are precisely disintegrated using wavelet packet decomposition, and the disintegrated signal components are given as input into a hierarchical convolutional neural network (CNN) (Huang et al. Citation2021). The multi-channel convolutional neural network, which is composed of numerous CNN models, collects defect information from imported original vibration signals and examines their condition automatically and effectively. Each model's output is sent to the output layer, a maximum output network used to determine the most precise state (Wang et al. Citation2022). The performance of cutting-edge deep learning algorithms, specifically YOLOv3, YOLOv4, and Mask R-CNN, is also performed with the most efficient combination of image augmentation and enhancement techniques for pre-processing the dataset for the task of WTB defect detection and classification using images (Zhang, Yang, and Fang Citation2021).
Figure 8. Architecture of a general convolutional neural networks.
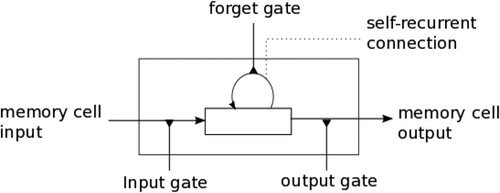
3.3.3. Long-short term memory (LSTM)
For processing time sequence data, recurrent neural networks (RNN), a well-known Deep learning technique, are employed. shows how RNN is constructed using a number of cells that actively process inputs to find patterns in the data that is provided in relation to output sequences. However, RNN experiences challenges with disappearing or exploding gradients. As seen in , the LSTM, which employs memory cells and contains three gates (input gates, output gates, and forget gates), proved successful in resolving this challenge. The input and output data flow of memory cells are controlled by the gates, which serve this purpose. The inputs get multiplied by the weight matrix representing the gate's parameter values (Zhao et al. Citation2020). For producing outputs, a non-linear function is applied to the multiplication results. Each cell has an additional input called latent input from the preceding cell in addition to the current input (Lei, Liu, and Jiang Citation2019).
Figure 9. Architecture of recurrent neural networks.
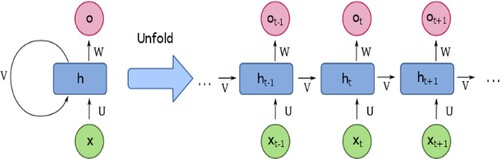
Figure 10. Gates in the memory cell of LSTM.
The weight matrices at each gate is represented as shown below,
(1)
(1)
(2)
(2)
(3)
(3)
(4)
(4)
(5)
(5)
(6)
(6) where xt is the input to the memory cell layer at time t, Wi, Wf, Wc, Wo, Ui, Uf, Uc, and Uo are weight matrices, bi, bf, bc and bo are bias vectors.
A hybrid LSTM with Kullback-Leibler divergence model selects the best thresholds to distinguish between the normal, alarm, and fault circumstances by capturing the relational patterns and temporal dependency in the monitoring data and assessing the defect's severity based on output probability distributions (Wu and Ma Citation2022). The superiority of the approach is demonstrated by forecasted alarms, SCADA alarm records, and the ability to identify a failure five days in advance. The aim of anomaly detection is to locate the underlying factors that cause unexpected changes in a product's performance. The LSTM network, which is integrated into the neural architecture of the AE, effectively extracts information from the condition monitoring data by making substantial use of the data's temporal order (Chen et al. Citation2021). In order to characterise the normal or abnormal operating condition of a gearbox bearing and to provide an over-temperature defect warning, a stacked long-short-term memory model with multiple LSTM cells is a highly practical and generalised model for forecasting temperature of a gearbox bearing (Fu et al. Citation2019). The traditional LSTM model outperforms when improved using evolutionary methods, such as multiple swarm intelligence models, in classifying errors using vibration signals data obtained from the WT (Durbhaka et al. Citation2021).
3.3.4. Reinforcement learning
In Reinforcement learning (RL), the algorithm learns a set of actions for a collection of internal states and its associated actions with a specified set of rules and policies by connecting to the environment, as shown in . A value is awarded for each step taken by the algorithm. The algorithm's goal is to increase the optimal action-value function by maximising the ideal action set and collecting greater rewards model's exposure to the environment, are used to estimate a set of action space given a set of state space. The model also features a replay memory where the previous transitions are stored. The RL algorithms are best suited for sparse datasets. RL manages a variety of controls and optimisation applications in Condition monitoring of WT.
Figure 11. General schematic of reinforcement learning.
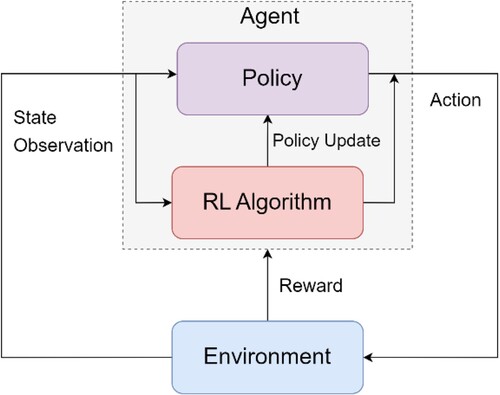
The RL algorithms are capable of monitoring and controlling the rotor blade (Sierra-Garcia and Santos Citation2020a), pitch angle (Sierra-Garcia and Santos Citation2020b), and yaw rotation (Saenz-Aguirre et al. Citation2020) of a WT by considering multivariable conditions and actions in addition to mechanical loads. RL learning-based monitoring and management of a WT enables the maximisation of wind power absorption and, as a result, an improvement in system efficiency. These RL-based control systems define novel policy updating algorithms and reward strategies associated with energy deviation from rated power. The only-positive and positive–negative rewards are two of the novel reward schemes that have been suggested (Sierra-Garcia and Santos Citation2020b). Controlling each of the WT subsystems independently with its own control subgoal by developing a parameterised controller for every individual subproblem overlooks subsystem linkages, which can have major consequences. Actor-Critic-RL is a proposed solution for the overall joint control issue that simultaneously optimises the control parameters of many subsystems without neglecting their interactions (Fernandez-Gauna et al. Citation2022). This RL technique achieves global optimum control of the entire system. Approaches that combine an RL-based controller with a proportional–integral–derivative (PID) regulator can mitigate the disadvantage of RL's slow learning process (Sierra-Garcia, Santos, and Pandit Citation2022). Furthermore, RL algorithms are used in the optimisation of hyperparameters of other DL techniques that forecast WT temperature values in WT condition monitoring (Liu, Yu, and Yu Citation2021). This enables higher accuracy in the deterministic forecasting of WT condition monitoring metrics (Nam and Hur Citation2019).
The identified research findings signify that DL algorithms demonstrate robustness and reliability in WT condition monitoring. Despite the need for substantial training data and their ‘black-box’ nature (Koh and Liang Citation2017), which raises considerations about interpretability and explainability, their ability to discern intricate patterns from extensive datasets enhances fault detection and predictive maintenance.
4. Tasks performed by AI algorithms in CBM of WT
The several tasks performed for condition monitoring WT in terms of fault diagnosis, fault prognosis, monitoring and control and anomaly detection is as shown in .
Figure 12. Tasks performed for condition monitoring of WT.
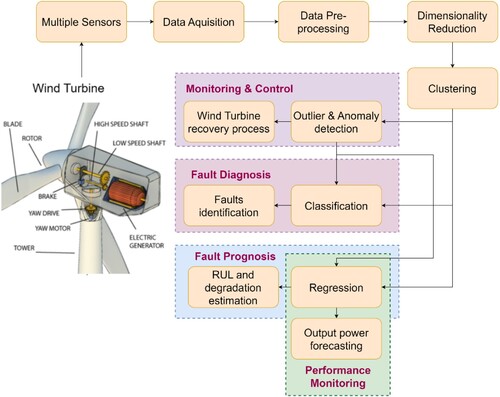
The condition monitoring starts with data acquisition of signals from appropriate sensors selected based on the component to be monitored. These sensors can either be an accelerometer sensor, ultrasonic sensor, acoustic sensor, or thermographic sensor. The signals acquired by these sensors are pre-processed using signal processing algorithms and stored with the help of a digital acquisition system. The SCADA signals are also considered for modeling the normal and faulty operation of WT. Based on the application and required output, the particular task is determined and the appropriate AI algorithm for executing the task on the health signals of the component is identified. Some of the tasks performed by AI algorithms in CBM of WT are discussed below.
4.1. Dimensionality reduction
The process of reducing the number of features in a dataset is known as dimensionality reduction. The ‘curse of dimensionality’ states that the more features there are, the harder it is to model them. Furthermore, some of these features can be quite ineffective and redundant, adding noise to the dataset and having no use in the training data. Feature space needs to be reduced here and also it's crucial to view out for any potential loss of significant and valuable data properties. The challenge in dimensionality reduction lies in selecting an optimal subset of features that balances computational efficiency with preserving relevant information, especially crucial for high-dimensional datasets (Ogaili, Jaber, and Hamzah Citation2023). In order to understand and interpret the data in a condition monitoring dataset, dimension reduction is frequently used. Dimensionality reduction is also frequently used in machine learning or deep learning techniques to make the assignment simpler. Principal Component Analysis (PCA) possesses the impact of concentrating a large portion of the data into the first few principal components, which can be effectively captured by dimensionality reduction. The later principal components may be dominated by noise, and so may be discarded without suffering a great deal of loss. To reduce dimensionality and model the health data of WT, multiway PCA(MPCA) is proposed which is equivalent to applying standard PCA to an unfolded version of the original multiway array (Pozo, Vidal, and Salgado Citation2018). In another study, the SCADA measurements are pre-processed using group scaling and feature transformation to move from the initial high-dimensional feature space to a new reduced dimension space based on MPCA through sample-wise unfolding (Vidal, Pozo, and Tutivén Citation2018). T-distributed Stochastic Neighbour Embedding, also known as t-SNE, is a method for dimensional analysis or reduction. The t-SNE technique is employed to reduce the dimensions of the learned multiscale representations in two dimensions for visualisation in order to understand the advantages of incorporating multiscale features more effectively in the proposed algorithm (Jiang et al. Citation2018). The 3-D visualisation of the extracted features is performed using t-SNE to show the identification effect of the proposed model's features on the drivetrain diagnostics simulator test rig test data (Yu, Tang, and Zhang Citation2021). The categorisation and clustering of the extracted features are visualised using PCA in order to further validate their effectiveness. It demonstrates that, when compared to the original features, the points denoting various health conditions are widely separated and the points denoting the same class are clustered closer together (Chen et al. Citation2019; Kouadri et al. Citation2020). A novel data sampling method called compressed sensing (CS) has the potential to reconstruct large-scale signals from a small number of sampled data points at sampling rates below the Nyquist rate. Data mining and signal processing in WT condition monitoring has made extensive use of CS to condense the dimensions of the vibration data that were collected and increase the effectiveness of the deep learning models that would be used for the subsequent analysis (Shao et al. Citation2018). When using L12 sparse filtering, in contrast to other feature learning techniques currently in use, SF does not attempt to build a model for data distribution. However, it only necessitates optimising a straightforward L2-norm normalisation loss function. The low-dimensional unsupervised features of the original data are extracted by a multilayer neural network (L12SF) with the actual data as the input of the first layer (Zhao and Jia Citation2020).
4.2. Clustering
Clustering is a machine learning process where unlabelled data are grouped into clusters in such a manner that the data points that share common features fall under the same cluster. The health dataset obtained during the condition monitoring of WT can be dimensionally reduced with the assistance of clustering to obtain the more pertinent features. The clustering process helps to visualise similar health data points from the rest. This makes it possible to distinguish between ‘normal’ and ‘faulty’ data as well as outliers from the normal data points. In condition monitoring of WT, clustering is used to label the unlabelled SCADA data which can further be used for modeling the normal behaviour of a WT. To effectively find and isolate clusters, the linear discriminant analysis (LDA) and k-means clustering algorithms are combined (Bilendo et al. Citation2021). These clusters are then classified as either normal or anomalous based on the probability density function, a statistical principle. Density-based spatial clustering is used to identify various clusters on the target domain variable in a fault diagnosis method of WT with limited labelled data (Zhang et al. Citation2022). An unsupervised deep learning network with two layers of unsupervised feature extractors (L12SF) and one layer of unsupervised clustering (Weighted Euclidean Affinity Propagation) has been proposed to address the problem of partially labelled WT's health data (Zhao and Jia Citation2020). This proposed approach proves efficient in fault detection of WT’s rolling bearing fault dataset.
In the monitoring data of WTs, there have been a variety of outliers that make it difficult to conduct further data mining. Clustering is also widely used for identifying the outliers in WT condition monitoring parameters. The choice of parameters has a significant impact on how well clustering algorithms perform. Unsuitable parameters would decrease the accuracy of the detection. However, it is challenging to estimate the ideal parameters in a high dimensional space, which would lead to an incorrect identification of the monitoring data. ML-based algorithms help in resolving this challenge. Data with any form and noise can be efficiently categorised using a density and grid-based (DGB) clustering method (Wu and Wilamowski Citation2016). Additionally, a faster grid-based algorithm is proposed, which reduces the computation time needed by the Local Outlier Factor algorithm to identify the k-nearest neighbours (Lee and Cho Citation2016). Based on these studies, a proposed density-grid-based clustering method and stacked denoising autoencoder (SDAE) approach for unsupervised outlier detection is developed. This uses the SDAE to extract features from the SCADA data, and then applies the density-grid-based clustering method to the results to find the outliers in the data (Sun and Sun Citation2019). Also, a robust k-means clustering algorithm using City block distance and squared Euclidean distance is proposed to explore the outliers in the raw power curve data, which is crucial for monitoring WT data. An ensemble approach where k-means and linear discriminant analysis algorithm are effectively combined to detect outliers is also proposed and developed in the condition monitoring process of WT (Bilendo et al. Citation2021).
Also, clustering is used to identify the failure modes to understand the remaining useful life of the components of WT. A clustering analysis utilising the bisecting K-means method is proposed and developed to identify various damage modes for acoustic signals observed during condition monitoring of WT (Liu et al. Citation2020). This method provides technical support for precautionary measures while retaining in-service blades. A novel fast search and find of density peak clustering technique is proposed to enable reliable identification of various damage modes by comparing AE signal similarities (Xu et al. Citation2020). The robustness of the proposed model enabled it to perform better in fault mode identification than other current approaches. Unsupervised Waveform Clustering is used in the damage mode classification study to find distinctive clusters that have proven to be an effective method for categorising the type of damage taking place within a structure during structural health monitoring system of WT (McCrory et al. Citation2015). A sequential approach based on the Gustafson-Kessel clustering algorithm is suggested for the purpose of fatigue detection (Doan et al. Citation2015). In this approach, by minimising the Davies-Bouldin (DB) index, which is typically used to evaluate classification algorithms, the features in this were chosen. Later, to achieve a high level of classification accuracy, a sequential feature selection method based on the k-means clustering algorithm is proposed (Tang et al. Citation2017). The outcomes demonstrate that the features discovered using this methodology serve as reliable indicators for categorising failure modes. A proposed algorithm for fault mode identification uses an autoencoder and the k-means ++ algorithm. This waveform-based clustering model is developed to demonstrate the relationship between fault modes and WT health signals, which enhances the precision of fault mode detection (Wang et al. Citation2023).
A clustering method is proposed for capturing the non-linear correlations between WT parameters, which are used to model the WT's typical behaviour (Wang et al. Citation2019). An important aspect of the proposed framework is how it first uses a clustering approach to divide the turbine operation into various sub-operation conditions, and then uses an optimised deep belief network to create a model of typical turbine behaviour for each sub-operation condition. In evaluating clustering tasks in AI, the Silhouette Score and Davies-Bouldin Index stand as prominent metrics. The Silhouette Score gauges cohesion and separation, producing values between −1 and 1. A higher score signifies well-defined clusters. The Davies-Bouldin Index assesses compactness and separation, with a lower index indicating more effective clustering.
4.3. Regression
Regression is a process that uses observed data points to create a relationship between a number of independent variables or features and the dependent variable in order to forecast the values of the future unknown. The time-varying nature of SCADA data and health data obtained during the condition monitoring of WT makes it ideal for applying regression strategies to predict an abnormality in the future. The sequential health data collected during the monitoring of WT is modelled using AI regression algorithms, and the results are compared with the actual values. The residual values obtained through this processing can be used to identify any anomalies in WT's operation. Several AI-based methods used for time series forecasting on WT health data range from machine learning (ML) methods to deep learning (DL) methods. Likewise, hybrid and ensemble AI approaches have produced better results when performing the regression task on the health data of WT. A support vector regression-based signal reconstruction modelling approach is proposed, in which multiple statistical indicators such as the Deviation Index, Volatility Index, and Significance Index are utilised to identify deviations from normal conditions and recognise faults at early phases (Yang et al. Citation2019). A novel condition monitoring method for WTs based on Long Short-Term Memory (LSTM) algorithms has proven to be effective and to increase the reliability of wind farms, when validated for the case study (Qian et al. Citation2019). The random and non-stationary characteristics of the WT parameters have also been accommodated by the non-linear modelling efficacy of ANN algorithms in order to predict its future values (Mahmoud, Dong, and Ma Citation2018). DNN is more accurate and can handle more complex models than conventional ANN techniques. Additionally, it has been shown that DNN performs better than traditional machine learning techniques (Surucu, Gadsden, and Yawney Citation2023). The logical relationship between observed variables chosen via elasticnet is established using a combined CNN-LSTM based approach in order to forecast and provide over-temperature WT bearing fault warning (Fu et al. Citation2019). The demonstrated evaluation experiments attest to the proposed method's high usefulness and generalizability.
The prognostic task of predicting a WT component's Remaining Useful Life also uses the regression assignments. The RUL of an operational WT gearbox is predicted based on vibration measurements using a combination of two supervised machine learning techniques, namely, regression model and multilayer ANN model (Elasha et al. Citation2019). The hybrid approach is effective for RUL prediction of a high-speed shaft bearing used in a WT gearbox when compared with the conventional approaches. To address the problem of incomplete and sparse data, a hybrid RUL prediction approach based on the adaptive neuro-fuzzy inference system (ANFIS) and particle filtering (PF) is proposed (Cheng, Qu, and Qiao Citation2017). This fault prognostic model for gearboxes, extracts the fault features and learns the state transition function of the extracted fault feature. From the learned information, the PF algorithm estimates the RUL of the gearbox. The assumption that each of the blades on a turbine are merely identical in terms of their structural properties and experience the same environmental and operational variables (EOVs) is used in the regression task for structural health monitoring of the WT blades. In order to learn the relationships between the pairs of blades when the blades are in a healthy state, the Gaussian Process is proposed to model the edge frequencies of one blade given that of another (Chandrasekhar et al. Citation2021). They are also employed to forecast edge frequencies in order to determine when the blades begin to behave differently from one another over a time period.
The widely used performance metrics for regression tasks include Root Mean Squared Error (RMSE), Mean Absolute Error (MAE), and R-squared (R2) (Fu et al. Citation2019). RMSE quantifies average error magnitude, assigning higher weight to larger errors. MAE calculates average absolute differences, offering a linear representation of error. R2 assesses the proportion of variance explained by the model. Collectively, these metrics provide a comprehensive evaluation of a regression model's accuracy, precision, and ability to capture variability in the data.
4.4. Anomaly detection
When the condition of a WT is being monitored, a variety of WT parameters are captured, from which a number of fault characteristics can be observed. For the stable and secure operation of WT, it is crucial to carry out state monitoring and anomaly detecting from the observed fault characteristics. For attaining this, a variety of AI-based strategies are been proposed. A non-singleton fuzzy logic system for WT anomaly identification is proposed, and it is based on a mechanism of expanding linguistic terms and rules (Qu et al. Citation2020). This overcomes the problem of limited linguistic terms and rules in singleton input. To find anomalies and identify problems with WTs, an integrated approach is proposed where the Mahalanobis space is established as a reference space to detect abnormal conditions of WTs after the SCADA data of healthy WTs were modelled (Jin, Xu, and Qiao Citation2020). The proposed model, which consists of a hybrid CNN-LSTM model with attention mechanism to capture the important features, can execute early warning for anomaly status and determine the faulty element through residuals predictions (Xiang et al. Citation2021). Similar to this, a hybrid CNN-BiGRU system with attention mechanism is used to identify failed WT elements and identify early abnormal functioning. Significant information is strengthened by the attention mechanism to increase the impact on learning.
A proposed architecture uses multiple restricted Boltzmann machines (RBM) to implement the DAE network model (Zhao et al. Citation2018). In order to reflect the component health condition, the architecture employs a reconstruction error (Re) that is calculated using the DAE network input and its output reconstruction value. The condition detection index is defined by Re to reflect component health and identify any operational anomalies in WT. In order to detect anomalies in a SCADA dataset with features like wind speed, nacelle position, temperature, blade pitch angle, and yaw inaccuracies as input features, a coupled architecture made up of isolate forests and deep neural networks is used (Lin, Liu, and Collu Citation2020). An anomaly score which was 1 for normal values and −1 for anomalies is used for decision making. To find anomalies in the SCADA dataset, another hybrid architecture with RNN and XGBoost is proposed (Chatterjee and Dethlefs Citation2020). When tested on onshore farm WT data, the hybrid model developed for off-shore wind farm data can identify anomalies with 85% accuracy. In addition, the potential for anomaly detection in WT condition monitoring is investigated using an SVM-based model with a radial basis function as the kernel (Pandit and Infield Citation2019). This model incorporates statistical learning theory and structural risk minimisation principle which turns significant for modeling nonlinear systems. Gaussian Process based modeling is proposed for early detecting anomalies in yaw alignment (SCADA-based WT anomaly detection using Gaussian process models for WT condition monitoring purposes, Ravi Kumar Pandit). The improved performance of the proposed method is reflected in an effective yaw error control, which in turn reduces power loss. The WT gearbox anomaly detection problem is formulated using a proposed approach that uses twin support vector machines and adaptive thresholds (Dhiman et al. Citation2021). The gearbox oil and bearing temperatures features from the SCADA dataset of UK wind farms are considered as two univariate time-series for analysing adaptive threshold.
The objective of anomaly detection is to locate the underlying causes of unanticipated changes in the performance of the product. Most methods currently in use do not effectively extract features from the data and make little use of the temporal order of the data. A proposed model based on a hybrid combination of long short-term memory and autoencoder evaluate the sequential ordering of condition monitoring data of the WT to overcome the challenges in anomaly detection (Chen et al. Citation2021). The effectiveness of the hybrid model is evaluated using a real-time condition monitoring dataset of WT. Based on multivariate analysis, a method for locating anomalies in a WT is proposed (Chen et al. Citation2020). A stacked denoising autoencoders model with a moving window and different noise levels is developed to reconstruct the normal operating data. The moving window and stacked denoising autoencoders model capture both the associated temporal dependency and correlations between various variables. The monitoring indicator that is used to identify anomalies is then derived from the reconstruction error. A proposed Sparse Bayesian Learning (SBL) and hypothesis testing (HT) coupled anomaly detection method for gearbox oil temperature of WT uses SBL to estimate the potential variation range of the oil temperature for each operating condition at a given confidence level, and HT to verify whether the actual temperature value falls within the predicted range with a high enough probability (Zeng, Yang, and Bo Citation2020). In Anomaly Detection, Precision assesses accuracy in flagged anomalies, while Recall measures the model's ability to identify actual anomalies. Balancing both is crucial, often evaluated comprehensively with metrics like F1-score.
4.5. Classification
Predicting group labels, or classes from observations is the main task of classification. A wide range of AI-based approaches are proposed for performing classification task. Proper maintenance of WT is critical, and it depends on accurately identifying the fault during WT diagnosis in condition monitoring. A proposed approach for identifying WT blade delamination uses features extracted from ultrasonic signals by the nonlinear autoregressive with exogenous input system (NARX) using several ML algorithms such as Decision Trees, Discriminant Analysis, Quadratic Support Vector Machines, Nearest Neighbours, and Ensemble Classification (Jiménez et al. Citation2020). According to the evaluations, the Quadratic Support Vector Machines outperformed the other models. A similar study performs the detection of ice on WT blades with the help of ML classifiers such as Decision tree, Discriminant Analysis, Support Vector Machines, K-Nearest Neighbours, and Ensemble Classifiers (Jiménez et al. Citation2019). In this study, linear algorithms like AutoRegressive (AR) and Principal Component Analysis, as well as nonlinear algorithms like nonlinear-AR eXogenous and Hierarchical Non-Linear Principal Component Analysis, are used to extract features from observed ultrasonic waves during WT condition monitoring, and feature selection is done with Neighbourhood Component Analysis. In addition, lazy ML classifiers such as nearest neighbour, k-nearest neighbours, locally weighted learning, and K-star classifier are used to classify WT blade faults, where the features extracted from the vibration signals by the histogram approach (Joshuva and Sugumaran Citation2020). A proposed covariance alignment (COVAL) of fault features has higher accuracy in rolling bearing multi-state classification under variable working conditions. A number of mode components are produced by transforming the signals under various conditions in accordance with the vibration signal characteristics of WTs. The traditional machine learning methods are not ideal for fault classification when the source domain and the target domain data come from different working conditions. A proposed method reduces the divergence in data distribution between the source domain and the target domain by reducing the covariance between the source and target domain using a linear transformation matrix (Ren et al. Citation2019). The support vector machine (SVM) is then used to classify the source and target domain feature vectors that have been covariance aligned. Under a variety of working conditions, SVM is found to perform better than other techniques in the multiclass classification of WT rolling bearings. When diagnosing WT high-speed bearing monitoring, the adaptive resonance theory 2 (ART2) is proposed for an unsupervised classification of the extracted features of vibration signals (Ben Ali et al. Citation2018). Even with noisy measurements, this proposed model has a better ability to generalise than previous studies. Using wind farm supervisory control and data acquisition (SCADA) data, a deep joint variational autoencoder (JVAE)-based monitoring method was developed to decrease the false alarms that arises during the diagnosis of gearbox failure. In this approach, a statistical process control chart is created to track residual errors and sound alarms (Yang and Zhang Citation2020). In this method, residual errors are tracked and alarms are generated using a statistical procedure-based control chart. An image recognition model based on a deep learning network is proposed for the precise and effective detection of damage to WT blades as well as the automatic extraction of image features (Yang et al. Citation2021). Transfer learning is used to extract abstract features and increase convergence efficiency after the blade image has been segmented using the Otsu threshold segmentation method. The accuracy of blade defect detection is then improved using a random forest-based ensemble learning classifier. The presence of structural damage to floating offshore wind turbine (FOWT) blades as well as its location could be identified with an accuracy of 94.8% using Long Short-Term Memory (LSTM) and Gated Recurrent Unit (GRU) neural networks (Choe, Kim, and Kim Citation2021). In order to increase the structural safety, engineers can use the enormous amounts of digital data by using sequence-based modelling.
In WT fault classification, deep learning models play a crucial role. To diagnose errors in WT, a proposed transfer learning and convolutional autoencoder (CAE) based DL is used (Li et al. Citation2021). For the classification of two failure modes, such as blade icing accretion and gear cog belt fracture, a framework utilising transfer learning algorithms, Inception V3 and TrAdaBoost is trained on SCADA data (Chen et al. Citation2021). Similar to this, in the proposed concurrent convolution neural network (CeCNN), the characteristics are directly and adaptively learned from the input to classify bearing data (Chang et al. Citation2020). The raw data is fed into the network without any prior knowledge. Additionally, DL models like the Convolutional Neural Network (CNN) model (Reddy et al. Citation2019) and the VGG-11 model (Xu, Wen, and Liu Citation2019) are used to categorise the images according to the severity of WT blade damage. The comprehensive evaluation of a classification model's effectiveness and discrimination capability is assessed using metrics such as accuracy, precision, recall (or sensitivity), F1 score, and Area Under the Receiver Operating Characteristic (ROC) Curve (AUC-ROC). Accuracy provides an overall measure of correct predictions, while precision focuses on the accuracy of positive predictions. Recall assesses the ability to capture all relevant positive instances. The F1 score balances precision and recall, offering a comprehensive metric considering both false positives and false negatives. AUC-ROC evaluates the classifier's ability to discriminate between classes across different threshold values (Li et al. Citation2021).
4.6. Performance monitoring
Performance evaluation improves the effectiveness of the running WT and determines the health of the turbine. According to research, SCADA data are appropriate for this task, but greater resolution is needed for a more effective tool. The health of the turbine can be used to assess its performance, and doing so has given researchers a chance to more thoroughly evaluate the performance. The IEC 61400-12 (International Electro technical Commission) deals with the performance of an operational WT by dividing the power curve into bins of 0.5 m/s wind speeds and estimating the average power value for every bin (Zhao et al. Citation2018). Various methodologies contribute to a comprehensive WT performance monitoring framework. One method critiques conventional univariate power curves, highlighting their inadequacy in explaining WT performance. It proposes exploring multivariate power curves, integrating diverse input variables, and applying explainable AI (XAI) methods for intricate interpretation (Astolfi, De Caro, and Vaccaro Citation2023). Another approach involves the utilisation of neural networks for WT power generation monitoring, specifically focusing on component efficiency. The system incorporates AI for analysing SCADA data, developing degradation models, and employing a Cumulative Sum algorithm for change detection (Shaheen and Németh Citation2023). This dual-model strategy ensures a precise assessment and robust monitoring of abnormal states resulting from WT component efficiency degradation.
A number of probabilistic and non-parametric methods can be used to represent the power curve of a WT (Rogers et al. Citation2020). This feature is essential for efficient performance monitoring. A WT pitch failure can be accurately diagnosed using power estimation (Song et al. Citation2018). To determine pitch misalignment, this method employs a fault scheme based on statistics. The power curve in this model is computed using the wind and wake model, and fault detection is performed using a model-based observer with a closed loop. The yaw alignment, another factor that influences output power, has seen significant advancements recently in terms of performance tracking. In order to forecast wind speed and direction, an auto-regressive integrated moving average is employed (Sales-Setién and Peñarrocha-Alós Citation2020). The yaw rotation manoeuvre is then determined using a Kalman filter. For a proper assessment of each turbine's performance, an accurate assessment of the WT power curve is essential. The use of ANN has shown to be effective in resolving this issue. A proposed study that incorporates a prior automatic filtering through the use of GP modelling significantly enhances network efficiency and saves a significant amount of time and resources. WT power curves are modelled using ANN after data pre-filtering. Results indicate that this method enhances both the conventional ANN modelling and the widely adopted IEC-61400 standard (Manobel et al. Citation2018). Several widely used performance metrics offer objective insights into system reliability, resilience, and efficiency, enabling proactive maintenance and optimisation strategies for overall performance enhancement (Sales-Setién and Peñarrocha-Alós Citation2020). These include Mean Time Between Failures (MTBF), which assesses the average operational time before failure, and Mean Time to Recover (MTTR), measuring the average restoration time post-failure. The metric of Availability is essential, representing the percentage of time a system remains operational over a defined duration.
5. Challenges for AI in condition monitoring WT
5.1 Insufficient or inaccurate data
The WT blades are damaged during the study using artificially accelerated fatigue loads. This method can expedite the testing process, but it might not accurately reflect the fatigue damage that happens to WT blades in the real world when they are operating normally (Liu et al. Citation2020; Yang and Zhang Citation2020). Although SCADA systems can offer a wealth of information on turbine operation, the information is not always reliable or complete. Accurate machine learning models for WT condition monitoring can be challenging to train if important variables are missing or measurements are noisy (Liu et al. Citation2019). Also, during data pre-processing, excessive filtering can eliminate information about the problem and more decomposition levels does not always translate into more accurate outcomes (Jiménez et al. Citation2020). The performance of transfer learning algorithms on data from WTs may be impacted by their potential bias towards the source dataset used for pre-training (Chen et al. Citation2021).
5.2 Limited data availability
Data privacy concerns or data that is not being recorded or stored in a format suitable for analysis can limit the availability of SCADA data. As a result, data sets may be erroneous or incomplete and may not accurately reflect the WT's operational circumstances (Yang and Zhang Citation2020). Even though the integrated condition monitoring scheme for fault diagnosis of a WT produces accurate results, its accuracy is subject to outside influences like temperature, vibration, and other environmental conditions, which are least dealt with in the WT health data that is captured (Inturi et al. Citation2019).
5.3 Labelling data
Labelling data in WT condition monitoring proves intricate due to the nuanced identification of diverse operational states and potential faults. Achieving accurate labels necessitates domain expertise as anomalies may be subtle and context-dependent (Murgia et al. Citation2023). The dynamic nature of environmental conditions introduces variability, making it challenging to establish a comprehensive and static set of labels. Furthermore, SCADA data, a primary source for monitoring, requires specific labelling, involving the categorisation of operational conditions and potential faults. Addressing this challenge involves the development of robust labelling protocols, incorporating expert knowledge to capture the intricacies of WT behaviour. AI plays a pivotal role in automating and enhancing the labelling process. Clustering algorithms, such as K-means and hierarchical clustering, can assist in identifying patterns and categorising unlabelled data into distinct operational states. Additionally, semi-supervised learning approaches, like self-training, leverage a combination of labelled and unlabelled data for improved model accuracy (de Sá et al. Citation2023; Zhang et al. Citation2023). By integrating AI techniques into the labelling process, WT condition monitoring can benefit from more accurate and efficient categorisation of data, ultimately enhancing the reliability of predictive maintenance and fault detection models.
5.4 Feature selection
Feature selection is a technique used in machine learning to improve accuracy. By focusing on the most important variables and removing the redundant and irrelevant ones, it also improves the algorithms’ ability to predict outcomes. Some advantages of feature selection are that it reduces over-fitting, increases accuracy, and shortens training periods. C4.5 decision tree algorithm is used for feature selection in the process of diagnosing WT blade faults (Joshuva et al. Citation2020). It is proposed to use a cutting-edge fault diagnosis feature selection method based on non-negation matrix factorisation (NMF) to improve fault diagnosis efficiency and reduce feature acquisition costs (Liang et al. Citation2016). The accuracy of the fault classification during WT diagnosis may be impacted by the features selected by the SVM classifier (Liu et al. Citation2020). The authors selected 11 different features for their analysis, but other features may also be relevant for identifying damage modes in WT blades (Liu et al. Citation2020). Selecting the correct features is critical because if they overlook additional features that may be relevant for identifying damage modes in WT blades, the accuracy of the task performed by the ML algorithms will be hampered greatly.
5.5 Difficulty in modeling non-linearities
In the process of monitoring the condition of WT, several monitoring variables are used. The relationships between them are not linear. For any ML task, such as regression or classification, it is crucial to record the non-linear correlations between the monitoring variables in order to demonstrate increased accuracy in the algorithm's outcomes. ML models may overfit on training data and perform poorly on new data. The labelled data used for training determines the quality of the results. Only by capturing the non-linearities in the data, precise labels for the target can be estimated (Jiménez et al. Citation2020). ML algorithms such as RVM regression necessitate that input and output variables have a linear relationship. The data's nonlinear relationships might not be captured, which could result in incorrect predictions (Wei, Qian, and Zareipour Citation2019). Some machine learning models do not include physical models or an understanding of the system's underlying physics and instead solely rely on data-driven methodologies. This may make it more difficult for the models to represent the intricate relationships between various components, which may lead to incorrect predictions. Also, it can be difficult to identify the precise causes of maintenance problems because WTs are intricate systems with many interdependent components. Predictions may be inaccurate because machine learning models may find it difficult to consider all the complex interactions between various components (Yeh et al. Citation2019).
5.6 Generalisation issues
Generalisation in machine learning is a definition that shows how well a trained model can categorise or forecast unobserved data that has been taken from an equivalent distribution as the one utilised for training the model. When a machine learning model is generalised, it can be trained to work with any subset of unknown data. Deep learning models tend to be complicated, requiring a lot of computational power and specialised hardware for development and deployment. A model can become overfit when it is trained too well on a particular set of data and fails to generalise to new data, which can also be caused by complexity (Yang and Zhang Citation2020). It may be difficult to diagnose and validate the results of transfer learning algorithms because of their limited interpretability, which could make them less general with any subset of unknown data (Chen et al. Citation2021). The model's performance might be restricted to the particular types of WTs and operating circumstances used in the training data, which might make it less generalisable with any segment of unknown data and make it difficult to diagnose and validate their findings.
5.7 Computational complexity
Most of the proposed ML models for condition monitoring of WT are more complex than conventional models. Therefore, it might need more computing power and more time to train and process data. Particularly, deep learning network training requires a lot of computational resources, such as memory and processing power, which can be costly and time-consuming. It is computationally expensive to train a deep neural network from scratch or to use parameter-based transfer learning. In addition, the pre-trained model may be large and require a lot of computing power, when fine-tuning is necessary (Xu, Wen, and Liu Citation2019; Feng et al. Citation2019).
5.8 Lack of interpretability
Deep learning algorithms are typically black-box models that are difficult to interpret. The black-box neural network model used by the feature-based transfer learning technique for WT condition monitoring is difficult to understand (Astolfi, De Caro, and Vaccaro Citation2023). The lack of an explanation or visualisation of the machine learning model's prediction-making process may make it more difficult for users to understand and have reliability in the model's decisions (Yang et al. Citation2021). The precision of the data used to train ML algorithms is critical to their performance. Because of the uncertainties in the data, the outputs of the ML algorithm may contain errors. This can lead to false positives or false negatives, which can be expensive to correct (Chandrasekhar et al. Citation2021). Only when the model's output is interpretable can it be considered reliable.
5.9 Model Maintenance and cost
Two approaches can be used to implement decision-making for condition-based predictive maintenance: present-condition evaluation-based and future-condition prediction-based (Ahmad and Kamaruddin Citation2012). When a ML model is added to the Decision-making framework, it must be maintained on an ongoing basis to ensure that it continues to function accurately over time. This may entail retraining the models using current data and enhancing them to account for modifications to the system under observation. A decision-making framework that uses real-time ML based WT condition monitoring and fault diagnosis is expensive to implement, especially if it necessitates significant hardware alterations or upgrades (Yang et al. Citation2019).
6. Future trends of AI in condition monitoring
WT health monitoring will increasingly be impacted by AI in the future, particularly in the era of big data from machines. Some of the future trends of AI in WT condition monitoring are as follows:
6.1 Spatiotemporal modeling
The diagnosis and prognosis of the WT condition are regarded to be large-scale complex systems with a variety of measurements from different subsystems or components. The collected data in this system exhibits a variety of characteristics, necessitating the use of more advanced techniques for extraction of features, selection of features, and data pre-processing. Traditional feature extraction techniques and deep learning models tend to concentrate on the extraction of temporal characteristics (i.e. inside every single time-series), whereas the spatial features (which represent the dependencies between various measurements) are rarely discussed or used for diagnosis. In the multivariate scenario, the deep learning structure aims to learn the joint distribution of various time-series data. However, due to the properties of nearby receptors and dimension shifting across the spatial and temporal granularity of the inputs, learning spatial features is still challenging. It has been determined that learning the spatial features can increase the accuracy of the diagnosis and are crucial for diagnosing conditions of WT. The spatiotemporal pattern network (STPN), an approach for spatiotemporal graphical modelling, addresses the problem of handling a shortage of labelled data. The spatial and temporal features between the system's variables are effectively extracted by the spatiotemporal model (Yang, Liu, and Jiang Citation2018). For learning unrevealed operating scenarios and fault severities, a spatiotemporal model that utilises the spatiotemporal pattern network (STPN) method along with convolutional neural networks (CNN) is employed (Han et al. Citation2019). This proposed model shows sufficient generalisation required for handling insufficient labelled data. Similar to this, the proposed Time-distributed ConvLSTM model performs better in both classification and regression based prediction requirements in time series by applying spatiotemporal modelling for machine health monitoring (Qiao et al. Citation2018). An ensemble of deep wavelet networks based on spatial temporal modelling is applied to a thermal image dataset obtained from rotating machinery for the prediction of the machinery's remaining useful life (Jiang et al. Citation2022). Even though there isn't plenty of research done on applying spatiotemporal modelling for monitoring WT condition, there are a lot of work done on applying it in other applications, like tool wear analysis and evaluation (Gao et al. Citation2020), sheath current monitoring, (Wang et al. Citation2019) etc.
6.2 Explainable AI
The eXplainable Artificial Intelligence (XAI) methodologies are a sub-domain of AI techniques that offer a collection of methods or algorithms. Despite the effectiveness of ML algorithms, there are still concerns about the DNN's reliability when used in complex applications as ‘black box’ models, particularly with regard to the decision-making procedures and potential moral, economic, and accountability impacts on stakeholders. The main goals are to arrive at results that are simple to understand and intuitive for everyone involved, as well as those that may help in comprehending the inner workings or structure of the AI models This method also increases practitioners’ confidence, their understanding of how to enhance the model, and their comprehension of the method being modelled. The XAI methodologies may be applied in a variety of situations. Data scientists utilise them to comprehend or enhance the efficiency of the models since they may assist in refining and debugging the models throughout the test and validating phases. Additionally, manufacturers use it to evaluate the model's sturdiness and the effects on its deployment process. Therefore, the explanation is an effective strategy to offer clarity on how decisions are taken and how they may impact users. The ability of the models to generate understandable, human-evaluable decision-making rules is an active quality known as the explainable AI which is an upcoming future trend for developing condition monitoring approaches for WT. The capabilities of the SHapley Additive exPlanation (SHAP) (Brusa et al. Citation2023; Brito et al. Citation2022) Deep SHapley Additive exPlanations (DeepSHAP) (Keleko et al. Citation2023) and local interpretable model-agnostic explanations techniques (LIME) (Sanakkayala et al. Citation2022) for explainable AI in condition monitoring have been the subject of several research. However, only a small number of projects have been carried out with WT condition monitoring, which can be seen as a promising future undertaking.
6.3 Probabilistic reasoning in AI
Probabilistic AI are a promising subdomain of AI which assesses the estimation process uncertainties in addition to providing a deterministic estimate of the WT condition. The probabilistic AI approach explains how to interpret and understand the uncertainty in predictions and models. In a method of knowledge representation known as probabilistic reasoning, the notion of probability is used to denote the degree of knowledge uncertainty. In the presence of ambiguous or incomplete information, belief should change logically, according to probability theory. Network representations are not new to AI systems. Therefore, to represent uncertain knowledge, probabilistic reasoning or uncertain reasoning is required. Information from unreliable sources, experimentation errors, equipment uncertainties, temperature variations due to climate change, and other sources of uncertainty are some of the most frequent ones in the real world that make probabilistic reasoning necessary in AI. Several studies have performed the implementation of probabilistic AI for WT condition monitoring. Based on the assessed uncertainties and residual-based anomaly detection criteria, an abnormal WT condition is proposed (Zhang et al. Citation2019). The proposed probabilistic method has the propensity to accurately identify the faults earlier, allowing for more planning time for maintenance to avoid WT component failure. In another study, WT is being monitored using a probabilistic monitoring strategy, where a nonlinear identification clustering algorithm is first developed to cluster the bins and is then followed by Gaussian process regression (GPR) on every cluster (Jing and Zhao Citation2022). Each prediction made by the proposed regression model can offer distributional data for the related observation, allowing for a soft evaluation of conditional uncertainty. Another study again makes use of GPR which is a nonlinear, nonparametric machine learning method, frequently used to model complex nonlinear systems (Pandit and Infield Citation2018). In order to identify critical WT failures and enhance power performance, the proposed model uses the GPR to estimates operational curves based on important turbine critical variables.
7. Conclusion
This comprehensive review extensively examines WT condition monitoring, encompassing traditional methods and contemporary data-driven solutions. The integration of these approaches provides a detailed perspective on evolving trends in WT condition monitoring. The paper highlights the pivotal role of AI in transitioning from extensive monitoring data to data-driven health assessments, exploring various AI-based approaches and tasks within the field. Additionally, the review delves into the current challenges faced by AI-based WT condition monitoring, addressing interpretability, adaptability, and the integration of spatiotemporal and probabilistic models. Furthermore, it forecasts future trends, guiding the field towards advancements. Future research priorities include improving real-time interpretability and adaptability, particularly with spatiotemporal and probabilistic models, along with investigating the integration of these models with edge computing and assessing their long-term performance across the turbine lifecycle.
Availability of data
Data sharing not applicable – no new data generated.
Acknowledgement
The authors thank VIT for providing ‘VIT RGEMS SEED GRANT’ for carrying out this research work.
Disclosure statement
No potential conflict of interest was reported by the author(s).
Additional information
Funding
References
- Abboud, R. 2021. Non-contact temperature measurement method integrated in the rotor of a rotating machine using fiber Bragg gratings.
- Abdallah, I., V. Ntertimanis, C. Mylonas, K. Tatsis, E. Chatzi, N. Dervilis, W. Keith, and M. Eoghan. 2018. “Fault Diagnosis of Wind Turbine Structures Using Decision Tree Learning Algorithms with big Data.” Saf. Reliab. Soc. a Chang. World, 3053–3061.
- Abdusamad, K. B., D. W. Gao, and E. Muljadi. 2013. “A Condition Monitoring System for Wind Turbine Generator Temperature by Applying Multiple Linear Regression Model.” In 2013 North Am. Power Symp., 1–8. IEEE.
- Ab Wahab, M. N., S. Nefti-Meziani, and A. Atyabi. 2015. “A Comprehensive Review of Swarm Optimization Algorithms.” PLoS One 10: e0122827.
- Ahmad, R., and S. Kamaruddin. 2012. “An Overview of Time-Based and Condition-Based Maintenance in Industrial Application.” Comput. Ind. Eng 63: 135–149.
- Albano, M., L. Lino Ferreira, G. Di Orio, P. Maló, G. Webers, E. Jantunen, I. Gabilondo, M. Viguera, and G. Papa. 2020. “Advanced Sensor-Based Maintenance in Real-World Exemplary Cases.” Automatika 61: 537–553.
- Astolfi, D., F. De Caro, and A. Vaccaro. 2023. “Condition Monitoring of Wind Turbine Systems by Explainable Artificial Intelligence Techniques.” Sensors 23: 5376.
- Azar, K., Z. Hajiakhondi-Meybodi, and F. Naderkhani. 2022. “Semi-supervised Clustering-Based Method for Fault Diagnosis and Prognosis: A Case Study.” Reliab. Eng. Syst. Saf 222: 108405.
- Bach-Andersen, M., B. Rømer-Odgaard, and O. Winther. 2018. “Deep Learning for Automated Drivetrain Fault Detection.” Wind Energy 21: 29–41.
- Bai, X., Z. An, Y. Hou, and Q. Ma. 2017. “Health Assessment and Management of Wind Turbine Blade Based on the Fatigue Test Data.” Microelectron. Reliab 75: 205–214.
- Ben Ali, J., L. Saidi, S. Harrath, E. Bechhoefer, and M. Benbouzid. 2018. “Online Automatic Diagnosis of Wind Turbine Bearings Progressive Degradations Under Real Experimental Conditions Based on Unsupervised Machine Learning.” Appl. Acoust 132: 167–181.
- Benmessaoud, T., A. P. Marugán, K. Mohammedi, and F. P. G. Márquez. 2018. “Fuzzy Logic Applied to SCADA Systems.” In Proc. Elev. Int. Conf. Manag. Sci. Eng. Manag. 11, 749–757. Springer.
- Bilendo, F., H. Badihi, N. Lu, P. Cambron, and B. Jiang. 2021. “An Intelligent Data-Driven Machine Learning Approach for Fault Detection of Wind Turbines.” In 2021 6th Int. Conf. Power Renew. Energy, 444–449. IEEE.
- Bogue, R. 2013. “Sensors for Condition Monitoring: A Review of Technologies and Applications.” Sens. Rev 33: 295–299.
- Brito, L. C., G. A. Susto, J. N. Brito, and M. A. V. Duarte. 2022. “An Explainable Artificial Intelligence Approach for Unsupervised Fault Detection and Diagnosis in Rotating Machinery.” Mech. Syst. Signal Process 163: 108105.
- Brusa, E., L. Cibrario, C. Delprete, and L. G. Di Maggio. 2023. “Explainable AI for Machine Fault Diagnosis: Understanding Features’ Contribution in Machine Learning Models for Industrial Condition Monitoring.” Appl. Sci 13: 2038.
- Catelani, M., L. Ciani, D. Galar, and G. Patrizi. 2020. “Optimizing Maintenance Policies for a yaw System Using Reliability-Centered Maintenance and Data-Driven Condition Monitoring.” IEEE Trans. Instrum. Meas 69: 6241–6249.
- Chandrasekhar, K., N. Stevanovic, E. J. Cross, N. Dervilis, and K. Worden. 2021. “Damage Detection in Operational Wind Turbine Blades Using a new Approach Based on Machine Learning.” Renewable Energy 168: 1249–1264.
- Chang, Y., J. Chen, C. Qu, and T. Pan. 2020. “Intelligent Fault Diagnosis of Wind Turbines via a Deep Learning Network Using Parallel Convolution Layers with Multi-Scale Kernels.” Renewable Energy 153: 205–213.
- Chatterjee, J., and N. Dethlefs. 2020. “Deep Learning with Knowledge Transfer for Explainable Anomaly Prediction in Wind Turbines.” Wind Energy 23: 1693–1710.
- Chen, J., J. Li, W. Chen, Y. Wang, and T. Jiang. 2020. “Anomaly Detection for Wind Turbines Based on the Reconstruction of Condition Parameters Using Stacked Denoising Autoencoders.” Renewable Energy 147: 1469–1480.
- Chen, P., Y. Li, K. Wang, M. J. Zuo, P. S. Heyns, and S. Baggeröhr. 2021aa. “A Threshold Self-Setting Condition Monitoring Scheme for Wind Turbine Generator Bearings Based on Deep Convolutional Generative Adversarial Networks.” Measurement 167: 108234.
- Chen, H., H. Liu, X. Chu, Q. Liu, and D. Xue. 2021ba. “Anomaly Detection and Critical SCADA Parameters Identification for Wind Turbines Based on LSTM-AE Neural Network.” Renewable Energy 172: 829–840.
- Chen, W., Y. Qiu, Y. Feng, Y. Li, and A. Kusiak. 2021bb. “Diagnosis of Wind Turbine Faults with Transfer Learning Algorithms.” Renewable Energy 163: 2053–2067.
- Chen, L., G. Xu, Q. Zhang, and X. Zhang. 2019. “Learning Deep Representation of Imbalanced SCADA Data for Fault Detection of Wind Turbines.” Measurement 139: 370–379.
- Cheng, J. C. P., W. Chen, K. Chen, and Q. Wang. 2020. “Data-driven Predictive Maintenance Planning Framework for MEP Components Based on BIM and IoT Using Machine Learning Algorithms.” Autom. Constr 112: 103087.
- Cheng, F., L. Qu, and W. Qiao. 2017. “Fault Prognosis and Remaining Useful Life Prediction of Wind Turbine Gearboxes Using Current Signal Analysis.” IEEE Transactions on Sustainable Energy 9: 157–167.
- Choe, D.-E., H.-C. Kim, and M.-H. Kim. 2021. “Sequence-based Modeling of Deep Learning with LSTM and GRU Networks for Structural Damage Detection of Floating Offshore Wind Turbine Blades.” Renewable Energy 174: 218–235.
- Coronado, D., and J. Wenske. 2018. “Monitoring the Oil of Wind-Turbine Gearboxes: Main Degradation Indicators and Detection Methods.” Machines 6: 25.
- Dahiya, R. 2018. “Condition Monitoring of Wind Turbine for Rotor Fault Detection Under non Stationary Conditions.” Ain Shams Eng. J 9: 2441–2452.
- Danielsen, H. K., A. J. Carrasco, S. Fæster, K. V. Dahl, F. G. Guzmán, P. Sauvage, and G. Jacobs. 2019. “3D X-ray Computerized Tomography of White Etching Cracks (WEC).” Mater. Charact 150: 78–87.
- Dao, P. B., W. J. Staszewski, T. Barszcz, and T. Uhl. 2018. “Condition Monitoring and Fault Detection in Wind Turbines Based on Cointegration Analysis of SCADA Data.” Renewable Energy 116: 107–122.
- de Sá, F. P. G., R. de C. Coutinho, E. Ogasawara, D. Brandão, and R. F. Toso. 2023. “Wind Turbine Fault Detection: A Semi-Supervised Learning Approach with two Different Dimensionality Reduction Techniques.” Int. J. Innov. Comput. Appl 14: 67–77.
- Dhiman, H. S., D. Deb, S. M. Muyeen, and I. Kamwa. 2021. “Wind Turbine Gearbox Anomaly Detection Based on Adaptive Threshold and Twin Support Vector Machines.” IEEE Trans. Energy Convers 36: 3462–3469.
- Doan, D. D., E. Ramasso, V. Placet, S. Zhang, L. Boubakar, and N. Zerhouni. 2015. “An Unsupervised Pattern Recognition Approach for AE Data Originating from Fatigue Tests on Polymer–Composite Materials.” Mech. Syst. Signal Process 64: 465–478.
- Dong, M., M. Sun, D. Song, L. Huang, J. Yang, and Y. H. Joo. 2022. “Real-time Detection of Wind Power Abnormal Data Based on Semi-Supervised Learning Robust Random Cut Forest.” Energy 257: 124761.
- Durbhaka, G. K., B. Selvaraj, M. Mittal, T. Saba, A. Rehman, and L. M. Goyal. 2021. “Swarm-LSTM: Condition Monitoring of Gearbox Fault Diagnosis Based on Hybrid LSTM Deep Neural Network Optimized by Swarm Intelligence Algorithms.” C. Mater. Contin 66: 2041–2059.
- Elasha, F., S. Shanbr, X. Li, and D. Mba. 2019. “Prognosis of a Wind Turbine Gearbox Bearing Using Supervised Machine Learning.” Sensors 19: 3092.
- Feng, T., Y. Liu, Q. Li, and Z. Ren. 2023. “Health Monitoring for Variable Pitch Systems of Wind Turbine Using Multi-Layer Perceptron Strategy.” In Adv. Guid. Navig. Control Proc. 2022 Int. Conf. Guid. Navig. Control, 248–254. Springer.
- Feng, B., D. Zhang, Y. Si, X. Tian, and P. Qian. 2019. “A Condition Monitoring Method of Wind Turbines Based on Long Short-Term Memory Neural Network.” In 2019 25th Int. Conf. Autom. Comput., 1–4. IEEE.
- Fernandez-Gauna, B., M. Graña, J.-L. Osa-Amilibia, and X. Larrucea. 2022. “Actor-Critic Continuous State Reinforcement Learning for Wind-Turbine Control Robust Optimization.” Inf. Sci. (NY 591: 365–380.
- Frankenstein, B., L. Schubert, N. Meyendorf, H. Friedmann, and C. Ebert. 2009. “Monitoring System of Wind Turbine Rotor Blades.” In Smart Sens. Phenomena, Technol. Networks, Syst., 260–271. SPIE.
- Fu, J., J. Chu, P. Guo, and Z. Chen. 2019. “Condition Monitoring of Wind Turbine Gearbox Bearing Based on Deep Learning Model.” IEEE Access 7: 57078–57087.
- Gao, Z., M. Chen, W. G. Guo, and J. Li. 2020. “Tool Wear Characterization and Monitoring with Hierarchical Spatio-Temporal Models for Micro-Friction Stir Welding.” J. Manuf. Process 56: 1353–1365.
- Ghaheri, A., S. Shoar, M. Naderan, and S. S. Hoseini. 2015. “The Applications of Genetic Algorithms in Medicine.” Oman Med. J 30: 406.
- Gielen, D., F. Boshell, D. Saygin, M. D. Bazilian, N. Wagner, and R. Gorini. 2019. “The Role of Renewable Energy in the Global Energy Transformation.” Energy Strateg. Rev 24: 38–50.
- Gonzalo, A. P., T. Benmessaoud, M. Entezami, and F. P. G. Márquez. 2022. “Optimal Maintenance Management of Offshore Wind Turbines by Minimizing the Costs.” Sustain. Energy Technol. Assessments 52: 102230.
- Han, T., C. Liu, L. Wu, S. Sarkar, and D. Jiang. 2019. “An Adaptive Spatiotemporal Feature Learning Approach for Fault Diagnosis in Complex Systems.” Mech. Syst. Signal Process 117: 170–187.
- Huang, D., W.-A. Zhang, F. Guo, W. Liu, and X. Shi. 2021. “Wavelet Packet Decomposition-Based Multiscale CNN for Fault Diagnosis of Wind Turbine Gearbox.” IEEE Trans. Cybern.
- Ibrahim, R., J. Weinert, and S. Watson. 2016. “Neural Networks for Wind Turbine Fault Detection via Current Signature Analysis.
- Inturi, V., G. R. Sabareesh, K. Supradeepan, and P. K. Penumakala. 2019. “Integrated Condition Monitoring Scheme for Bearing Fault Diagnosis of a Wind Turbine Gearbox.” Journal of Vibration and Control 25: 1852–1865.
- Jiang, G., H. He, J. Yan, and P. Xie. 2018. “Multiscale Convolutional Neural Networks for Fault Diagnosis of Wind Turbine Gearbox.” IEEE Trans. Ind. Electron 66: 3196–3207.
- Jiang, N., X. Hu, and N. Li. 2020. “Graphical Temporal Semi-Supervised Deep Learning–Based Principal Fault Localization in Wind Turbine Systems.” Proc. Inst. Mech. Eng. Part I J. Syst. Control Eng 234: 985–999.
- Jiang, Y., T. Xia, D. Wang, X. Fang, and L. Xi. 2022a. “Adversarial Regressive Domain Adaptation Approach for Infrared Thermography-Based Unsupervised Remaining Useful Life Prediction.” IEEE Trans. Ind. Informatics 18: 7219–7229.
- Jiang, Y., T. Xia, D. Wang, X. Fang, and L. Xi. 2022b. “Spatiotemporal Denoising Wavelet Network for Infrared Thermography-Based Machine Prognostics Integrating Ensemble Uncertainty.” Mech. Syst. Signal Process 173: 109014.
- Jiang, G., P. Xie, H. He, and J. Yan. 2017. “Wind Turbine Fault Detection Using a Denoising Autoencoder with Temporal Information.” IEEE/ASME Transactions on Mechatronics 23: 89–100.
- Jiménez, A. A., F. P. G. Márquez, V. B. Moraleda, and C. Q. G. Muñoz. 2019. “Linear and Nonlinear Features and Machine Learning for Wind Turbine Blade ice Detection and Diagnosis.” Renewable Energy 132: 1034–1048.
- Jiménez, A. A., L. Zhang, C. Q. G. Muñoz, and F. P. G. Márquez. 2020. “Maintenance Management Based on Machine Learning and Nonlinear Features in Wind Turbines.” Renewable Energy 146: 316–328.
- Jin, X., Z. Xu, and W. Qiao. 2020. “Condition Monitoring of Wind Turbine Generators Using SCADA Data Analysis.” IEEE Transactions on Sustainable Energy 12: 202–210.
- Jing, H., and C. Zhao. 2022. “Adjustable Piecewise Regression Strategy Based Wind Turbine Power Forecasting for Probabilistic Condition Monitoring.” Sustain. Energy Technol. Assessments 52: 102013.
- Jing, L., M. Zhao, P. Li, and X. Xu. 2017. “A Convolutional Neural Network Based Feature Learning and Fault Diagnosis Method for the Condition Monitoring of Gearbox.” Measurement 111: 1–10.
- Joshuva, A., R. S. Kumar, S. Sivakumar, G. Deenadayalan, and R. Vishnuvardhan. 2020. “An Insight on VMD for Diagnosing Wind Turbine Blade Faults Using C4.5 as Feature Selection and Discriminating Through Multilayer Perceptron.” Alexandria Engineering Journal 59: 3863–3879.
- Joshuva, A., and V. Sugumaran. 2020. “A Lazy Learning Approach for Condition Monitoring of Wind Turbine Blade Using Vibration Signals and Histogram Features.” Measurement 152: 107295.
- Keleko, A. T., B. Kamsu-Foguem, R. H. Ngouna, and A. Tongne. 2023. “Health Condition Monitoring of a Complex Hydraulic System Using Deep Neural Network and DeepSHAP Explainable XAI.” Adv. Eng. Softw 175: 103339.
- Koh, P. W., and P. Liang. 2017. “Understanding Black-Box Predictions via Influence Functions.” In Int. Conf. Mach. Learn., 1885–1894. PMLR.
- Kong, Z., B. Tang, L. Deng, W. Liu, and Y. Han. 2020. “Condition Monitoring of Wind Turbines Based on Spatio-Temporal Fusion of SCADA Data by Convolutional Neural Networks and Gated Recurrent Units.” Renewable Energy 146: 760–768.
- Kouadri, A., M. Hajji, M.-F. Harkat, K. Abodayeh, M. Mansouri, H. Nounou, and M. Nounou. 2020. “Hidden Markov Model Based Principal Component Analysis for Intelligent Fault Diagnosis of Wind Energy Converter Systems.” Renewable Energy 150: 598–606.
- Lee, J., and N.-W. Cho. 2016. “Fast Outlier Detection Using a Grid-Based Algorithm.” PLoS One 11: e0165972.
- Lei, J., C. Liu, and D. Jiang. 2019. “Fault Diagnosis of Wind Turbine Based on Long Short-Term Memory Networks.” Renewable Energy 133: 422–432.
- Li, Y., W. Jiang, G. Zhang, and L. Shu. 2021a. “Wind Turbine Fault Diagnosis Based on Transfer Learning and Convolutional Autoencoder with Small-Scale Data.” Renewable Energy 171: 103–115.
- Li, G., C. Wang, D. Zhang, and G. Yang. 2021b. “An Improved Feature Selection Method Based on Random Forest Algorithm for Wind Turbine Condition Monitoring.” Sensors 21: 5654.
- Li, N., X. Yun, Q. Han, B. Wen, and J. Zhai. 2023. “Characterization Method of Rolling Bearing Operation State Based on Feature Information Fusion.” J. Mech. Sci. Technol 37: 1197–1205.
- Liang, L., F. Liu, M. Li, K. He, and G. Xu. 2016. “Feature Selection for Machine Fault Diagnosis Using Clustering of non-Negation Matrix Factorization.” Measurement 94: 295–305.
- Liang, X., G. Wang, M. R. Min, Y. Qi, and Z. Han. 2019. “A Deep Spatio-Temporal Fuzzy Neural Network for Passenger Demand Prediction.” In Proc. 2019 SIAM Int. Conf. Data Min., SIAM, 100–108.
- Lin, Z., X. Liu, and M. Collu. 2020. “Wind Power Prediction Based on High-Frequency SCADA Data Along with Isolation Forest and Deep Learning Neural Networks.” Int. J. Electr. Power Energy Syst 118: 105835.
- Liu, Y., H. Cheng, X. Kong, Q. Wang, and H. Cui. 2019. “Intelligent Wind Turbine Blade Icing Detection Using Supervisory Control and Data Acquisition Data and Ensemble Deep Learning.” Energy Sci. Eng 7: 2633–2645.
- Liu, Y., T. Wang, and F. Chu. 2024. “Hybrid Machine Condition Monitoring Based on Interpretable Dual Tree Methods Using Wasserstein Metrics.” Expert Syst. Appl 235: 121104.
- Liu, P., D. Xu, J. Li, Z. Chen, S. Wang, J. Leng, R. Zhu, L. Jiao, W. Liu, and Z. Li. 2020. “Damage Mode Identification of Composite Wind Turbine Blade Under Accelerated Fatigue Loads Using Acoustic Emission and Machine Learning.” Struct. Heal. Monit 19: 1092–1103.
- Liu, J., G. Yang, X. Li, Q. Wang, Y. He, and X. Yang. 2023. “Wind Turbine Anomaly Detection Based on SCADA: A Deep Autoencoder Enhanced by Fault Instances.” ISA Transactions.
- Liu, H., C. Yu, and C. Yu. 2021. “A New Hybrid Model Based on Secondary Decomposition, Reinforcement Learning and SRU Network for Wind Turbine Gearbox oil Temperature Forecasting.” Measurement 178: 109347.
- Mahmoud, T., Z. Y. Dong, and J. Ma. 2018. “An Advanced Approach for Optimal Wind Power Generation Prediction Intervals by Using Self-Adaptive Evolutionary Extreme Learning Machine.” Renewable Energy 126: 254–269.
- Manobel, B., F. Sehnke, J. A. Lazzús, I. Salfate, M. Felder, and S. Montecinos. 2018. “Wind Turbine Power Curve Modeling Based on Gaussian Processes and Artificial Neural Networks.” Renewable Energy 125: 1015–1020.
- Mao, W., N. Dai, and H. Li. 2019. “Economic Dispatch of Microgrid Considering Fuzzy Control Based Storage Battery Charging and Discharging.” J. Electr. Syst 15.
- Márquez, F. P. G., A. M. Tobias, J. M. P. Pérez, and M. Papaelias. 2012. “Condition Monitoring of Wind Turbines: Techniques and Methods.” Renewable Energy 46: 169–178.
- McCrory, J. P., S. K. Al-Jumaili, D. Crivelli, M. R. Pearson, M. J. Eaton, C. A. Featherston, M. Guagliano, K. M. Holford, and R. Pullin. 2015. “Damage Classification in Carbon Fibre Composites Using Acoustic Emission: A Comparison of Three Techniques.” Compos. Part B Eng 68: 424–430.
- Mehlan, F. C., and A. R. Nejad. 2023. “Rotor Imbalance Detection and Diagnosis in Floating Wind Turbines by Means of Drivetrain Condition Monitoring.” Renewable Energy.
- Murgia, A., R. Verbeke, E. Tsiporkova, L. Terzi, and D. Astolfi. 2023. “Discussion on the Suitability of SCADA-Based Condition Monitoring for Wind Turbine Fault Diagnosis Through Temperature Data Analysis.” Energies 16: 620.
- Nam, S., and J. Hur. 2019. “A Hybrid Spatio-Temporal Forecasting of Solar Generating Resources for Grid Integration.” Energy 177: 503–510.
- Ogaili, A. A. F., A. A. Jaber, and M. N. Hamzah. 2023. “Statistically Optimal Vibration Feature Selection for Fault Diagnosis in Wind Turbine Blade.” Int. J. Renew. Energy Res 13: 1082–1092.
- Orozco, R., S. Sheng, and C. Phillips. 2018. “Diagnostic Models for Wind Turbine Gearbox Components Using Scada Time Series Data.” In 2018 IEEE Int. Conf. Progn. Heal. Manag., 1–9. IEEE.
- Ou, Y., K. E. Tatsis, V. K. Dertimanis, M. D. Spiridonakos, and E. N. Chatzi. 2021. “Vibration-Based Monitoring of a Small-Scale Wind Turbine Blade Under Varying Climate Conditions. Part I: An Experimental Benchmark.” Struct. Control Heal. Monit 28: e2660.
- Pandit, R., and D. Infield. 2018. “Gaussian Process Operational Curves for Wind Turbine Condition Monitoring.” Energies 11: 1631.
- Pandit, R. K., and D. Infield. 2019. “Comparative Assessments of Binned and Support Vector Regression-Based Blade Pitch Curve of a Wind Turbine for the Purpose of Condition Monitoring.” Int. J. Energy Environ. Eng 10: 181–188.
- Peng, J., A. Kimmig, Z. Niu, J. Wang, X. Liu, D. Wang, and J. Ovtcharova. 2022. “Wind Turbine Failure Prediction and Health Assessment Based on Adaptive Maximum Mean Discrepancy.” Int. J. Electr. Power Energy Syst 134: 107391.
- Perez-Sanjines, F., C. Peeters, T. Verstraeten, J. Antoni, A. Nowé, and J. Helsen. 2023. “Fleet-Based Early Fault Detection of Wind Turbine Gearboxes Using Physics-Informed Deep Learning Based on Cyclic Spectral Coherence.” Mech. Syst. Signal Process 185: 109760.
- Pozo, F., Y. Vidal, and Ó Salgado. 2018. “Wind Turbine Condition Monitoring Strategy Through Multiway PCA and Multivariate Inference.” Energies 11: 749.
- Qian, P., X. Tian, J. Kanfoud, J. L. Y. Lee, and T.-H. Gan. 2019. “A Novel Condition Monitoring Method of Wind Turbines Based on Long Short-Term Memory Neural Network.” Energies 12: 3411.
- Qiao, H., T. Wang, P. Wang, S. Qiao, and L. Zhang. 2018. “A Time-Distributed Spatiotemporal Feature Learning Method for Machine Health Monitoring with Multi-Sensor Time Series.” Sensors 18: 2932.
- Qu, F., J. Liu, H. Zhu, and B. Zhou. 2020. “Wind Turbine Fault Detection Based on Expanded Linguistic Terms and Rules Using Non-Singleton Fuzzy Logic.” Applied Energy 262: 114469.
- Reddy, A., V. Indragandhi, L. Ravi, and V. Subramaniyaswamy. 2019. “Detection of Cracks and Damage in Wind Turbine Blades Using Artificial Intelligence-Based Image Analytics.” Measurement 147: 106823.
- Ren, H., W. Liu, M. Shan, and X. Wang. 2019. “A new Wind Turbine Health Condition Monitoring Method Based on VMD-MPE and Feature-Based Transfer Learning.” Measurement 148: 106906.
- Rodriguez, P. C., P. Marti-Puig, C. F. Caiafa, M. Serra-Serra, J. Cusidó, and J. Solé-Casals. 2023. “Exploratory Analysis of SCADA Data from Wind Turbines Using the K-Means Clustering Algorithm for Predictive Maintenance Purposes.” Machines 11: 270.
- Rogers, T. J., P. Gardner, N. Dervilis, K. Worden, A. E. Maguire, E. Papatheou, and E. J. Cross. 2020. “Probabilistic Modelling of Wind Turbine Power Curves with Application of Heteroscedastic Gaussian Process Regression.” Renewable Energy 148: 1124–1136.
- Saenz-Aguirre, A., E. Zulueta, U. Fernandez-Gamiz, A. Ulazia, and D. Teso-Fz-Betono. 2020. “Performance Enhancement of the Artificial Neural Network–Based Reinforcement Learning for Wind Turbine Yaw Control.” Wind Energy 23: 676–690.
- Salakhutdinov, R., and H. Larochelle. 2010. “Efficient Learning of Deep Boltzmann Machines.” In Proc. Thirteen. Int. Conf. Artif. Intell. Stat., 693–700. JMLR Workshop and Conference Proceedings.
- Sales-Setién, E., and I. Peñarrocha-Alós. 2020. “Robust Estimation and Diagnosis of Wind Turbine Pitch Misalignments at a Wind Farm Level.” Renewable Energy 146: 1746–1765.
- Sanakkayala, D. C., V. Varadarajan, N. Kumar, G. Soni, P. Kamat, S. Kumar, S. Patil, and K. Kotecha. 2022. “Explainable AI for Bearing Fault Prognosis Using Deep Learning Techniques.” Micromachines 13: 1471.
- Scheu, M. N., L. Tremps, U. Smolka, A. Kolios, and F. Brennan. 2019. “A Systematic Failure Mode Effects and Criticality Analysis for Offshore Wind Turbine Systems Towards Integrated Condition Based Maintenance Strategies.” Ocean Engineering 176: 118–133.
- Shaheen, B. W., and I. Németh. 2023. “Performance Monitoring of Wind Turbines Gearbox Utilising Artificial Neural Networks—Steps Toward Successful Implementation of Predictive Maintenance Strategy.” Processes 11: 269.
- Shao, H., H. Jiang, H. Zhang, W. Duan, T. Liang, and S. Wu. 2018. “Rolling Bearing Fault Feature Learning Using Improved Convolutional Deep Belief Network with Compressed Sensing.” Mech. Syst. Signal Process 100: 743–765.
- Shayeghi, H., and Y. Hashemi. 2015. “Application of Fuzzy Decision-Making Based on INSGA-II to Designing PV–Wind Hybrid System.” Eng. Appl. Artif. Intell 45: 1–17.
- Sierra-Garcia, J. E., and M. Santos. 2020a. “Wind Turbine Pitch Control First Approach Based on Reinforcement Learning.” In Intell. Data Eng. Autom. Learn. 2020 21st Int. Conf. Guimaraes, Port. Novemb. 4–6, 2020, Proceedings, Part II 21, 260–268. Springer.
- Sierra-Garcia, J. E., and M. Santos. 2020b. “Exploring Reward Strategies for Wind Turbine Pitch Control by Reinforcement Learning.” Appl. Sci 10: 7462.
- Sierra-Garcia, J. E., M. Santos, and R. Pandit. 2022. “Wind Turbine Pitch Reinforcement Learning Control Improved by PID Regulator and Learning Observer.” Eng. Appl. Artif. Intell 111: 104769.
- Singh, S. S., and E. Fernandez. 2017. “Impact of Wind Turbine Generator for on the Reliability and Economics of a Remote WTG System.” In 2017 IEEE Int. Conf. Power, Control. Signals Instrum. Eng., 627–631. IEEE.
- Sivakumar, A., and S. Vaithiyanathan. 2021. “Vibration Based Data Analysis of Single Acting Compressor Through Condition Monitoring and Multilayer Perceptron–A Machine Learning Classifier.” In IOP Conf. Ser. Mater. Sci. Eng., 12032. IOP Publishing.
- Soman, R. 2022. “Multi-Objective Optimization for Joint Actuator and Sensor Placement for Guided Waves Based Structural Health Monitoring Using Fibre Bragg Grating Sensors.” Ultrasonics 119: 106605.
- Song, D., J. Yang, X. Fan, Y. Liu, A. Liu, G. Chen, and Y. H. Joo. 2018. “Maximum Power Extraction for Wind Turbines Through a Novel Yaw Control Solution Using Predicted Wind Directions.” Energy Convers. Manag 157: 587–599.
- Strömbergsson, D., P. Marklund, K. Berglund, J. Saari, and A. Thomson. 2019. “Mother Wavelet Selection in the Discrete Wavelet Transform for Condition Monitoring of Wind Turbine Drivetrain Bearings.” Wind Energy 22: 1581–1592.
- Sun, Z., and H. Sun. 2019. “Stacked Denoising Autoencoder with Density-Grid Based Clustering Method for Detecting Outlier of Wind Turbine Components.” IEEE Access 7: 13078–13091.
- Surucu, O., S. A. Gadsden, and J. Yawney. 2023. “Condition Monitoring Using Machine Learning: A Review of Theory, Applications, and Recent Advances.” Expert Syst. Appl 221: 119738.
- Tang, J., S. Soua, C. Mares, and T.-H. Gan. 2017. “A Pattern Recognition Approach to Acoustic Emission Data Originating from Fatigue of Wind Turbine Blades.” Sensors 17: 2507.
- Thirunavukkarasu, M., Y. Sawle, and H. Lala. 2023. “A Comprehensive Review on Optimization of Hybrid Renewable Energy Systems Using Various Optimization Techniques.” Renew. Sustain. Energy Rev 176: 113192.
- Tian, X., Y. Jiang, C. Liang, C. Liu, Y. Ying, H. Wang, D. Zhang, and P. Qian. 2022. “A Novel Condition Monitoring Method of Wind Turbines Based on GMDH Neural Network.” Energies 15: 6717.
- Turi, J. A., J. Rosak-Szyrocka, M. Mansoor, H. Asif, A. Nazir, and D. Balsalobre-Lorente. 2022. “Assessing Wind Energy Projects Potential in Pakistan: Challenges and Way Forward.” Energies 15: 9014.
- Vidal, Y., F. Pozo, and C. Tutivén. 2018. “Wind Turbine Multi-Fault Detection and Classification Based on SCADA Data.” Energies 11: 3018.
- Wang, M.-H., S.-D. Lu, C.-C. Hsieh, and C.-C. Hung. 2022. “Fault Detection of Wind Turbine Blades Using Multi-Channel CNN.” Sustainability 14: 1781.
- Wang, L.-M., and Y.-M. Shao. 2018. “Crack Fault Classification for Planetary Gearbox Based on Feature Selection Technique and K-Means Clustering Method, Chinese J.” Mech. Eng 31: 1–11.
- Wang, H., H. Wang, G. Jiang, J. Li, and Y. Wang. 2019a. “Early Fault Detection of Wind Turbines Based on Operational Condition Clustering and Optimized Deep Belief Network Modeling.” Energies 12: 984.
- Wang, Z., L. Yao, Y. Cai, and J. Zhang. 2020. “Mahalanobis Semi-Supervised Mapping and Beetle Antennae Search Based Support Vector Machine for Wind Turbine Rolling Bearings Fault Diagnosis.” Renewable Energy 155: 1312–1327.
- Wang, Y., H. Ye, T. Zhang, and H. Zhang. 2019b. “A Data Mining Method Based on Unsupervised Learning and Spatiotemporal Analysis for Sheath Current Monitoring.” Neurocomputing 352: 54–63.
- Wang, J., W. Zhou, X. Ren, M. Su, and J. Liu. 2023. “A Waveform-Based Clustering and Machine Learning Method for Damage Mode Identification in CFRP Laminates.” Compos. Struct 312: 116875.
- Wei, L., Z. Qian, and H. Zareipour. 2019. “Wind Turbine Pitch System Condition Monitoring and Fault Detection Based on Optimized Relevance Vector Machine Regression.” IEEE Transactions on Sustainable Energy 11: 2326–2336.
- Worms, K., C. Klamouris, F. Wegh, L. Meder, D. Volkmer, S. P. Philipps, S. K. Reichmuth, H. Helmers, A. Kunadt, and J. Vourvoulakis. 2017. “Reliable and Lightning-Safe Monitoring of Wind Turbine Rotor Blades Using Optically Powered Sensors.” Wind Energy 20: 345–360.
- Wu, Y., and X. Ma. 2022. “A Hybrid LSTM-KLD Approach to Condition Monitoring of Operational Wind Turbines.” Renewable Energy 181: 554–566.
- Wu, B., and B. M. Wilamowski. 2016. “A Fast Density and Grid Based Clustering Method for Data with Arbitrary Shapes and Noise.” IEEE Trans. Ind. Informatics 13: 1620–1628.
- Xiang, L., P. Wang, X. Yang, A. Hu, and H. Su. 2021. “Fault Detection of Wind Turbine Based on SCADA Data Analysis Using CNN and LSTM with Attention Mechanism.” Measurement 175: 109094.
- Xiao, X., J. Liu, D. Liu, Y. Tang, J. Dai, and F. Zhang. 2021. “SSAE-MLP: Stacked Sparse Autoencoders-Based Multi-Layer Perceptron for Main Bearing Temperature Prediction of Large-Scale Wind Turbines.” Concurr. Comput. Pract. Exp 33: e6315.
- Xiao, X., J. Liu, D. Liu, Y. Tang, and F. Zhang. 2022. “Condition Monitoring of Wind Turbine Main Bearing Based on Multivariate Time Series Forecasting.” Energies 15: 1951.
- Xu, D., P. F. Liu, Z. P. Chen, J. X. Leng, and L. Jiao. 2020. “Achieving Robust Damage Mode Identification of Adhesive Composite Joints for Wind Turbine Blade Using Acoustic Emission and Machine Learning.” Compos. Struct 236: 111840.
- Xu, D., C. Wen, and J. Liu. 2019. “Wind Turbine Blade Surface Inspection Based on Deep Learning and UAV-Taken Images.” J. Renew. Sustain. Energy 11: 53305.
- Yang, W. 2016. “Condition Monitoring of Offshore Wind Turbines.” In Offshore Wind Farms, 543–572. Elsevier.
- Yang, W., R. Court, and J. Jiang. 2013. “Wind Turbine Condition Monitoring by the Approach of SCADA Data Analysis.” Renewable Energy 53: 365–376.
- Yang, W., R. Court, P. J. Tavner, and C. J. Crabtree. 2011. “Bivariate Empirical Mode Decomposition and Its Contribution to Wind Turbine Condition Monitoring.” J. Sound Vib 330: 3766–3782.
- Yang, R., Y. He, and H. Zhang. 2016. “Progress and Trends in Nondestructive Testing and Evaluation for Wind Turbine Composite Blade.” Renew. Sustain. Energy Rev 60: 1225–1250.
- Yang, W., C. Liu, and D. Jiang. 2018. “An Unsupervised Spatiotemporal Graphical Modeling Approach for Wind Turbine Condition Monitoring.” Renewable Energy 127: 230–241.
- Yang, C., J. Liu, Y. Zeng, and G. Xie. 2019. “Real-Time Condition Monitoring and Fault Detection of Components Based on Machine-Learning Reconstruction Model.” Renewable Energy 133: 433–441.
- Yang, B., and D. Sun. 2013. “Testing, Inspecting and Monitoring Technologies for Wind Turbine Blades: A Survey.” Renew. Sustain. Energy Rev 22: 515–526.
- Yang, L., and Z. Zhang. 2020. “Wind Turbine Gearbox Failure Detection Based on SCADA Data: A Deep Learning-Based Approach.” IEEE Trans. Instrum. Meas 70: 1–11.
- Yang, X., Y. Zhang, W. Lv, and D. Wang. 2021. “Image Recognition of Wind Turbine Blade Damage Based on a Deep Learning Model with Transfer Learning and an Ensemble Learning Classifier.” Renewable Energy 163: 386–397.
- Yeh, C.-H., M.-H. Lin, C.-H. Lin, C.-E. Yu, and M.-J. Chen. 2019. “Machine Learning for Long Cycle Maintenance Prediction of Wind Turbine.” Sensors 19: 1671.
- Yeter, B., Y. Garbatov, and C. G. Soares. 2022. “Life-Extension Classification of Offshore Wind Assets Using Unsupervised Machine Learning.” Reliab. Eng. Syst. Saf 219: 108229.
- Yu, X. 2020. Modelling Offshore Wind Farm Operation and Maintenance: The Benefits of Condition Monitoring. Cambridge Scholars Publishing.
- Yu, L., J. Qu, F. Gao, and Y. Tian. 2019. “A Novel Hierarchical Algorithm for Bearing Fault Diagnosis Based on Stacked LSTM.” Shock and Vibration 2019.
- Yu, X., B. Tang, and K. Zhang. 2021. “Fault Diagnosis of Wind Turbine Gearbox Using a Novel Method of Fast Deep Graph Convolutional Networks.” IEEE Trans. Instrum. Meas 70: 1–14.
- Zeng, X. J., M. Yang, and Y. F. Bo. 2020. “Gearbox oil Temperature Anomaly Detection for Wind Turbine Based on Sparse Bayesian Probability Estimation.” Int. J. Electr. Power Energy Syst 123: 106233.
- Zhang, J., G. Cosma, and J. Watkins. 2021a. “Image Enhanced Mask r-cnn: A Deep Learning Pipeline with New Evaluation Measures for Wind Turbine Blade Defect Detection and Classification, J.” Imaging 7: 46.
- Zhang, Y., M. Li, Z. Y. Dong, and K. Meng. 2019. “Probabilistic Anomaly Detection Approach for Data-Driven Wind Turbine Condition Monitoring.” CSEE J. Power Energy Syst 5: 149–158.
- Zhang, G., Y. Li, W. Jiang, and L. Shu. 2022. “A Fault Diagnosis Method for Wind Turbines with Limited Labeled Data Based on Balanced Joint Adaptive Network.” Neurocomputing 481: 133–153.
- Zhang, L., B. Wang, P. Liang, X. Yuan, and N. Li. 2023. “Semi-Supervised Fault Diagnosis of Gearbox Based on Feature pre-Extraction Mechanism and Improved Generative Adversarial Networks Under Limited Labeled Samples and Noise Environment.” Adv. Eng. Informatics 58: 102211.
- Zhang, D., Y. Yang, and H. Fang. 2021b. “A Comparative Study for Multilayer Perception Versus Convolutional Neural Network Based On the Wind Turbine Benchmark Model.” In 2021 33rd Chinese Control Decis. Conf., 3645–3649. IEEE.
- Zhao, B., C. Cheng, Z. Peng, X. Dong, and G. Meng. 2020. “Detecting the Early Damages in Structures with Nonlinear Output Frequency Response Functions and the CNN-LSTM Model.” IEEE Trans. Instrum. Meas 69: 9557–9567.
- Zhao, X., and M. Jia. 2020. “A Novel Unsupervised Deep Learning Network for Intelligent Fault Diagnosis of Rotating Machinery.” Struct. Heal. Monit 19: 1745–1763.
- Zhao, H., H. Liu, W. Hu, and X. Yan. 2018. “Anomaly Detection and Fault Analysis of Wind Turbine Components Based on Deep Learning Network.” Renewable Energy 127: 825–834.
- Zhou, K., E. Diehl, and J. Tang. 2023. “Deep Convolutional Generative Adversarial Network with Semi-Supervised Learning Enabled Physics Elucidation for Extended Gear Fault Diagnosis Under Data Limitations.” Mech. Syst. Signal Process 185: 109772.
- Zhu, A., Q. Zhao, T. Yang, L. Zhou, and B. Zeng. 2023. “Condition Monitoring of Wind Turbine Based on Deep Learning Networks and Kernel Principal Component Analysis.” Comput. Electr. Eng 105: 108538.
- Zitrou, A., T. Bedford, and L. Walls. 2016. “A Model for Availability Growth with Application to New Generation Offshore Wind Farms.” Reliab. Eng. Syst. Saf 152: 83–94.