
 ?Mathematical formulae have been encoded as MathML and are displayed in this HTML version using MathJax in order to improve their display. Uncheck the box to turn MathJax off. This feature requires Javascript. Click on a formula to zoom.
ABSTRACT
A significant portion of energy consumption currently derives from the building stock, which has harms both the environment and the living standard of occupants, while at the European level, the renovation rate of the current building stock remains low. This study presents a methodology for automated retrofitting scenarios in buildings that enhances user awareness through meaningful visualisations and fosters collaboration of renovation professionals with interoperable software solutions. Commercial design software (Autodesk Revit, Graphisoft ArchiCad) generates the Building Information Model (BIM) in the Industry Foundation Class (IFC) format. IFCs are processed by a parsing tool, which translates IFC files into a comprehensible data model. The proposed framework initially examines the asset-based elements and calculates as-designed energy consumption by extracting information from the produced data model. Based on conducted calculations, the proposed schema identifies mandatory renovation actions and generates scenarios for a variety of examined categories. The final output consists of a renovation roadmap that prioritises changes with the greatest impact based on the demand of the building’s stakeholders. The proposed methodology provides a promising approach to help building owners and stakeholders with the identification and prioritisation of energy-saving retrofitting actions, thus contributing to the achievement of energy efficiency goals.
1. Introduction
As the climatic crisis worsens, different approaches and strategies have been developed to minimise the environmental impact across Europe. Europe’s building stock tends to be old and energy-inefficient, being responsible for 40% of energy consumption and 36% of energy-related carbon dioxide emissions (EUCO Citation2021). Despite the potential advantages of the renovation actions to reduce building stock’s energy consumption, the renovation rate remains at low levels due to the building owner’s hesitation regarding retrofit. Building owners often avoid energy-saving investments due to a lack of reliable information and uncertainties regarding potential financial and environmental benefits (Sesana and Salvalai Citation2018).
To face the aforementioned challenges the European Union has introduced the concept of the Energy Performance Certificate (EPC) under the Energy Performance of Buildings Directive (EPBD) (EP and COEU Citation2002). The main purpose of the EPC concept is to depict useful information about buildings’ performance to raise user awareness. However, EPCs are often issued once every decade or in case of building’s rent and sale according to national legislation making them more of an administrative burden and not as a useful informative report. Moreover, most EPCs provide a standard list of renovation suggestions to increase the building’s energy performance, without considering financial and environmental impact EPC-related services such as on-site energy auditing are characterised by a high level of subjectivity, which strengthens the building owner’s indecision. It is mandatory to provide comprehensible information to the building owner that will make the decision to rent or invest into the property.
Building’s carbon footprint and the confusion of the building owners are addressed with different measures, laws and concepts in Europe. In 2020, the European Commission (EC) published the Renovation Wave Strategy (EC Citation2020). The most essential parts of the Renovation Wave include the carbon neutrality goal in building stock until 2050 and the revision of the Energy Performance of Building Directive (EPBD). The accomplishment of the carbon-neutral building is linked with EPBD’s revision. EPBD revision emphasises that an increase in the depth and rate of renovation actions across all Member States (MS) is mandatory for reaching the 2050 goal, by introducing the definition of deep renovation concept (Dorizas-Bpie et al. Citation2023). Also, the revision of EPBD suggests various concepts to enhance citizen awareness regarding the renovation advantages (EC Citation2020). According to the revised EPBD Article 10, all MS should introduce a Building Renovation Passport (BRP) scheme by 2024, including a customised renovation roadmap indicating a sequence of a gradual procedure toward zero-emission building until 2050. The concept of Building Digital Logbooks (DBLs) accompanies BRPs to tackle issues like energy poverty and facilitate decision-making for retrofitting projects. The revised EPBD also highlights the linkage between EPC and the renovation action concept. Most Member States have already adopted the nearly- Zero Emission Building (nZEB) definition in their legislation for tertiary and residential buildings (Dorizas-Bpie et al. Citation2023), enabling the setting of energy consumption goals for 2050 based on renovation outcomes.
After the introduction, the paper is divided into five more sections. Section 2 provides a literature review of renovation findings at national and research levels. Section 3 describes in an analytical manner the implemented methodology. Section 4 elucidates the scheme’s general output and illustrates a visualisation of the calculated results. Section 0 discusses the development challenges and the role of the EPC assessor in the proposed framework. A conclusion is offered in Section 6.
2. Literature review
Throughout the literature, numerous approaches can be found in the domain of building retrofitting, which vary according to building typology and usage. The present work has examined various building retrofitting use cases and studies, which approach the renovation concept with different methodologies. (Katsaprakakis et al. Citation2020) investigates the potential renovation impact of active and passive measures in different building types (public building, residential building, museum, sports hall) located in the Mediterranean. The examined aspects are heating, cooling demands, and energy performance before and after renovation actions. The calculated results are based on a dynamic system simulation tool (TRNSYS). (Pannier et al. Citation2021) developed an automated framework that calculates the renovation impact of envelope and heating systems for residential buildings with respect to financial constraints through Multi-Objective Optimization (MOO). Renovation impact is calculated with a dynamic system simulation tool (TRNSYS and EnergyPlus) and the optimal renovation plan is generated with a genetic (NSGA – II) algorithm for a five-year renovation period. (Serrano-Jiménez et al. Citation2021) studied the depth and the financial feasibility of renovations by defining three renovation depths: short, medium and long-term. A weighted analysis based on various factors (technical, financial, social), results in a total impact and benefit percentage score, which evaluates the performance of the renovation depth. (Janssens and Verbruggen Citation2014) investigated the technical feasibility and economic aspects of renovation for a 30-year renovation period for residential buildings. The study examines the step-by-step renovation through three energy performance levels (E80, Low energy, Passive House) and suggests that energy performance investments should be made from the as-designed phase of the building. Nevertheless, it is underlined that building retrofit is a complex procedure due to the numerous conflicting combinations of renovation measures. (Brahmi et al. Citation2022; Costa-Carrapiço, Raslan, and González Citation2020) declare that BIM facilitates different stakeholders (architects, engineers, owners) to form a unified decision-making environment for valid and budget-conscious renovation project delivery. (Liao, Ren, and Li Citation2023) suggests that BIM must be integrated with renovation design due to envelope coefficients modelling on assessment’s energy consumption and carbon emission, resulting in an effective summary.
In addition to various renovation use cases, researchers have focused on the identification of the Key Performance Indicators (KPI) to evaluate the renovation impact. (Kamari, Corrao, and Kirkegaard Citation2017) suggest that a multi-dimension approach to renovation demands a variety of characterisation sectors and indicators. The main sectors consist of functionality (technical and environmental indicators), feasibility (financial metrics) and accountability (societal factors). (Katsaprakakis et al. Citation2020) suggest that active and passive renovation measures can be evaluated using KPIs such as primary energy, carbon emissions saving, payback period and RES penetration.
According to the conducted research, the most popular examined categories can be summarised in an envelope and technical systems. The most common and highly recommended approach is the insulation of envelope elements and windows replacement (Janssens and Verbruggen Citation2014;Katsaprakakis et al. Citation2020;Pannier et al. Citation2021; Serrano-Jiménez et al. Citation2021). (Costa-Carrapiço, Raslan, and González Citation2020). The literature identifies the upgrade of the technical system for heating (gas boilers) and cooling (heat pump units), a combination of solar systems for DHW and heating and PV electricity production. However, it is preferred to start with envelope insulation to minimise the dimensioning of the heating system (Pannier et al. Citation2021). In addition, (Chan et al. Citation2021) declare a variety of renovation criteria for sustainable buildings, which refer to site remodelling, provision of insulation, energy-efficient Heating Ventilation and Air Conditioning (HVAC), indoor air quality enhancement and renewable energy adoption.
In the policy and regulatory domains throughout the EU, several approaches have been implemented based on each country’s unique characteristics. The common methodology approach is the insulation of the building envelope elements like roofs, floors, external walls and windows (ECSO Citation2021) as it is considered the most energy-efficient measure to reduce thermal losses and a building’s carbon footprint. Additionally, every country develops an approach based on local needs. In Germany, the need for a heating system upgrade is highlighted and its integration with a boiler for Domestic Hot Water (DHW). The Greek government published a technical guide for renovation recommendations that refer to heating, cooling, lighting, DHW and RES systems with indicative maximum costs (HMEE Citation2021). Lithuania’s national renovation programme provides guidelines for heating, DHW, ventilation and RES (photovoltaics for electricity production and Solar Thermal Systems for DHW) with indicative costs and the economic lifecycle of each renovation action (MERL Citation2012). Regarding the Netherlands’ housing, a study suggests a classification of thermal energy renovation, which consists of the renovation type and quantity. Also, the transition from fossil gas to a sustainable heating alternative is strongly recommended (Netherlands Enterprise Agency Citation2020). Spain’s National Integrated Energy and Climate Plan (NCEP) mainly focuses on building envelope to reduce the demanded thermal load and to avoid the oversizing of the heating systems (Arriba Segurando Citation2021). The Swedish and French governments aim to achieve a long-term zero greenhouse gas emission goal by 2045 and 2050, respectively (Millot, Krook-Riekkola, and Maïzi Citation2020). To sum up, the discussed national retrofitting schemes lack a unified approach, methodology and common energy efficiency targets. Additionally, in many instances, the retrofitting recommendations are not directly associated with the national Energy Performance Certificate (EPC) schemes.
The literature review showcases that the existing research studies and national policies approach the renovation concept from a unilateral point of view. The authors of this paper recognised as a research gap need to integrate BIM with EPC and renovation in a unified framework. Up to now, building energy analysis has primarily relied on simulation tools (such as TRNSYS and Energy Plus) or national EPC calculation tools, which are challenging to use, time-consuming, and often yield results with discrepancies. Another identified gap is that the renovation strategies are not applied holistically from passive to active building characteristics for most of the studies. Moreover, research studies do not attempt to provide an estimation of the sizing of technical systems by considering both power requirements and occupied space. From KPI’s view, there is a lack of a complete KPI list that depicts the potential energy class, average thermal transmittance value, combined with energy, financial and carbon emissions indicators.
The novelty of this work is the automated generation of renovation scenarios without requiring energy audits or energy modelling software for energy calculations. The developed framework integrates BIM, EPC and renovation concepts into a unified environment, which is applicable to different building types in different countries across Europe.
Methodology
The development of the proposed schema required specific methodology steps to avoid complex implementations and redundant calculation procedures. The authors proceed with the described steps:
Study existing renovation practices, to identify optimal renovation strategies and establish a specific sequence of renovations.
Search for minimum national values from legislation documents, technical guides, or research work.
Mapping the information flow of the proposed schema.
Integrate the BIM Parser, Asset Rating Module and Roadmapping Tool into a common data environment.
Validation of results and fine-tuning.
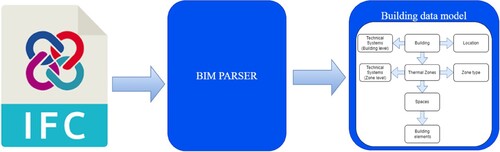
The proposed methodology can be implemented during both the as-designed and Operation and Maintenance (O&M) phases of the building with the exploitation of asset-based data. The methodology is applicable to residential building types (Apartments, single houses) and tertiary buildings (offices, construction halls) while considering local climatic and building indoor and outdoor characteristics for each country. provides a general overview of the proposed configuration.
Figure 1. Proposed automated renovation workflow.
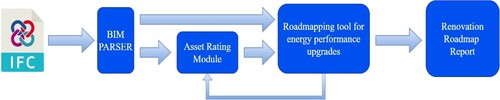
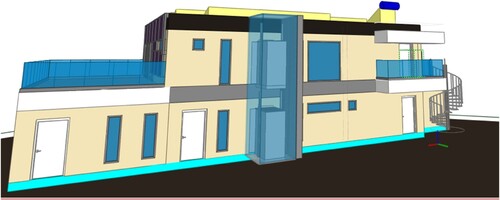
The workflow consists of three fundamental components that interact to produce the final output of the proposed schema. The schema requires a BIM file as its initial input to start operation. A BIM file is typically generated by various building professionals during the design phase. Professionals contribute depending on their specialty. For instance, architects organise spatial arrangements based on building design plans, while engineers provide insights into building materials (such as wall composition) and technical systems (including thermal power and efficiency). During the renovation process, the EPC assessor provides the BIM file to the building owner. The BIM file contains all mandatory building characteristics, including structural elements at the material level, technical or Renewable Energy Sources (RES) systems, thermal zones and corresponding spaces. The IFC format of the BIM file is preferred due to its seamless interoperability among various platforms and software solutions, used by different stakeholders such as Architects, Project Managers, and Energy Auditors. (Ansah et al. Citation2019; Gao and Pishdad-Bozorgi Citation2019). illustrates the BIM file of the testing data model within BIMvisionFootnote1 software, which serves as the test building for the implementation of the proposed framework. Further details about the building are presented in section 4.2.
Figure 2. BIM file of a residential house.
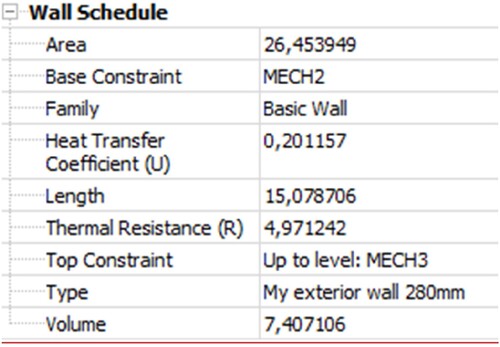
The BIMvision interface provides users with access to detailed information about the building. illustrates the BIM attributes of an external wall, in case a user clicks the corresponding element.
Figure 3. Building low- level information for external wall.
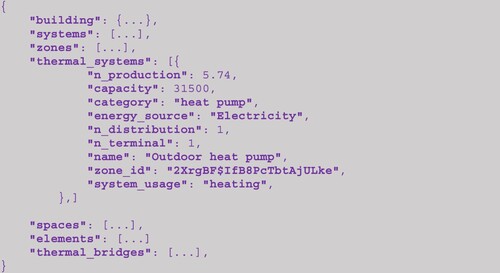
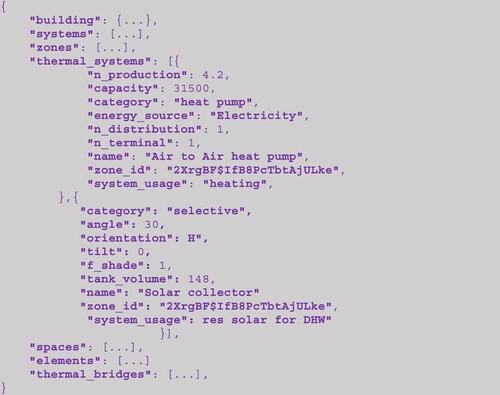
The BIM file is given as input to the BIM parser component, which then generates a coherent data model of the building. Following the data model’s generation, a validation procedure occurs based on the required fields of Asset Rating and the Roadmapping tool. The EPC assessor conducts the necessary corrections and additions to ensure the uninterrupted functionality of the individual components. For illustration purposes, the data model is in a JSON format, which organises the required building data for the operation of the AR module and Roadmapping tool. depicts the attributes of the heating system from the generated data model, showcasing a Coefficient Of Performance (COP) of 5.74 and a thermal output of 31500 W which effectively covers the demand of the specific thermal zone identified by its specific zone-id.
Figure 4. JSON format of the generated data model.
After successful validation, the generated data model provides an accurate building description, which is forwarded to the Asset Rating (AR) module for energy and EPC calculations. AR module is aligned with current EU regulation, ensuring feasible implementation across all MS by adhering to the ISO 52000 family of standards (Van Dijk and Hogeling Citation2019).
The Roadmapping tool requires three essential inputs for its operation. The first input refers to the minimum specifications utilised by the Asset Diagnosis Function of the Roadmapping tool. The second input is the generated data model from the BIM Parser component, illustrated in with a straight arrow from the BIM Parser. The Parser’s output is in JSON formatted model (). The initial data model serves as a baseline model, which is then modified from Roadmapping functionality to produce new models through copies of the initial model. Modified models include renovation values in specific fields (e.g. u-values for insulation upgrade in elements fields for roofs).
The Roadmapping tool generates different models, resulting in a recursive interaction with the AR Module, which is depicted with the circular relationship in . Roadmapping sends a data model to the AR Module and retrieves calculated energy performance KPIs to form the final renovation results for the specific intervention.
The Roadmapping tool examines different renovation categories (envelope, technical systems and RES). For example, during the first iteration, the AR Module retrieves the baseline data model to calculate current state KPIs. The current state KPIs will be utilised by the Roadmapping to identify the present state of the building and formulate saving measures after generating each renovation scenario. If Roadmapping identifies a heating upgrade from the Asset Diagnosis Function, then the initial data model is modified accordingly and provided to the AR Module for KPI calculation. This procedure is repeated until all renovation categories (envelope, technical system and RES) are examined to draft the final report, which represents an informative step-wise renovation roadmap.
However, the EPC assessor’s intervention may be neccesary for evaluating the final report or correcting the fields of the BIM file. The following subsections present more analytically the functionality of the proposed schema’s main components.
3.1. BIM parser
The energy assessor inserts the BIM file into the BIM parser component. BIM Parser implements a stepwise procedure to translate the desirable characteristics of the building from BIM into a comprehensible data model. Towards the development of BIM Parser, the Python library IfcOpenShell was utilised, specifically designed to handle Industry Foundation Class (IFC) files. The developed tool is designed to operate with the IFC 4 schema. Initially, the BIM Parser checks for the presence of zone elements (IfcZone elements) in the input IFC file, as the determination of zone boundaries relies on their existence. Subsequently, it recursively searches for the space entities (IfcSpace), belonging to each zone, extracting relevant information regarding the space elements (such as IfcWall, IfcDoor, IfcWindow, IfcRoof, IfcSlab) as well as metering and sensory devices (IfcFlowMeter and IfcSensor).
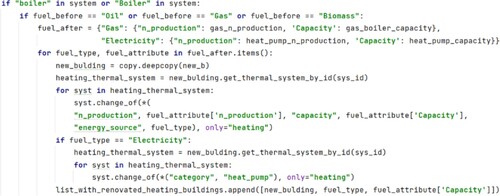
Regarding space elements, the surface area is extracted, which is adjacent to the specific space, and other useful properties. Properties include elements’ orientation, u-value, absorption, tilt, category (opaque or transparent), and contact elements (external air, ground, and other structural elements). In addition, the BIM Parser identifies terminal devices in each space (IfcSpaceHeater and IfcUnitaryEquipment). For distribution and terminal units, retrieved information includes their efficiency factor. For each terminal unit within a system (IfcSystem entity), the BIM Parser iterates through the elements for the specific system, to uniquely identify the power sources (for example IfcBoiler). Systems contribute to heating, cooling, and domestic hot water within a zone. The contribution of the power source can be identified through its distribution ports (IfcDistributionPort) and system-type properties. , briefly showcases the algorithm’s identification of IfcWall entities within a given zone. presents the overall high-level view of the BIM parser workflow.
Figure 5. Sample code for extracting context from walls.
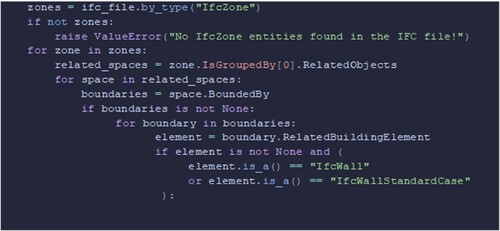
Figure 6. BIM Parser workflow.
In the case of lighting systems, the total lighting power is considered. Total lighting power consists of the aggregation of individual lighting elements in a specific zone. Thermal zones are divided into individual spaces. From the BIM parser’s description, it is implied that the AR module and Roadmapping tool have a very precise data model of the building. It is worth mentioning that BIM parser output is validated through an integrated validation procedure of the proposed schema. The validation procedure examines if the generated data model contains all the required fields for the AR module’s and Roadmapping tool’s operation. In case of non-compliance validation procedure requests from the schema’s end user to fill the corresponding fields with the appropriate values. For example, the Roadmapping requires the u-values of the structural element to proceed to scenario generation.
3.2. Asset rating module
The Asset Rating (AR) module serves as the central calculation engine within the proposed framework. The scope of such an engine is to provide the energy class of the building, a KPI that reflects the energy efficiency of a building's construction. The initial aim of this tool as developed in the D^2EPC project is to be able to develop a scheme that can perform the EPC assessment of any building throughout the EU. To this end, the ISO 52000 series of standards (Van Dijk and Hogeling Citation2019) has been adopted as the most updated standard that can be applied across EU MS. Furthermore, the tool's deployment has integrated various national-level EPC tool features (such as predefined occupancy-operation profiles and thermal zone boundary conditions). This hybrid approach has proven to be an effective research strategy for the development of an EU-wide certification tool.
Having translated the BIM file the BIM parser forwards the building information to the AR module, which takes into consideration both the elements of the building envelope as well as the deployed technical systems to calculate the theoretical energy performance. Starting with the calculation of the energy demand, the module calculates the required energy to cover the demand for the energy services of heating, cooling, ventilation, DHW and lighting. According to the characteristics of the technical systems the module calculates the final energy consumption or the generation from any RES technical systems installed on the building. In the following, the module can calculate the consumption of primary energy and a set of financial and environmental KPIs. The EPC class is generated after performing a parallel calculation of the energy performance of the reference building, a building instance with the same geometric characteristics but defined by a set of standard values representing the energy efficiency of its envelope and technical systems. The comparison of the energy performance of the examined and the reference building will result in the final energy class.
The focus of the AR module’s operation in the presented article doesn’t centre on the generation of the final EPC rating, rather than the calculation of the final energy consumption and the corresponding financial performance and environmental footprint. As described in the following section the Roadmapping tool will utilise the calculation capabilities of the AR tool to estimate the effects that a retrofitting action might have on these three critical aspects. In this way, the Roadmapping tool will be able to systematically explore the benefits or the economic viability of each possible retrofitting path and generate the result of the most efficient renovation strategy that is bespoke to the building's construction.
3.3. Roadmapping tool for performance upgrade
After retrieval of building documentation from the BIM parser and calculated KPIs from the AR module, the Roadmapping tool proceeds to identify the building’s current asset and energy characteristics. It is important to emphasise that the tool utilises asset-based data to generate the final report. The Roadmapping tool evaluates various renovation categories to provide a comprehensive renovation report to the building owner, aiding in optimal strategy making.
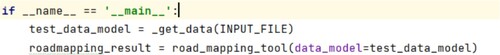
The development of the Roadmapping tool is based on Python programming language with the utilisation of Pandas and Numpy libraries, and it can be operated as a Python package that can be installed in different applications or as a stand-alone tool. The Roadmapping accepts the output of the BIM Parser in a JSON format () to proceed with the examination of different renovation categories. presents the main function that calls the Roadmapping tool.
Figure 7. Main function for triggering Roadmapping tool.
Renovation categories consist of envelope, technical systems and RES. Each renovation category targets a different aspect of the building’s energy performance. For the envelope category, all envelope elements in contact with the external air and ground are considered. Technical systems are the systems used for building energy services. RES is a building system that utilises solar resources for energy delivery. presents the analytical table of renovation categories and elements.
Table 1. Examined elements and attributes per renovation category.
The operation of the Roadmapping tool requires specific national minimum specifications for the relevant EU country or user-defined specifications. For each renovation category, the functionality of the Roadmapping tool relies on three key components: an Asset diagnosis function, a Renovation function, and an AR module for energy calculations. The functionality of the AR module was analysed in sub-section 3.2. The following sub-section analytically describes the required minimum specifications for the Roadmapping tool, the Asset diagnosis and the Evaluation function.
3.3.1. Roadmapping tool input
The Roadmapping tool begins by acknowledging the minimum specifications. Any deviation of the examined building characteristics from the defined specification triggers the generation of the retrofit scenarios, as analyzed in Section 3.3.3 Renovation Function. It is worth mentioning that these specifications could be derived from national standards or defined by the EPC assessor in alignment with the building owner’s energy targets. In this context, the specifications were retrieved from the national standards of Greece and adjusted with the corresponding use case and research work. The national guidelines address envelope and technical systems specifications. For the envelope, according to (GG Citation2017) the specification refers to minimum U-values per climatic zone. presents the minimum U-values of Greek climatic zone C, which is the climatic zone of the examined use case.
Table 2. Minimum U-values.
For heating services, the national legislation defines minimum efficiency values for various types of boilers or heat pumps (TCG Citation2021). illustrates the minimum efficiency requirements per heating system.
Table 3. Minimum efficiency requirements.
Regarding the cooling system, defined that the minimum efficiency SEER value must be at least 3.0 for air-to-air heat pumps (TCG Citation2021). For DHW, two thresholds are examined. The first threshold concerns the minimum solar share provided by the Solar Thermal Collector system, which is equal to 60%, (GG Citation2017), indicating that 60% of the DHW demand should be covered by solar sources. The second criterion for the DHW is the replacement of the conventional electrical boiler with highly efficient systems. For lighting systems, the minimum lux requirements per zone space are taken from (TCG Citation2021). However, lighting interventions are only applicable to tertiary buildings, therefore no lighting renovations were implemented in the residential pilot site discussed in this paper. To provide optional RES suggestions for photovoltaic installation two parameters were taken from published research reports. Firstly, the minimum RES share, which represents the load coverage ratio from photovoltaics (BPIE Citation2021), is set to 25%. Secondly, the maximum energy consumption per area (European Commission Citation2019), is set at 80 kWh/m2 for residential and 85 kWh/m2 for tertiary buildings. It is worth mentioning that the minimum requirements can be expanded for every European country, resulting in a universally applied solution across EU member states.
3.3.2. Asset diagnosis function
Asset Diagnosis (AD) function dictates the necessity of a renovation action based on a comparison between the building’s values and specified criteria. These criteria are customised according to the energy target of the building owner or national standards. If the building values violate these criteria, the Renovation Function is triggered. The examined values differ for each renovation category.
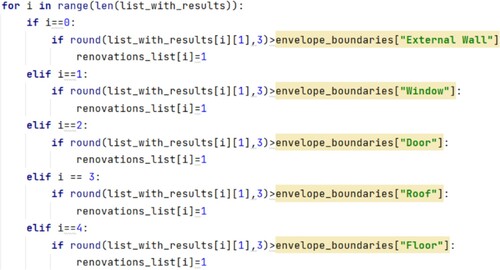
The data model provides a structural element resolution, enabling the calculation of average thermal transmittance values (U-values) for conditioned spaces within the building envelope. U-values of non-conditioned spaces are excluded from the calculation. In the instance that the calculated average U-value is bigger than the specified U-values, this is translated as inadequate insulation for the building owner. presents a code sample from the AD Function which compares the average U-values with the national standards. If the comparison indicates a need for renovation, it assigns a value of 1 to signify the necessity of renovation.
Figure 8. Diagnosis of envelope elements.
For heating, cooling and DHW technical systems, the AD function evaluates the efficiency of the production unit. In more detail, AD identifies a variety of production units like fossil fuels boilers (oil, gas, biomass), heat pumps, district heating and air conditioning systems. If the production unit exceeds the specified value, then no renovation scenario is generated. Especially for heating, cooling and DHW systems, Asset Diagnosis checks if there is any energy demand for the corresponding service, which is calculated from the AR module. If there is no demand for the specific service then the AD function continues with the next renovation type or category. Regarding the lighting system, AD collects the general building’s category (tertiary, residential) from the data model. AD examines the lighting systems only for tertiary buildings. In lighting systems, AD validates illuminance requirements based on the owner’s visual comfort specifications (TCG Citation2021).
The functionality of AD is completed with RES. AD examines systems for DHW and on-site production needs. RES for DHW is considered a mandatory renovation measure in contrast with on-site production, which is considered optional. It is widely accepted that on-site production needs refer to building owners who focus on very low consumption goals like nZEB or Passive House standards. For DHW needs, AD examines the presence of an STC system and the need for DHW demand. Similarly to technical systems, the DHW demand metric is used to check the renovation necessity. If an STC system is absent and DHW demand is a non-zero value, triggering an STC scenario is initiated within the Renovation Function. Alternatively, if an STC system exists, AD calculates the solar share percentage, which is compared with a standard value. The solar share percentage is given by Eq.1.
(1)
(1) For on-site production, diagnosis is conducted through a RES share parameter. The parameter is used to decide if the building owner should install photovoltaic panels in the property based on predefined preferences. If the RES share does not conform to the parameter’s values then the Renovation Function is triggered. Eq.2 describes the res-share parameter.
(2)
(2)
3.3.3. Renovation function
When the pre-defined preferences of the building owner are not fulfilled, the Renovation Function (RF) is triggered. The RF function develops energy performance suggestions oriented toward increasing the building’s energy performance and the owner’s standard of living. The main purpose of the Renovation Function is to generate retrofitting scenarios with the utilisation of the existing data model. More particularly, the retrofitting scenario consists of a new data model, which is similar to the produced data model from the BIM parser. The main distinction between the initialised and generated data model is the specific modified values based on the examined category. In that sense, the new data model can be inserted into the AR module to assess the financial and environmental impact of the renovation suggestion. After the interaction with the AR module, the Renovation Function proposes pricing depending on the recommended measure. It is worth mentioning that the EPC assessor should re-evaluate the renovation costing to provide a realistic view to the building owner. It is underlined that renovation costing is derived from the National Green Deal programme (HMEE Citation2021) and includes a package of costs. The package covers the purchase of the equipment, consulting and labour services and different costs for the issuance of permits and legal documents, resulting in a good pricing approximation.
For the envelope category, the Renovation Function receives input from the Asset Diagnosis function, declaring which envelope element has violated the constraint of the average U-value. The Renovation Function searches the data model and proposes an insulation improvement or window replacement. The renovation action is applied in the new data model by modifying the thermal transmittance value from each envelope element according to the owner’s specifications. The envelope’s renovation cost is expressed in . The overall envelope cost is calculated from the total area per structural element covered with insulation.
The technical system category includes different approaches for the various energy services. For heating, the new data model provides a new more efficient system with the same or more eco-friendly fuel. For example, it is assumed that the building is heated with an oil boiler with an efficiency of 0.75. The Renovation Function will deploy three basic scenarios. The first scenario is an electrical heat pump with a COP of 4.2, the second scenario is a condensing gas boiler with an efficiency of 104% and the third scenario is a biomass boiler with an efficiency of 92%. The variety of heating system scenarios provides a wide range of solutions to the building owner with different market costs and environmental impacts. The heating system’s dimensioning was calculated from an equation taken from (TCG Citation2021) and is based on different building attributes. More specifically attributes refer to the building’s average U-value, minimum and maximum temperature of the corresponding climatic zone, fresh air requirements of the conditioned thermal zones and total area of envelope elements. The final pricing of the heating system is extracted from total heating thermal power. , briefly showcases the algorithm’s operation during the suggestion for a heating system upgrade.
Figure 9. Sample code for the upgrade of the heating system.
For cooling service, the RF recommends highly efficient air conditioning systems. From the Asset Diagnosis function, RF receives information about the cooling system that needs replacement. The cooling system’s dimensioning was calculated from an equation taken from (TCG Citation2021). The dimensioning of the cooling system is carried out with envelope characteristics (orientation, average U-values, opaque element area), fresh air requirements of every conditioned thermal zone, temperature measurements of the corresponding climatic zone and typical values of the thermal zone (internal heat gains from equipment, people and solar). Pricing for cooling systems is formed based on the cooling thermal capacity.
The suggestions for the DHW service are the same as the heating service and are examined after the RES category of STC systems due to efficiency reasons. The cost of the DHW production unit is related to the output thermal capacity.
For lighting systems. RF recommends a new data model with more efficient LED light bulbs and great bright performance only for non-residential buildings. Then RF calculates the total lighting energy of the proposed scenario by inserting the preliminary modified data model into the AR module. The calculated total lighting energy is compared with the present lighting energy. Depending on the comparison of the two energies, the renovation scenario is generated or neglected. Lighting renovation expenses derive from the total number of lamps that satisfy demanded visual comfort.
For the case of RES, there are two possible scenarios for STC and photovoltaic systems. For STC systems, RF interacts with the AR module to calculate the solar share percentage until the solar share threshold is satisfied. The RF considers a variety of solar collector parameters. Parameters refer to orientation, installation tilt, tank volume, collector’s area and category (flat-plate, evacuated tube). It is underlined that RF for DHW needs to first assess the STC systems solution, which is more efficient than the installation of a DHW production unit. Tank volume capacity specifies the cost of the STC system. For photovoltaic systems, RF analyzes the area, orientation, tilt, and nominal power of the proposed photovoltaic system. For PV scenarios, the Renovation Function interacts with the AR module until the building has reached the desired share percentage or energy consumption target. The photovoltaic system’s cost estimation refers to nominal power output.
The Renovation Function fulfils its role after all renovation categories are examined and the generated building data models are inserted into the Asset Rating module to quantify the renovation impact in financial and environmental terms.
For an optimal understanding of the operation of the Asset Diagnosis and Renovation Function, an example is presented. The example will combine different renovation scenarios that deviate from minimum specifications for specific categories and subsequently generate new scenarios. Assuming that our building requires some roof renovation along with an upgrade of the heating system, and an installation of a STC system for DHW. and illustrate the initial data-model attributes.
Figure 10. Thermal systems of the initial data model.
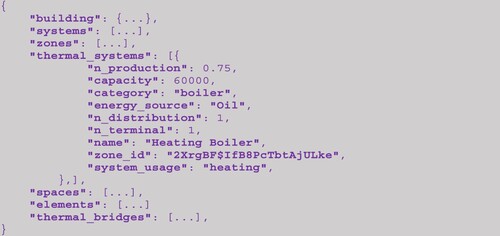
Figure 11. Roof element of the initial data model.
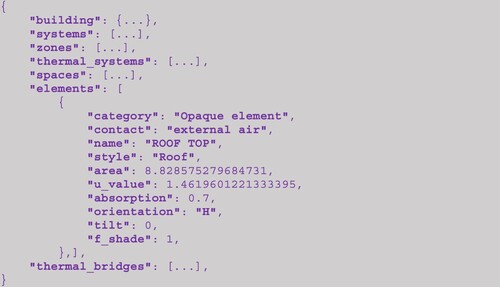
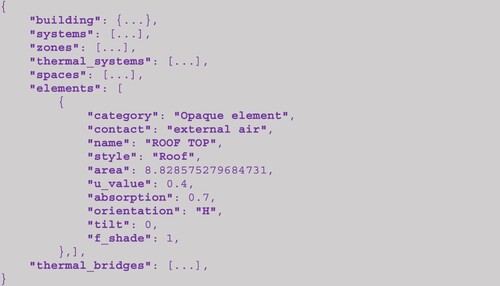
The Roadmapping tool first examines the passive elements of the building, calculating the average u-value, which is determined to be 1.26 W/m2*K. This value is compared with the national standard value for roofs which is 0.4 W/m2*K. As the minimum requirement is violated, a new data model with a new u-value is generated from the Renovation Function. represents the new data model.
Figure 12. Roof element of T renovated data model.
Following the envelope examination, the same rationale is applied to the heating and STC systems, resulting in the replacement of the existing oil boiler with an efficient heat pump, dimensioned based on thermal zone needs. It is worth noting that the Renovation Function will generate three different data models for heating, as mentioned in Section 3.3.3. For simplification, only the heat pump scenario is selected. Also, the Renovation Function inserts an STC system as depicted in .
Figure 13. Thermal system of the renovated data model.
Finally, the renovated data model contains all the described renovations and is inserted into the AR module for energy calculations. The output of the AR module is then processed by the Roadmapping tool to form the final renovation reports.
4. Results
4.1. Roadmapping tool calculated indicators
The generated data models from the Renovation Function (RF) are inserted into the Asset Rating module to quantify the renovation impact. The results of AR are integrated with indicative renovation pricing (HMEE Citation2021) and sent back to the Roadmapping tool to calculate the renovation indicators. These indicators are crucial for assessing the impact of renovations from energy, environmental, and financial aspects. presents the renovation indicators and their corresponding measurement units.
Table 4. Renovation indicators.
Subsequently, the component generates a sorted table of the renovation actions based on the impact of each intervention and user preferences, including payback year. The end user possesses the capability to merge different individual scenarios from the table to create a comprehensive renovation timeline, adaptable to specific objectives. All selected scenarios are integrated into a cohesive data model. The data model is subsequently reinserted into the AR module to calculate the impact of the entire renovation plan. In addition, merged scenarios are enriched with per-energy service measurements per renovation action. The concept of per-energy service measurement enables the end-user to quantitatively assess the renovation impact concerning energy service (heating, cooling, DHW, res-solar) and focus on particular renovation actions that will enhance the quality of life according to desired preferences. For instance, concerning the DHW service, the Roadmapping tool suggests an STC system or an upgrade to the DHW production unit. Finally, the Renovation Roadmap Report is generated to provide an informative stepwise plan for increasing the asset energy performance.
The format of the Renovation Roadmap Report (RRR) depends on the type of application that will be integrated. For Web–applications, the Renovation Roadmap Report is recommended to be organised in a JavaScript Object Notation Format (JSON) for interoperability among different platforms. Additionally, if the framework is operating as a stand-alone application, then an EXCEL file is recommended.
4.2. Test case specification
A testing data model was developed to validate the proposed framework. The testing data model was created from a BIM file of a real 317.7 m2 building which is located in Thessaloniki, Greece, within climatic zone C. This building is owned by CERTH. CERTH’s nearly Zero Energy Building (nZEB) Smart House is a two-floor apartment, representative of a single-family residential building, and is already equipped with numerous state-of-art technologies for building envelope, technical, and RES systems. The Smarthome is a mixed-use building, incorporating various thermal zones such as offices and residential areas. Specifically, while some rooms are officially offices (Control Rooms) the building also includes common residential rooms like living rooms and bedrooms, equipped with IoT devices. depicts CERTH’s nZEB Smart House.
Figure 14. nZEB Smart House.
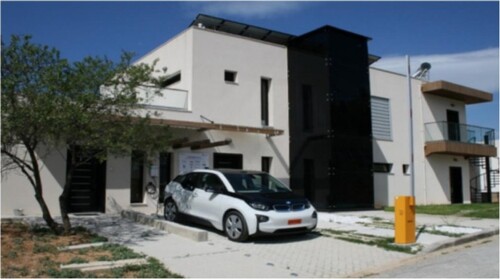
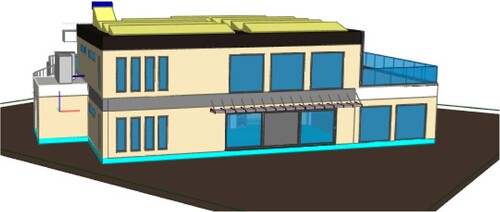
Subsequently, the testing data model represents a residential building that is equipped with a well-insulated envelope, shading systems, efficient heat pumps for heating and cooling, an electrical boiler, an STC system for DHW, and an installed photovoltaic system. More specifically the testing data model is located in Thessaloniki, Greece, and belongs to climatic zone C. The average u-value expressed in W/m2*K for envelope elements is 0.2 (External wall), 1.45 (Windows), 2.32 (Doors), 0.31 (Floor) and 0.26(Roof). The building is equipped with two air-to-air heat pumps with COP 5.74 and 5.5, SEER 5.2 and 5.11. For DHW demand an electrical boiler is utilised with efficiency 1. In addition, a solar thermal collector for DHW is installed with an area of 4.73 m2 and a tank volume of 148 liters without being shaded by nearby elements. The photovoltaic system’s installed capacity is 9.57 kWp, equipped with 58 panels mounted on the roof with a fixed South-West orientation to maximise the production of electricity. It is worth mentioning that this test case is highly efficient apart from the electrical boiler for DHW. All renovation categories satisfy the examined national specification presented in section 3.1.1, except for the electrical boiler. For this specific case, the Roadmapping will provide energy recommendations only for the replacement of the electrical boiler with a boiler that provides DHW from heat pumps. presents the depiction of the examined test case in BIMvision software.
Figure 15. Examined Test case depiction in BIMvision.
4.3. Visualisation
The visualisation of the Renovation Roadmap Report is one of the most essential parts of the proposed scheme. Visualisation must be comprehensible by the building owners to promote the renovation process. The visualisation part is formed based on the final report’s results. The proposed framework was implemented within a user interface as a web application, facilitating the extraction of results in the form of a JSON file. illustrates the structure of the output JSON files.
Figure 16. JSON output of the Roadmapping Tool.
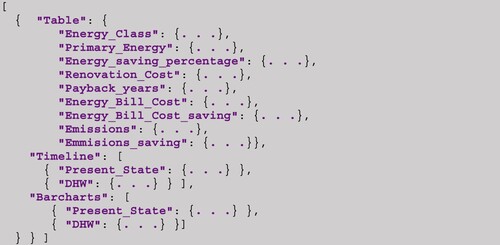
The visualisation comprises Table, Timeline and Barchart sections. Each section presents distinct information to the building owner, offering a comprehensive perspective on the impact of each renovation suggestion. provides an overview of the visualisation.
Figure 17. General overview of Renovation Roadmap Report.
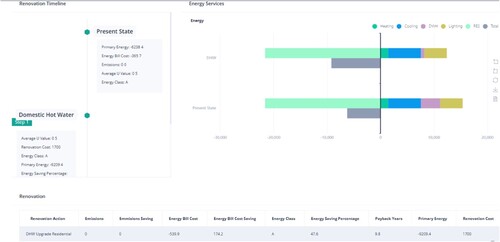
Starting from the bottom and moving upwards in , the Table section offers a concise overview of suggested renovation actions with meaningful indicators, which are described in . The primary function of this section is to examine refurbishment suggestions on an individual level. More specifically, it is assumed that the building’s data model is modified only with the specific recommended action without additional renovation, and then calls recursively the AR module for energy calculations. By calling the AR module the results present the potential upgrade in energy class after the renovation action, which links the renovation with the EPC concept. In this case, the Table results are sorted by payback years. All saving indicators derive from comparing the renovated data model with the current state data model. depicts the Table section.
Table 5. Depicted Table in the Visualisation section.
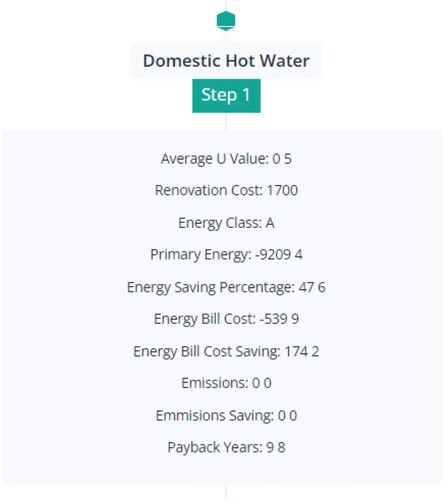
The Timeline section provides a renovation roadmap aimed at achieving the desired energy performance for the building owner. In contrast with the Table section, the Timeline section incorporates combined retrofit actions following the Roadmapping tool rationale, as explained in the example in Section 3.3.3. The timeline applies renovation steps starting from the envelope, progressing with technical systems and concluding with the RES systems. The generated data model contains all the proposed values from the previously renovated data models, formatting a step-wise renovation roadmap. Additionally, the timeline output expresses the renovation impact of combined scenarios by introducing two additional essential indicators. Indicators include the average U-values of envelope elements, which quantify the impact of envelope renovation, and the total electrical panel area of the proposed photovoltaic (PV) system, which is mandatory for the system’s spatial positioning. It is worth mentioning that the Timeline section is enriched with the building’s current state metrics. and depict the Timeline steps.
Figure 18. Building's current state.
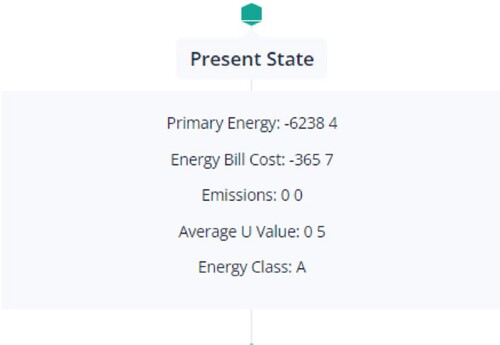
Figure 19. DHW renovation in a Timeline graph.
Subsequently, the Barchart section aims to inform the building’s owner about the influence of energy services. Similar to the Timeline graph, the Barchart illustrates the refurbishment impact for a combination of scenarios. shows the Barchart section.
Figure 20. Barchart section.
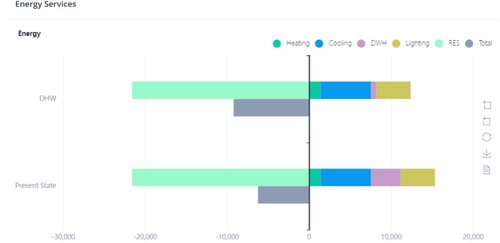
From the depicted results users can identify the potential reduction in delivered energy for DHW, represented by the purple bar in . The y-axis denotes different building cases such as building present state without renovation and building with DHW upgrades. The x-axis expresses the delivered energy for various services, with different colours assigned (green for heating, blue for cooling and purple for DHW). Moreover, a vertical black line is observed, indicating zero energy consumption. On the right side of the black line, energy consumption per service is depicted, while the left side presents the production from photovoltaic systems. It is noteworthy that our case study is a high-performance building in which PV production completely covers the energy services demands. Thus, this explains the negative values in primary energy and energy bill costs, as well as zero emissions, as depicted in and . Overall, the Roadmapping tool generates a scenario that replaces the electrical boiler with a more efficient heat pump system, which is clearly identified in the DHW chart of .
5. Discussion
This study introduces an automated methodology leveraging BIM technology to establish a linkage between renovation actions and the EPC concept. This section discusses the role of the EPC assessor in the automated framework and explores potential challenges to the framework’s development.
It should be noted that the proposed framework does not aim to replace the role of the EPC assessor but rather to facilitate their services, improve their current practices and provide holistic and understandable feedback to the building owner. This approach leads to an accelerated and unambiguous renovation process. Consequently, the role of the EPC assessor remains critical throughout the renovation procedure, as they are responsible for evaluating and rectifying the outcomes of the proposed schema. For example, correct some BIM file fields, identify some pricing deviations for the Roadmapping tool, or examine the feasibility of the proposed renovation action. After that, the EPC assessor needs to interact with the building owner to form the final renovation plan.
Despite the numerous advantages, the proposed framework is subjected to various simplifications and technical limitations for the developed 3 components.
The BIM file must be precisely defined by various stakeholders to include specific fields that are going to be distinguished by the BIM Parser. If certain fields are missing, the energy assessor should fill them during an on-site inspection, resulting in an overall increase in processing time. For instance, if space boundaries are not clearly defined in the BIM file, the BIM Parser cannot identify the corresponding spaces. Moreover, the BIM Parser needs to be expanded to identify more complex relationships, such as Combined Heating and Power (CHP) units, district heating systems, or attributes of hydrogen boilers.
The Asset Rating module conducts the building's energy evaluation, a process that can diverge based on the intended application. The initial design of the approach was specifically tailored for application within the domain of Energy Performance Certificates (EPCs) in Europe. Therefore, the design of the Asset Rating engine has been based on the ISO 52000 series of standards. Looking ahead, the system's evolution towards an automated platform capable of processing BIM files to suggest retrofitting strategies should aim to accommodate a broader spectrum of standards for analyzing the energy behaviour of a building structure. Additionally, it should enhance compatibility with the various energy simulation engines that prevail in the current market. Although such advancements promise more customised outcomes for each application, they necessitate increased involvement from energy engineers, thereby potentially reducing the extent of automation in the outlined process.
The Roadmapping tool does not provide low-level information such as the type (e.g. rockwool) and the thickness of the insulation material for envelope renovations. Additionally, Roadmapping does not examine the feasibility of the renovation action in spatial terms. For example, Roadmapping will recommend a heating system or photovoltaic installation that does not fit in the corresponding area of the building. Furthermore, the indicative pricing list of Roadmapping is not entirely reliable due to the price fluctuation of the free market and inflation. This pricing list of the Roadmapping tool derives from national green-deal programmes and market trends from older years, and it should be regularly updated by an experienced energy auditor.
An additional critical issue is the maintenance cost of the proposed digital solution. The proposed framework requires energy assessors to evaluate the results of the renovation roadmap and update the corresponding pricing and national specifications values. Specialized Information Technologies (IT) support is considered mandatory to configure and monitor the proposed digital framework to ensure continuous operation. As the maintenance requirements increase, the associated costs also grow for the building owner in relation to the existing practices. These increased costs may cause discomfort and scepticism among users, potentially leading to reluctance in adopting the proposed solution.
6. Conclusion
In conclusion, the role of the EPC has the potential to be considered as an informational tool that improves the living standards of European citizens’ and enables additional benefits. The main innovation of the presented work is the linkage between BIM files, EPC and renovation concepts in an automated manner. The BIM file is converted into a data model which is processed by the Asset Rating Module and Roadmapping tool to calculate meaningful KPIs to enhance the building’s owners’ awareness of potential renovation benefits. The proposed schema’s energy calculations are based on a commonly accepted European standard (ISO 52000), offering a generalised solution applicable to all European countries. Despite the potential assistance the framework offers to end-users and the various technical parties involved, there is still much progress to be made at the research level to provide a fully autonomous and comprehensible renovation framework. The proposed framework should be capable of translating the renovation impact into social (health and well-being, urban revitalisation) and financial (employment rate, property value, rent value, maintenance cost) terms. Moreover, it can be linked with IoT consumption data to distinguish occupants’ energy patterns before and after renovation action, resulting in the identification of optimal renovation strategies. Additionally, the proposed framework should be able to consider the sustainability of each suggestion (e.g. embodied carbon for envelope insulation materials) and combine the renovation concept with the Smart Readiness Indicator (SRI). Extra testing for different building types in diverse climates and countries is necessary for fine-tuning. It is worth noting that cooperation with various building professionals is crucial for establishing a pricing range for every renovation action to avoid burdens.
The framework’s results derive from asset-based data that are collected from a BIM file to form a renovation roadmap for buildings throughout the design and the operational and maintenance phases. A variety of insightful and comprehensive renovation indicators approach the building from both the investment and energy efficiency view. The results can depict the renovation impact of individual or combined scenarios depending on the building owner’s targets.
Overall, these findings represent a significant contribution to the field of sustainable building design and can support future energy-related policy and decision-making.
Acknowledgment
This work is part of the SmartLivingEPC project that has received funding from the European Union’s Horizon 2020 research and innovation programme under grant agreement No. 101069639.
Disclosure statement
No potential conflict of interest was reported by the author(s).
Notes
1 https://bimvision.eu/
References
- Ansah, Mark Kyeredey, Xi Chen, Hongxing Yang, Lin Lu, and Patrick T. I. Lam. 2019. “A Review and Outlook for Integrated BIM Application in Green Building Assessment.” Sustainable Cities and Society 48: 101576. ISSN 2210-6707. https://doi.org/10.1016/j.scs.2019.101576.
- BPIE (Buildings Performance Institute Europe). 2021. Policy Briefing Nearly Zero: A Review of EU Member State Implementation of New Build Requirements https://www.bpie.eu/publication/nearly-zero-a-review-of-eu-member-state-implementation-of-new-build-requirements/.
- Brahmi, Bani Feriel, Souad Sassi Boudemagh, Ilham Kitouni, and Aliakbar Kamari. 2022. “IPD and BIM-Focussed Methodology in Renovation of Heritage Buildings.” Construction Management and Economics 40 (3): 186–206. https://doi.org/10.1080/01446193.2021.1933557.
- Chan, Puthearath, Kheang Hang Ung, Sovanrany Meng, Khemony Khoeng, Hang Kheang Ung, Teksim Tang, Kimsong Eung, et al. 2021. Plan-Design, Construction, Performance, and Renovation Criteria for Sustainable Buildings: Data Review.
- Costa-Carrapiço, Inês, Rokia Raslan, and Javier Neila González. 2020. “A Systematic Review of Genetic Algorithm-Based Multi-Objective Optimisation for Building Retrofitting Strategies towards Energy Efficiency.” Energy and Buildings 210: 109690. ISSN 0378-7788. https://doi.org/10.1016/j.enbuild.2019.109690.
- Dorizas-Bpie, Vivian, Zsolt Toth -Bpie, Jonathan Volt -Bpie, Rutger Broer -Bpie, Victoria Taranu -Bpie, Mariangiola Fabbri -Bpie, Barney Jeffries, and Julia Lempik -Ifeu. 2023. BPIE-Buildings Performance Institute Europe Conceptualising IBRoad2EPC How Energy Performance Certificates (EPCs) Can Be Upgraded with Building Renovation Passport (BRP) Elements. https://www.bpie.eu/publication/conceptualising-ibroad2epc-can-epcs-be-upgraded-to-include-building-renovation-passport-elements/.
- EC. 2020. European Commission. ‘Communication From the Commission to the European Parliament, the Council, the European Economic and Social Committee and the Comitte of Regions’. Oct.14, 2020. https://eur-lex.europa.eu/legalcontent/EN/TXT/?uri = CELEX%3A52020DC0663.
- ECSO. 2021. European Construction Sector Observatory Renovating the Building Envelope-Quo Vadis?
- EU AND COEU. 2002. Directive 2002/91/EC of the European Parliament and of the Council of 16 December 2002 on the Energy Performance of Buildings.
- EUCO. 2021. Digitalisation in the Construction Sector Analytical Report European Construction Sector Observatory 1 European Construction Sector Observatory Digitalisation in the Construction Sector Analytical Report.
- European Commission. 2019. “Comprehensive Study of Building Energy Renovation Activities and the Uptake of Nearly Zero-Energy Buildings in the EU Final Report.”. https://doi.org/10.2833/14675. ISBN 978-92-76-14632-2.
- Gao, Xinghua, and Pardis Pishdad-Bozorgi. 2019. “BIM-Enabled Facilities Operation and Maintenance: A Review.” Advanced Engineering Informatics 39: 227–247. https://doi.org/10.1016/j.aei.2019.01.005
- GG, GREEK GOVERNMENT. 2017. ‘https://ypen.gov.gr/wp-content/uploads/2020/11/kenak_fek_b2367_2017.pdf [GR], [Accessed in 16/02/2024]’. Journal of the Government of the Greek Republic.
- HMME. 2021. Hellenic Minister of Environment and Energy. n.d. Impementation Guide of Program , https://exoikonomo2021.gov.gr/documents/10182/7642414/%CE%9F%CE%B4%CE%B7%CE%B3%CE%BF%CF%82+%CE%A0%CF%81%CE%BF%CE%B3%CF%81%CE%AC%CE%BC%CE%BC%CE%B1%CF%84%CE%BF%CF%82+2021+5%CE%B7+%CE%A4%CE%A1%CE%9F%CE%A0.pdf/d3036429-e328-4aa1-b646-edbcb1768d33, [GR], [Accessed 16/02/2024].
- Janssens, Bart, and Aviel Verbruggen. 2014. “Feasibility of Upgrading the Energy Performance of Recent Massive Brick Houses.” Frontiers of Architectural Research 3 (1): 44–54. https://doi.org/10.1016/j.foar.2013.11.004.
- Kamari, Aliakbar, Rossella Corrao, and Poul Henning Kirkegaard. 2017. “Sustainability Focused Decision-Making in Building Renovation.” International Journal of Sustainable Built Environment 6 (2): 330–350. https://doi.org/10.1016/j.ijsbe.2017.05.001.
- Katsaprakakis, Dimitris Al, Georgios Zidianakis, Yiannis Yiannakoudakis, Evaggelos Manioudakis, Irini Dakanali, and Spyros Kanouras. 2020. “‘Working on Buildings’ Energy Performance Upgrade in Mediterranean Climate’.” Energies 13 (9), https://doi.org/10.3390/en13092159.
- Liao, Haolan, Rong Ren, and Lu Li. 2023. “Existing Building Renovation: A Review of Barriers to Economic and Environmental Benefits.” International Journal of Environmental Research and Public Health 20. https://doi.org/10.3390/ijerph20054058.
- MERL. 2012. Ministry of the Environment of the Republic of Lithuania Report on the Results of the Calculations of, the Input Data for and Assumptions Relating to Cost-Optimal Levels of Minimum Energy Performance Requirements Under the Comparative Methodology Framework Established in Commission Delegated Regulation (EU) No 244/2012 of 16 January 2012.
- Millot, Ariane, Anna Krook-Riekkola, and Nadia Maïzi. 2020. “Guiding the Future Energy Transition to Net-Zero Emissions: Lessons from Exploring the Differences between France and Sweden.” Energy Policy 139, https://doi.org/10.1016/j.enpol.2020.111358.
- Netherlands Enterprise Agency. 2020. “Long-Term Renovation Strategy” En Route to a Low-CO2 Built Environment. https://energy.ec.europa.eu/system/files/2020-04/nl_2020_ltrs_en_0.pdf.
- Pannier, Marie-Lise, Thomas Recht, Maxime Robillart, Patrick Schalbart, Bruno Peuportier, and Laurent Mora. 2021. “Identifying Optimal Renovation Schedules for Building Portfolios: Application in a Social Housing Context under Multi-Year Funding Constraints Identifying Optimal Renovation Schedules for Building Portfolios: Application in a Social Hous-Ing Context under Multi-Year Funding Constraints Identifying Optimal Renovation Schedules for Building Portfolios: Application in a Social Housing Context under Multi-Year Funding Constraints.” Energy and Buildings 250: 111290. https://doi.org/10.1016/j.enbuild.2021.111290.
- Pillar de Arriba Sugurando. 2021. Policy Brief Energy Renovation of Buildings in Spain and the EU. Lessons Learned and Main Recommendations. Background: Retrofitting as a Key Element of the Energy Planning. https://www.odyssee-mure.eu/publications/policy-brief/spanish-building-retrofitting-energy-efficiency-odyssee-mure.pdf.
- Serrano-Jiménez, Antonio, Paula Femenías, Liane Thuvander, and Ángela Barrios-Padura. 2021. “A Multi-Criteria Decision Support Method towards Selecting Feasible and Sustainable Housing Renovation Strategies.” Journal of Cleaner Production 278, https://doi.org/10.1016/j.jclepro.2020.123588.
- Sesana, Marta Maria, and Graziano Salvalai. 2018. “A Review on Building Renovation Passport: Potentialities and Barriers on Current Initiatives.” Energy and Buildings 173: 195–205. https://doi.org/10.1016/j.enbuild.2018.05.027
- TCG. 2021. Technical Chamber of Greece. 2017. Detailed National Specifications of Parameters for the Calculation of the Energy Performance of Buildings and the Issuing of the Energy Performance Certificate, “https://www.kenak.gr/files/totee_20701-1_2017.pdf”.
- Van Dijk, D., and Jaap Hogeling. 2019. The New EN ISO 52000 Family of Standards to Assess the Energy Performance of Buildings Put in Practice. https://doi.org/10.1051/e3sconf/201911104047.