
Abstract
Objective: To investigate the relation of a hearing-specific patient-reported outcome measure (PROM) with speech perception and noise tolerance measurements. It was hypothesised that speech intelligibility in noise and noise tolerance may explain a larger part of the variance in PROM scores than speech intelligibility in quiet.
Design: This cross-sectional study used the Speech, Spatial, Qualities (SSQ) questionnaire as a PROM. Speech recognition in quiet, the Speech Reception Threshold in noise and noise tolerance as measured with the acceptable noise level (ANL) were measured with sentences.
Study sample: A group of 48 unilateral post-lingual deafened cochlear implant (CI) users.
Results: SSQ scores were moderately correlated with speech scores in quiet and noise, and also with ANLs. Speech scores in quiet and noise were strongly correlated. The combination of speech scores and ANL explained 10–30% of the variances in SSQ scores, with ANLs adding only 0–9%.
Conclusions: The variance in the SSQ as hearing-specific PROM in CI users was not better explained by speech intelligibility in noise than by speech intelligibility in quiet, because of the remarkably strong correlation between both measures. ANLs made only a small contribution to explain the variance of the SSQ. ANLs seem to measure other aspects than the SSQ.
Introduction
Cochlear implants (CIs) are currently an established treatment for adults with post-lingual bilateral severe to profound sensorineural hearing loss. Substantial evidence exists that CIs improve speech intelligibility and quality of life (QoL) in most CI users (Gaylor et al. Citation2013; McRackan et al. Citation2018a).
The improvement in speech intelligibility due to the CI is usually measured with standardised speech tests, varying from Consonant-Vowel-Consonant (CVC) word lists to lists of sentences. The Minimum Speech Test Battery (MSTB) for adult CI users (Minimum Speech Test Battery, Citation2011) recommends assessment of performance with CVC words in quiet and sentence materials in quiet and in noise.
Improvements in QoL were examined by the use of health-related QoL questionnaires or patient-reported outcome measures (PROMs) in many studies (see for systematic reviews Gaylor et al. Citation2013; McRackan et al. Citation2018a, Citation2018b). The Nijmegen Cochlear Implant Questionnaire (NCIQ) (Hinderink, Krabbe, and Van Den Broek Citation2000) is a CI-specific PROM that is often used. It evaluates a CI users’ opinion on domains of auditory perception, but also on speech production, social functioning and self-esteem. Besides this CI-specific PROM several hearing-specific PROMs were used in CI outcome research, like the Hearing Handicap Inventory in Adults/Elderly (HHIA/HHIE) (Capretta and Moberly Citation2016; Park et al. Citation2011; Vermeire et al. Citation2005) and the Speech, Spatial and Qualities (SSQ) questionnaire (Capretta and Moberly Citation2016; Ramakers et al. Citation2017; Zhang et al. Citation2015). Using one or more of these questionnaires, many studies showed that a CI improves several aspects beyond speech recognition, like social interaction (e.g. Klop et al. Citation2008; Looi, Mackenzie, and Bird Citation2011) or emotional well-being (e.g. Park et al. Citation2011; Vermeire et al. Citation2005).
Although an improvement in QoL is related to many aspects of functioning, it is reasonable to hypothesise that better QoL with respect to CI use is at least associated with better speech recognition. However, literature does not provide clear evidence for this association. McRackan et al. (Citation2018a) reported in their meta-analysis that negligible to moderate correlations were found between speech recognition scores and QoL. This finding was mainly based on correlations with overall NCIQ scores. They stated that the improvement in NCIQ scores was mainly due to the two sound processing domains (Basic sound perception and Advanced sound perception).
The relation between PROM scores and speech recognition scores may be influenced by at least three aspects of speech recognition, that may add variability. First, the extent to which the speech material of the test is representative of everyday situations may differ between speech materials. If the speech material is highly predictable, the intelligibility score could be at maximum for a significant amount of CI users, making it less representative for more difficult every day listening situations. This may result in smaller correlation coefficients between speech scores and PROMs. Second, measures of speech recognition in quiet may be less representative for daily life situations than measures of speech recognition in noise. Third, speech recognition is a highly stochastic process and therefore speech recognition scores have relatively low test-retest reliability (Bronkhorst, Bosman, and Smoorenburg Citation1993; Thornton and Raffin Citation1978). Furthermore, the relation between PROM scores and speech recognition scores may be influenced by factors that are not related to auditory functioning, but may influence the reported outcome. Given these considerations, only moderate correlations between speech recognition and PROMs are expected. This correlation may be highest if ecologically valid speech material in noise is used in combination with a hearing-specific questionnaire.
Some studies used hearing-specific questionnaires as a PROM additionally to speech intelligibility measurements in CI users. For example, for the SSQ questionnaire, significant correlations were reported for phoneme identification scores and all SSQ scales (Fuller et al. Citation2012), word scores and the Speech scale (Zhang et al. Citation2015), or sentence scores and the Speech scale (Capretta and Moberly Citation2016) or the Qualities scale (Heo, Lee, and Lee Citation2013). Ramakers et al. (Citation2017) reported correlations between speech in noise measures and the SSQ Speech scale but did not find a significant correlation for unilateral CI users. Given that little published data on the relation of the SSQ scores and sentence recognition in noise exist, it remains unclear if the SSQ scores have a stronger association with speech in noise scores than the NCIQ questionnaire. More in general, few studies looked to the correlation between sentence recognition in noise and PROMs (McRackan et al. Citation2018b).
Although speech perception measurements are only weakly or moderately correlated with PROMs, subjective judgment of speech intelligibility in noise situations may have a more direct relationship with PROMs, because other aspects like listening comfort, experienced effort and noise tolerance may be taken into account. The acceptable noise level (ANL) test (Nabelek, Tucker, and Letowski Citation1991) is a good example of such a subjective judgment. This test measures the noise acceptance of a listener while listening to running speech. The resulting ANL is the minimum SNR that a listener tolerates during listening to speech in noise. Originally, the purpose of the ANL test was to help explain variance in hearing aid use between individuals (Nabelek, Tucker, and Letowski Citation1991). However, after its introduction, it has being used in hearing-aid studies as a kind of general measure for noise tolerance/acceptance when listening to speech (Johnson, Ricketts, and Hornsby 2009; Mueller, Weber, and Hornsby 2006; Peeters et al. 2009). A few studies examined the ANL test in CI recipients. Plyler, Bahng, and von Hapsburg (Citation2008) studied the ANL test in a small group of nine CI recipients and reported that their ANL values were not significantly different from ANL values of listeners with normal hearing. Furthermore, the ANL was not correlated with measured Speech Reception Thresholds in noise (SRTn) values and subjective outcome measures, except the overall satisfaction with CI listening. Donaldson et al. (Citation2009) investigated to what extent the ANL and SRTn values could predict perceived communication difficulties as measured with the Abbreviated Profile of Hearing Aid Profile (APHAB). They reported that ANL values of CI users were similar to those of normal hearing listeners and that ANL values were not correlated to the SRTn value that was measured with the Bamford-Kowal-Bench sentence-in-noise test (BKB-SIN). Both SRTn and ANL accounted for more than one-third of the variance in self-rated communication difficulties of the CI users. Dingemanse and Goedegebure (Citation2015) confirmed that both ANL and SRTn were significantly correlated with APHAB scores. Further research is needed to confirm that ANL is indeed a factor in predicting the subjective outcome measures in CI listeners, and if this finding of Donaldson and colleagues extend to other questionnaires.
The objective of this study was to answer the following questions for unilateral CI users:
To what extent are hearing-specific patient-reported outcomes as measured with the SSQ associated with measures of speech intelligibility in noise and quiet?
Is noise tolerance as measured with the ANL test a contributing factor in predicting SSQ results, in addition to measures of speech intelligibility in noise and quiet?
We hypothesise that speech intelligibility in noise and noise tolerance may explain a larger part of the variance in SSQ scores than speech intelligibility in quiet.
Materials and methods
Participants
Fifty adult CI recipients were selected for this study. All participants were Dutch native speakers and had a phoneme score with their CI of at least 60% on clinically used Dutch CVC word lists (Bosman and Smoorenburg Citation1995). Furthermore, participants had post-lingual onset of hearing loss and at least 1 year CI use.
Two participants were excluded because they did not manage to perform the ANL task reliably. The remaining 48 participants were unilateral CI users with severe hearing loss in the other ear. Twelve of them were wearing a contralateral hearing aid, but not during the tests. shows participant characteristics that are known for their influence on speech perception outcomes after implantation: Duration of severe-to-profound hearing loss (SPHL) [pure tone average over 0.5, 1, 2, 4 kHz ≥ 80 dB (HL) or a hearing threshold ≥110 dB (HL) for at least two frequencies or aided phoneme score ≤75%], the number of years of hearing aid use before CI implantation, and the age at CI implantation. Free-field thresholds were better than 40 dB HL (average of 0.5, 1, 2 and 4 kHz) for 92.5% of the participants.
Table 1. Characteristics of the CI recipients.
Participants with an Advanced Bionics implant had at least 14 active electrode contacts and HiRes Optima S sound processing. During the study, a T-mic microphone was used and all sound enhancement algorithms were switched off. In the daily used programme all but two participants had ClearVoice switched on (near all in Medium setting). The input dynamic range setting was 55–63 dB. Participants with a Cochlear Ltd implant had at least 21 active electrode contacts and an “Everyday” Smartsound programme with Autosensitivity and ADRO active.
Participants signed a written informed consent form and the Erasmus Medical Centre Ethics Committee approved the study protocols of the original studies whose data were taken.
Data of an age-matched reference group without hearing problems (henceforth, NH group) was also used. These data were taken from the study of Koch et al. (Citation2016). In that study, the participants (33 female, 22 male) ranged in age from 30 to 77 years with a mean of 60.7 years (SD = 11.0). The SRTn reference value is taken from Dingemanse and Goedegebure (Citation2019) who measured the SRTn in 16 normal hearing (NH) subjects, with a mean age of 22 years (SD = 3.0; range 20–29 years).
Speech intelligibility tests
The proportion of correctly recognised words from sentences in quiet (PCq) was measured with 26 Dutch female-spoken unrelated sentences (Versfeld et al. Citation2000). These sentences were representative for daily-used communication and mainly selected from a newspaper database. The sentences were pronounced in a natural, clear manner with normal vocal effort and speaking rate. The presentation level of the sentences was fixed at 70 dB (SPL). This speech level is often reached in noisy situations (Pearsons, Bennett, and Fidell Citation1977).
For measurement of SRTn, i.e. the signal-to-noise ratio that yields 50% word intelligibility, a steady-state speech spectrum noise was used. The noise level was varied following an adaptive procedure to estimate the SRTn, using 26 sentences. An extensive description of the SRTn measurement is given in Dingemanse and Goedegebure (Citation2015).
To estimate the psychometric function, the trials of the SRTn measurement were sorted in three SNR groups and for each group the average SNR and proportion correct was calculated. These three means and the proportion correct in quiet were used to fit a logistic function. It is known that the slope of the psychometric function is biased if the function is fitted from adaptive staircase data. Therefore the slope was corrected with a factor 0.8 (Brand and Kollmeier Citation2002; Smits and Houtgast Citation2006).
The perception of CVC words in quiet was measured with the clinically used Dutch word lists for speech audiometry of the Dutch Society of Audiology (Bosman and Smoorenburg Citation1995). Word scores were obtained from a participants’ clinical record if they were measured within 6 months before the visit or measured just before the experiment otherwise. The word recognition score was measured at 65 and 75 dB (SPL) and these scores were averaged to reduce variability and to obtain an estimate of the score at 70 dB (SPL).
Acceptable noise level test
The ANL is the difference between the most comfortable level (MCL) for running speech and a background noise level (BNL) that was adjusted by the participant in order to select the maximum BNL that the participant was willing to accept while following the speech. The listeners were given oral and written instructions, which were Dutch translations of the instructions in Nabelek et al. (Citation2006). In these instructions, participants were asked to find the MCL in three steps: to first adjust the level of the speech until it was too loud, then to decrease the level until it is too soft. Finally they were asked to carefully select the loudness level that was most comfortable by making 2 dB steps up and down. Similarly the BNL was measured in three steps. With the running speech presented at MCL, the task was to first set the level of the noise too loud, then to decrease the noise level until the speech became very clear and finally to adjust the noise level carefully to the level that one would put up with for a long time while following the running speech. For each test condition, the MCL and BNL procedures were repeated three times and the mean values were used for calculation of the ANL. To ensure maximum similarity in speech and noise signals between the speech in noise test and the ANL test, unrelated sentences of the speech-in-noise test lists were connected with intervals of 500 ms of silence between them to obtain running speech. The noise was the same steady-state speech spectrum noise as used in the speech in noise test.
SSQ questionnaire
All participants were asked to complete the Speech Spatial and Qualities of hearing questionnaire (SSQ) to assess the participants’ experience with CI use in everyday communication situations (Gatehouse and Noble Citation2004). The SSQ has three scales: speech comprehension, spatial hearing and quality of sound. The questions ask for abilities that relate to listening in more complex and perceptually demanding environments. Only the speech and quality scales were used, because participants were unilateral CI users and test time was restricted. In addition, the speech and quality scales were divided into a pragmatic set of subscales for the SSQ, as proposed by Gatehouse and Akeroyd (Citation2006). The Dutch version 3.2.1 (2007) was used in this study and questions were presented online with 10 cm VAS scales with a marker that could be moved along the scale.
Test procedures
For this cross-sectional study, the data collection was part of larger test protocols. (cf. Dingemanse and Goedegebure Citation2018; Dingemanse, Vroegop, and Goedegebure Citation2018; Vroegop et al. Citation2017) In all test protocols, a practice run for the sentence-in-noise test was performed to make the participants familiar with the voice and the task and to obtain a first estimation of a participants’ SRTn. This practice run was followed by a sentence test in quiet, and a practice run for the ANL test to learn the procedure and to follow the instruction carefully. Next, an ANL test and SRTn test were performed, of which the outcomes were used for the analysis in this study. After that, other tests were performed, that were specific to the aforementioned studies. The SSQ questionnaire was completed before or after the tests. The CI was set in the most used daily life programme and volume adjustments were not allowed during the test session.
The ANL test and the method of SSQ administration used were exactly the same for theNH group.
Equipment
All testing was performed in a sound-treated room. Participants sat 1 m in front of a loudspeaker. All tests were presented in a custom application (cf. Dingemanse and Goedegebure Citation2015) running in Matlab. In the ANL test, a keyboard was used to increase or decrease the sound level of the running speech in the MCL task or the noise level in the BNL task. The step size was 2 dB per button press. The application showed the course of the presentation level during the MCL and the BNL task, making it easy to check if participants did the task in accordance with the instructions.
Data analysis
Speech performance scores were transformed to rationalised arcsine unit (rau) scores in order to make them suitable for statistical analysis, according to Studebaker (Citation1985). For correlations with SSQ non-parametric Spearman correlation coefficients were used. In cases of multiple comparisons, we used the Benjamini–Hochberg method to control the false discovery rate at level 0.05 (Benjamini and Hochberg Citation1995). Regression curves were fitted using the total least squares approach. Multiple regression analyses were performed to examine to which extent SRTn, PCq and ANL could predict the SSQ outcomes. In the regression analyses adjusted R2 values were reported as an indicator of the proportion of variance explained in addition to the regular R2, which tends to overestimate the explained variance. Data analysis was performed with SPSS (IBM, Version 23, Chicago, IL, USA) and Matlab (MathWorks, v9.4.0).
Results
Speech measures and ANLs
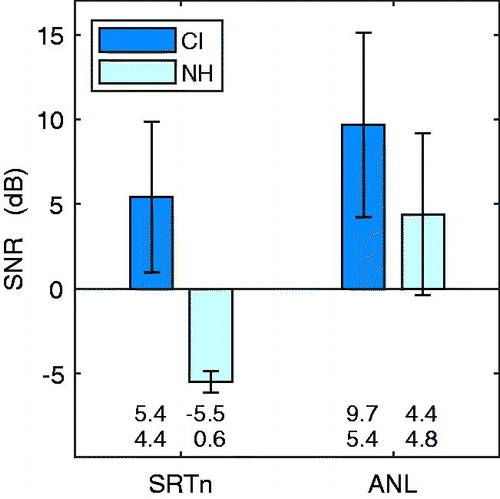
shows the mean SRTn and ANLvalues. Compared to the NH reference, CI users had significantly higher SRTn values (t test, t = 9.7, df = 62, p < 0.001) and ANL values (t test, t = 5.2, df = 101, p < 0.001). The difference in SRTn values is greater than the difference in ANL values. The average MCL values of the CI group (60.2 ± 5.8 dB) and the NH group (59.0 ± 6.6 dB) were comparable (t test, t = 1.0, df = 101, p = 0.31).
Figure 1. Speech reception thresholds in noise (SRTn) and Acceptable noise levels (ANL) for CI users and NH listeners. Lower SRTn and ANL values indicate better performance. Error bars indicate the standard deviation. Numbers of mean and SD are given below the bars.
For the CI group, the proportion of correct CVC words (PCcvc) had a mean value of 0.65 rau, an SD of 0.17 and a range from 0.57 to 1.15 rau. The PCq of words from sentences was somewhat higher with a mean value of 0.95 rau, an SD of 0.16 and a range of 0.61–1.19 rau.
For the CI users, we checked whether patient characteristics were associated with the outcome measures by calculating correlation coefficients. Duration of severe-to-profound hearing loss and years of hearing aid use before CI had no significant correlations with any of the speech scores nor with ANLs. A higher age at implantation was significantly associated with lower speech scores if the sentence speech material was used (for PCq, ρ = −0.42, p < 0.001; for SRTn, ρ = −0.48, p < 0.001). Free-field pure-tone averages with CI were not significantly related to any of the speech scores, nor to ANLs. The difference of the mean SSQ scores (both Speech and Qualities) of the group with a contralateral hearing aid and the group without a hearing aid was smaller than 0.1 and not significant. Furthermore, the speech scores of both groups (as measured with CI only) were not significantly different. Given these findings, we did not expect any influence of the use of a contralateral hearing aid on SSQ scores.
provides Pearson correlation coefficients between PCcvc, PCq, SRTn and ANL. The correlation analysis showed that better CVC word scores were significantly correlated with better scores for words from sentences (PCq). Furthermore, lower (=better) speech in noise thresholds were significantly related to higher speech scores in quiet, especially to PCq. This relation was plotted in the left panel of , showing the data points together with a regression line. The shared variance was 73%. We observed that even the CI participants with the highest PCq scores (near maximum) had an SRTn that is higher than the SRTn of the normal-hearing reference group. The regression line indicates that a score of 100% correct words corresponds with an SRTn of −0.35 dB. This is 5 dB above the SRTn of −5.5 dB in the normal-hearing reference group.
Figure 2. Proportion of correct words from sentences in quiet (PCq) plotted against the Speech Reception Thresholds in noise (SRTn), obtained with word scoring (left panel), together with a regression line. The y-axis on the left shows the proportion correct in rau units and the y-axis on the right of the left panel gives the proportion correct scores. The black square shows the normal-hearing reference value. The right panel shows the intelligibility function of four groups of CI users and the NH reference. The grey area is the area with ecological SNRs.
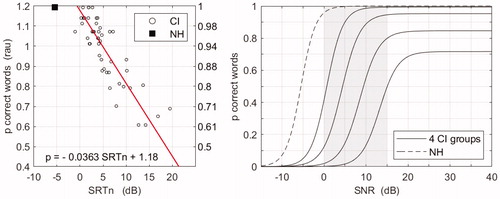
Table 2. Correlation matrix with Pearson correlation coefficients and corrected significance levels for proportion of correct CVC words (PCcvc), proportion of correct words from sentences in quiet (PCq), speech reception threshold in noise (SRTn) and acceptable noise level (ANL) as measured in the CI group.
To get more insight into the relationship between speech intelligibility in quiet and in noise, individual psychometric functions were fitted from the PCq and SRTn data. In three subjects this did not result in a reliable fit. These subjects were excluded from analyses with the psychometric curves involved. The individual psychometric functions were sorted by their SRTn value and then they were divided into four groups in such a way that the mean SRTs of these groups were almost equally spaced. The right panel of shows mean psychometric curves of these four groups, illustrating the strong relation between SRTn and PCq. The area with ecological SNRs (Smeds, Wolters, and Rung Citation2015) is shown in grey, and makes clear that subjects with PCq < 0.7 have very limited speech understanding in background noise at ecological SNRs.
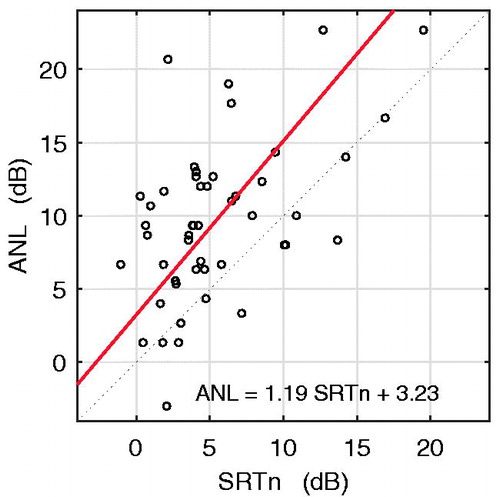
Furthermore, indicates that higher ANLs were associated with lower PCq values and higher SRTn values. No significant correlation was found between ANLs and PCcvc. shows the relationship between SRTn and ANL. Because of the strong relationship between PCq and SRTn (), we plotted ANL against SRTn only. From this figure it is clear that most ANL values were above the diagonal, according to the instruction of the ANL measurement, asking for the maximum ANL “while following the speech”.
Figure 3. Acceptable noise levels (ANL) compared with Speech reception thresholds in noise (SRTn), together with a regression line.
SSQ outcomes
shows the SSQ scores on different scales and subscales. Higher values on the SSQ scale indicate fewer limitations in self-reported activity due to hearing problems. Only a small difference was found between the SSQ Speech scale and the SS Qualities scale. Both scales were strongly correlated (ρ = 0.70, p < 0.0001).
Figure 4. Mean values on the speech and qualities scales and pragmatic subscales of the Speech, spatial and qualities (SSQ) questionnaire for the CI group and the NH group. Error bars indicate the standard deviation. Numbers of mean and SD are given below the bars.
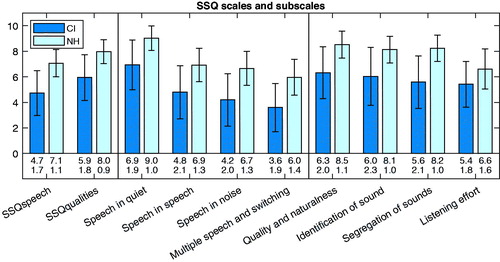
The highest scores were found for the “speech in quiet” subscale, followed by “sound quality and naturalness”. The lowest scores were obtained for subscale “Multiple speech-stream and switching”. All SSQ scales and subscales were significantly smaller in the CI group than in the NH group (Wilcoxon rank-sum tests, p < 0.001). In general, the variability was greater in the CI group than in the NH group.
When investigating correlations between SSQ outcomes and patient characteristics, we only found a significant correlation of age at implantation and the SSQ Qualities scale (ρ = −0.42, p < 0.01).
Relation of SSQ with speech measures and ANL
Spearman correlation coefficients were calculated to examine the relationships between the SSQ (sub)scales, the speech measures, and ANL ().
Table 3. Correlation matrix with Spearman correlation coefficients for proportion of correct CVC words (PCcvc), proportion of correct words from sentences in quiet (PCq), speech reception threshold in noise (SRTn), and Acceptable noise level (ANL) as measured in the CI group.
The SSQ Speech scale and its subscales were not significantly correlated with CVC word scores, except for the “Speech in quiet” subscale. In contrast, the scores for the sentence material (PCq and SRTn) had significant weak to moderate correlations with the SSQ Speech scale and its subscales, and were greater than the correlations for the CVC words. The correlations of SRTn and PCq with SSQ (sub)scales were very similar, as expected from the strong correlation between SRTn and PCq (; ). provides scatter plots of the SSQ scales against the SRTn and ANL data, to gain insight into why the correlations found were only moderate. Panel A of shows that SSQ Speech values had high variability, even for a narrow range of SNRs. For example, for an SNR of about 4 dB, the SSQ Speech values varied from 2 to 8. Some CI users rated their speech intelligibility among other sounds as low (SSQ Speech <4), even if their SRTn value was smaller than 10 dB. Participants with a very high SRTn value (>10 dB) tended to rate their problems with speech understanding in noise as moderate (SSQ Speech values around 5). Lower SSQ Speech values tended to be related to higher ANLs (, panel B), but the correlation coefficient reached no sufficient significance (), except for the subscale “speech in noise”.
Figure 5. Relations of SSQ speech and SSQ quality with the speech reception threshold in noise (SRTn) and the acceptable noise level (ANL), together with fitted regression lines.
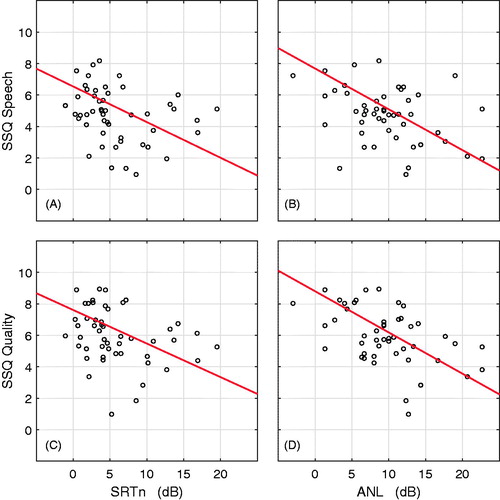
The SSQ Qualities scale and its subscales were significantly correlated with CVC word scores and sentence scores in quiet, except for the “Listening effort” subscale. Better speech intelligibility in quiet was associated with better perceived sound quality. Panel C of presents a scatterplot of SSQ Qualities scores against SRTn scores, showing similar observations as in panel A: There is a relation between SRTn and SSQ Qualities, but some CI users with relatively good (=low) SRTn rated their speech perception in noisy situations with relatively low SSQ Qualities values.
The SSQ qualities scale and its subscales had significant moderate correlations with ANLs. Smaller (better) ANLs were associated with better SSQ qualities scores (, panel D). It is noteworthy that higher ANLs were significantly correlated with more listening effort (lower scores on the “Listening effort” scale), while speech intelligibility measures did not.
Prediction of SSQ
Multiple regression analyses were conducted to examine the predictive value of the ANL variable in addition to the speech measures (PCcvc, PCq, SRTn) with respect to both the SSQ Speech and SSQ Qualities subscales. Assumptions of multiple regression analysis were checked. No outliers were detected in the standard residuals, tests for multicollinearity indicated that the level of multicollinearity was low (VIF < 1.35), the assumption of independent errors was not violated (Durbin–Watson value < 2.1). The scatterplot of standardised predicted values versus standardised residuals, showed that the data met the assumptions of homogeneity of variance and linearity, and the residuals were approximately normally distributed.
The results of the multiple regression analyses for the SSQ Speech scale are shown in as models Sa, Sb and Sc. These analyses showed that the different combinations of speech measures and ANL were significantly related to SSQ Speech, but with a low predictive power (R2adj values around 0.1–0.15). ANL did not significantly contribute to the prediction of SSQ Speech in addition to the speech measures of the sentences (PCq and SRTn).
Table 4. Prediction of SSQ Speech and Qualities by proportion of correct CVC words (PCcvc), proportion of correct words from sentences in quiet (PCq), speech reception threshold in noise (SRTn) and acceptable noise level (ANL) as measured in the CI group.
For SSQ qualities, an analysis of standard residuals was carried out on the data to identify any outliers, which resulted in removal of the data of participant 37. All assumptions were checked and none was violated (VIF <1.4; Durbin-Watson value < 2.3). The analyses show that the combination of PCcvc and ANL and the combination of PCq and ANL predicted SSQ Qualities significantly with an explained variance of 27 to 30%, but SRTn had no additional predictive value to ANL. Regression coefficients for both ANL and PCcvc or PCq were significant.
With ANL as the second predictor the adjusted R2 (i.e. de explained variance) value increased with 0.09 (PCq) to 0.15 (PCcvc).
In addition, we have included the use of a contralateral hearing aid as a factor. In none of the models, this factor was statistically significant and the predictive value of speech variables and ANL hardly changed.
Discussion
Relation of speech measures and SSQ
In this study, the SSQ was used as hearing-specific PROM in the domains of speech, with questions mainly focussed on speech perception among other sounds, and qualities, with questions about naturalness, identification, segregation of sounds and listening effort. As explained in the introduction, we expected a significant relation between speech measures and the SSQ. This relationship was clearly seen when comparing CI users with NH listeners. The speech in noise thresholds of CI users were substantially poorer than those of the NH listeners and also the mean SSQ scores of CI users were on average significantly smaller than the mean scores of the NH group (). The mean SSQ scores of the CI group are comparable with values of the speech and qualities domains reported by Mertens, Punte, and Van de Heyning (Citation2013), but greater than the values found by Farinetti et al. (Citation2015). Differences in the inclusion criteria are the most likely explanation. Farinetti and colleagues had no inclusion criterion based on speech perception, but we only included participants with at least 60% phoneme score on clinically used Dutch CVC word lists. shows the relation of the SSQ with SRTn and ANL. For the best performing CI participants the SSQ values were in the range of older subjects with minimal hearing loss [the NH reference group from ; Banh, Singh, and Pichora-Fuller (Citation2012)] to adults with mild hearing difficulties (mean better ear pure-tone average of 39 dB over 0.5–4 kHz) (Gatehouse and Noble Citation2004). However, the SRTn value of the best performing CI users is around 5 dB below the values of the NH reference group. This suggests that the best performing CI users rated their abilities relatively high on the SSQ. It may be that their reference of what performance is normal had changed, because they are used to their own speech reception possibilities. The participants with the worst speech scores had SSQ values in the range of the values reported by Farinetti et al. (Citation2015). Regarding the subscales of the SSQ, Dwyer, Firszt, and Reeder (Citation2014) reported mean scores for 20 CI users. Their scores were comparable to the values found in this study.
In the CI group, more variation in SSQ scores is seen, compared to the NH group. An explanation for this observation may be the fact that speech understanding scores had also a greater spread. In summary, the significant differences between the CI group and the NH group for both speech measures and SSQ scores, confirm that there is a relationship between hearing performance and PROMs.
Within the CI group, we found that the SSQ Speech scale was significantly correlated with the measures of the sentence material but not with the CVC word scores. This suggests that speech measures with more ecologically valid speech material may better reflect the experienced limitations in daily life. A comparable result was obtained by Moberly et al. (Citation2018), who reported a correlation coefficient of 0.18 for words in quiet in relation to the Advanced Sound Perception scale of the NCIQ, and 0.49 for sentences in quiet with the same NCIQ scale. On the other hand, the regression analyses showed that CVC scores and scores of words from sentences were not very different in predictive power.
Another reason for the higher correlation with sentences may be the fact that the proportion of correct words from sentences had a smaller test–retest variability. The test-retest variance is related to the number of sentences in a list (N = 26) and the number of statistically independent elements in a sentence. The latter is around 2 Dingemanse and Goedebure, Citation2019), giving 52 independent elements. The CVC words test consisted of 22 independent words. So, the accuracy of the mean word score for sentences is 1.5 times better than the accuracy of the CVC words.
It is remarkable that the PCq scores had higher correlations with the SSQ Qualities scale than with the SSQ Speech scale. This is in accordance with an observation by Heo, Lee, and Lee (Citation2013) who reported correlations of 0.48 and 0.66 for recognition of sentences and SSQ Speech and SSQ Qualities respectively in their study of bimodal benefit in CI users. The finding suggests that PCq scores and perceived sound quality were both partly dependent to the quality of the sound cues in the CI signal. Akeroyd et al. (Citation2014) reported a factor analysis of the SSQ from a large dataset and stated that the questions of the Qualities domain represent mainly clarity, separation and identification of sounds. So, there is good face validity of the relation between SSQ Qualities and speech recognition in quiet.
In the introduction, we argued that SSQ scores may have a stronger correlation with speech recognition in noise than with speech recognition in quiet, because measures of speech recognition in quiet may be less representative for daily life situations than measures of speech recognition in noise. Furthermore, most questions in the SSQ Speech domain are related to speech in other sounds. The underlying assumption of this argument is that both speech recognition in quiet and in noise, are measures of different aspects of auditory functioning.
However, the correlations between sentence recognition in quiet and in noise and the SSQ Speech domain were very similar. This can be explained by the finding that speech intelligibility in steady-state speech noise (SRTn) was highly correlated with speech intelligibility in quiet (PCq) in our CI group (). This high correlation is in accordance with the results of Gifford, Shallop, and Peterson (Citation2008) who reported a linear relationship between SRTn scores of the BKB-SIN test and performance on AzBio sentences in quiet in CI users. In our study, the relationship between SRTn and PCq was even stronger, because the same sentence material was used for both speech measures. An explanation for this relationship might be that even for speech in quiet the bottom-up information in the CI stimulation contains too little speech cues to reach an intelligibility score of 100% in most CI users. If noise is added, the amount of bottom-up information is partially masked and intelligibility is further reduced. The less bottom-up information available in quiet, the lower the intelligibility score and the less noise is allowed to reduce the intelligibility to 50%. Thus, the variation of speech intelligibility in quiet and in noise among CI users originate from the same source (the available amount of bottom-up information), resulting in a high correlation between the two speech measures. The scarcity of bottom-up information may be due to poor frequency resolution (Anderson et al. Citation2011; Dingemanse and Goedegebure Citation2015; Won, Drennan, and Rubinstein Citation2007) and the lack of temporal fine structure (Heng et al. Citation2011) among other factors related to the electro-neural interface of a CI.
Even in the best performing CI recipients with a score near 100%, the bottom-up CI signal contains less information than the sensory bottom-up information in NH listeners. This is illustrated by the observation from that CI users with a near 100% score had SRTn values around the regression line that was around 5 dB worse than the NH group. This suggests that the internal signal representation of a CI can have a loss of detail equivalent with 5 dB SNR loss if intelligibility in quiet is still at 100%.
ANL measures in CI users
We found that ANL values of the CI users were significantly higher than that of the NH group. This is in contrast with the findings of two other studies that measured ANL in CI users and NH listeners (Donaldson et al. Citation2009; Plyler, Bahng, and von Hapsburg Citation2008). Furthermore, these studies reported that ANLs were not correlated with SRTn values, but we found a significant moderate correlation (ρ = 0.51) between ANL and SRTn scores. An explanation for both differences between this study and the findings of Donaldson et al. and Plyler et al. may be that in this study the same speech material was used in the ANL test and the SRTn test. That made it possible to compare the two measures, while the other studies used the original ANL speech (the Arizona Travelogue passage) in 12-talker babble as ANL stimuli and other speech materials for the SRTn measurement. The use of different materials may have added variability due to differences in spectra of speech and noise or due to differences in available contextual information within the speech materials. A second factor that may have played a role is related to the ANL instruction. This instruction asks to “adjust the noise to the level that would put up with for a long time while following the story (or speech)”. It is reasonable to assume that “following the story” requires that the speech intelligibility level is greater than 50% correct, i.e. greater than the SRTn. From the left panel of , it is clear that this holds for most participants. This requirement, together with the large range of SRTn values, most likely resulted in the correlation between ANL and SRTn. In the studies of Donaldson et al. and Plyler et al., the mean ANL values were below the mean SRTn values, so the question is whether the speech understanding of the ANL speech was sufficient. Donaldson and colleagues reported ANL intelligibility rating with a mean value of 84%. This may indicate that the Arizona Travelogue passage is very easy to follow, with many familiar words and with a high degree of contextual information. On the other hand, CI recipients are used to low intelligibility levels and the usage of contextual information. This may have influenced their ratings.
The instruction of the ANL measurement turned out to be difficult for participants to perform, because it contains two criteria that must be used simultaneously. One has to follow the speech and one has to maximise the noise with respect to that level that would be acceptable. In CI users, a change in the noise level also affects the intelligibility of the speech, linking the two criteria. In the practice run, participants learned to use both criteria simultaneously. Two participants that apparently used a different criterion, namely how much noise one was willing to accept, without listening to the speech, were excluded from the analyses. Other participants may have focussed too much on “following the speech”, resulting in high ANL values. However, if ANL values > 15 dB were excluded, the correlations did not change much and the regression analysis had similar results. Therefore, we conclude that any incorrectly used ANL instruction did not have had major effects on the findings of this study. In general, the dependence of the two criteria is a weakness of the ANL test construct.
ANL as an additional factor in predicting the SSQ
In our study, ANL contributed around 10% to the explained variance in the SSQ Qualities values and around 2% to that of the SSQ Speech scale in addition to speech recognition measures. The finding of Donaldson et al. (Citation2009) that SRTn and ANL contributed each around 30% to the explained variance in APHAB scores, therefore, could not be reproduced for the SSQ. This difference between the studies may be due to the correlation between SRTn and ANL found in this study and the difference in speech materials used, as discussed above. An additional explanation may be the difference in the questionnaire used.
A remarkable finding of this study was that ANL correlated significantly with the “Listening effort” subscale, while speech intelligibility measures did not. Participants that accepted a relatively high noise level reported less listening effort. The Listening effort subscale is based on three questions: on concentration when listening, effort during a conversation, and the ability to ignore competing sounds. These aspects fit well with the ANL test in which ignoring noise and concentrating on speech also play a role.
Limitations
The results of this study are limited to a subgroup of relatively well-performing CI recipients, because we used an inclusion criterion of 60% correct CVC phonemes. This was required because use of an adaptive speech in noise test or ANL test for a maximum intelligibility below 60% has no validity.
In this study, we investigated relationships between a hearing-specific PROM and speech measurements only at group level. Use of intra-individual differences in the measures, for example the difference of post- and pre-CI measures, may result in higher correlations.
The noise in the speech in noise test was not a realistic noise, but it was a steady-state noise with a speech-shaped spectrum. In real life spectra of speech and noise often differ, giving a smaller slope of the intelligibility curve as a function of SNR and an SRTn that is dependent on the differences between the speech and noise spectra. Therefore, it is difficult to generalise results if SRTn values were measured with real life noises. The SRTn values obtained with a steady-state noise can be seen as an indication of an individual’s ability to understand speech in situations with background noise.
We included unilateral CI users only, with some having a contralateral hearing aid. In the speech test, this hearing aid was switched off, while the use of a contralateral hearing aid (bimodal hearing) may have influenced the SSQ scores. However, the effect of a contralateral hearing aid was not statistically significant in this study. This is in accordance with the results of Farinetti et al. (Citation2015). They reported outcomes of the SSQ for a group with unilateral CIs (n = 54) and a bimodal group with a CI and a contralateral hearing aid (n = 62). They found no significant differences on the Speech and Qualities scales, except for the “Sound quality and naturalness” subscale.
General discussion
The combination of PCq and ANL explained 14% of the variance in the SSQ Speech scale and 30% of the variance in the SSQ Qualities scale, leaving a substantial part of the variance in SSQ scores unexplained. Factors beyond speech recognition may have contributed to the SSQ scores, like the effect of audiovisual speech recognition (Moberly et al. Citation2018; Stevenson et al. Citation2017). Also we found that the age of implantation had a significant effect on the SSQ scores.
Another factor that may explain a part of the variance in SSQ scores is personality. SSQ scores reflect the opinion of the patient. This opinion may be more positive or more negative between persons with comparable speech perception if they judge the same situation. The perception of one’s ability is likely to be different from real ability. Huang et al. (Citation2017) conducted a systematic review on the question if personality affects health-related QoL scores. They reported that health-related QoL measures are related to personality characteristics. Aspects like greater extraversion, agreeableness, openness, conscientiousness, optimism, self-esteem and self-efficacy were related to higher health-related QoL scores, while greater neuroticism, negative affectivity, and type D (distressed) personality were related to lower health-related QoL scores.
Conclusions
Hearing-specific patient-reported outcomes in adult CI users as measured with the SSQ questionnaire were moderately associated with measures of speech intelligibility in quiet and in noise. Also SSQ scores of CI users were significantly below the scores of a normal-hearing reference group. The same applied to speech intelligibility in quiet and in noise. These findings show that hearing-specific PROM scores were clearly related to sentence intelligibility.
The variance in the SSQ as hearing-specific PROM in CI users was not better explained by speech intelligibility in noise than by speech intelligibility in quiet. This can be explained by the remarkably high correlation between these two measures, suggesting that, even in a quiet situation, CI recipients have to rely on incomplete sensory information without redundancy.
Although the ANL is a subjective judgment of the level of background noise a listener is willing to accept, ANLs made only a small contribution to explaining the variance of the SSQ in addition to speech perception, even though ANLs correlate significantly with the SSQ subscale of listening effort and concentration that was not addressed by speech measures.
The speech measures and ANL only explained a part of the variability in SSQ scores, showing that use of a hearing-specific PROM besides speech tests provides information not captured by speech measures.
Author contributions
G.D. and A.G. designed the study, G.D. did the analyses, and drafted the manuscript. A.G. revised the manuscript. Both authors approved the final version of the manuscript for submission.
Disclosure statement
The authors declared no potential conflicts of interest with respect to the research, authorship and/or publication of this article.
Correction Statement
This article has been republished with minor changes. These changes do not impact the academic content of the article.
References
- Akeroyd, M. A., F. H. Guy, D. L. Harrison, and S. L. Suller. 2014. “A Factor Analysis of the SSQ (Speech, Spatial, and Qualities of Hearing Scale).” International Journal of Audiology 53 (2): 101–114. doi:10.3109/14992027.2013.824115.
- Anderson, E. S., D. A. Nelson, H. Kreft, P. B. Nelson, and A. J. Oxenham. 2011. “Comparing Spatial Tuning Curves, Spectral Ripple Resolution, and Speech Perception in Cochlear Implant Users.” Journal of the Acoustical Society of America. 130 (1): 364–375. doi:10.1121/1.3589255.
- Banh, J., G. Singh, and M. K. Pichora-Fuller. 2012. “Age Affects Responses on the Speech, Spatial, and Qualities of Hearing Scale (SSQ) by Adults with Minimal Audiometric Loss.” Journal of the American Academy of Audiology 23 (2): 81–91. doi:10.3766/jaaa.23.2.2.
- Benjamini, Y., and Y. Hochberg. 1995. “Controlling the False Discovery Rate: A Practical and Powerful Approach to Multiple Testing.” Journal of the Royal Statistical Society: Series B (Methodological) 57 (1): 289–300. doi:10.2307/2346101.
- Bosman, A. J., and G. F. Smoorenburg. 1995. “Intelligibility of Dutch CVC Syllables and Sentences for Listeners with Normal Hearing and with Three Types of Hearing Impairment.” International Journal of Audiology 34 (5): 260–284. doi:10.3109/00206099509071918.
- Brand, T., and B. Kollmeier. 2002. “Efficient Adaptive Procedures for Threshold and Concurrent Slope Estimates for Psychophysics and Speech Intelligibility Tests.” Journal of the Acoustical Society of America. 111 (6): 2801–2810. doi:10.1121/1.1479152.
- Bronkhorst, A. W., A. J. Bosman, and G. F. Smoorenburg. 1993. “A Model for Context Effects in Speech Recognition.” The Journal of the Acoustical Society of America 93 (1): 499–509. doi:10.1121/1.406844.
- Capretta, N. R., and A. C. Moberly. 2016. “Does Quality of Life Depend on Speech Recognition Performance for Adult Cochlear Implant Users?” The Laryngoscope 126 (3): 699–706. doi:10.1002/lary.25525.
- Dingemanse, J. G., and A. Goedegebure. 2015. “Application of Noise Reduction Algorithm ClearVoice in Cochlear Implant Processing: Effects on Noise Tolerance and Speech Intelligibility in Noise in Relation to Spectral Resolution.” Ear and Hearing 36 (3): 357–367. doi:10.1097/AUD.0000000000000125.
- Dingemanse, J. G., and A. Goedegebure. 2018. “Optimising the Effect of Noise Reduction Algorithm ClearVoice in Cochlear Implant Users by Increasing the Maximum Comfort Levels.” International Journal of Audiology 57 (3): 230–235. doi:10.1080/14992027.2017.1390267.
- Dingemanse, J. G., and A. Goedegebure. 2019. “The Important Role of Contextual Information in Speech Perception in Cochlear Implant Users and Its Consequences in Speech Tests.” Trends in Hearing 23: 2331216519838672. doi:10.1177/2331216519838672.
- Dingemanse, J. G., J. L. Vroegop, and A. Goedegebure. 2018. “Effects of a Transient Noise Reduction Algorithm on Speech Intelligibility in Noise, Noise Tolerance and Perceived Annoyance in Cochlear Implant Users.” International Journal of Audiology 57 (5): 360–369. doi:10.1080/14992027.2018.1425004.
- Donaldson, G. S., T. H. Chisolm, G. P. Blasco, L. J. Shinnick, K. J. Ketter, and J. C. Krause. 2009. “BKB-SIN and ANL Predict Perceived Communication Ability in Cochlear Implant Users.” Ear and Hearing 30 (4): 401–410. doi:10.1097/AUD.0b013e3181a16379.
- Dwyer, N. Y., J. B. Firszt, and R. M. Reeder. 2014. “Effects of Unilateral Input and Mode of Hearing in the Better Ear: Self-Reported Performance Using the Speech, Spatial and Qualities of Hearing Scale.” Ear and Hearing 35 (1): 126–136. doi:10.1097/AUD.0b013e3182a3648b.
- Farinetti, A., S. Roman, J. Mancini, K. Baumstarck-Barrau, R. Meller, J. P. Lavieille, and J. M. Triglia. 2015. “Quality of Life in Bimodal Hearing Users (Unilateral Cochlear Implants and Contralateral Hearing Aids).” European Archives of Oto-Rhino-Laryngology 272 (11): 3209–3215. doi:10.1007/s00405-014-3377-8.
- Fuller, Christina, Rolien Free, Bert Maat, and Deniz Başkent. 2012. “Musical Background Not Associated with Self-Perceived Hearing Performance or Speech Perception in Postlingual Cochlear-Implant Users.” Journal of the Acoustical Society of America 132 (2): 1009–1016. doi:10.1121/1.4730910.
- Gatehouse, S., and M. A. Akeroyd. 2006. “Two-Eared Listening in Dynamic Situations.” International Journal of Audiology 45 (sup1): 120–124. doi:10.1080/14992020600783103.
- Gatehouse, S., and W. Noble. 2004. “The Speech, Spatial and Qualities of Hearing Scale (SSQ).” International Journal of Audiology 43 (2): 85–99. doi:10.1080/14992020400050014.
- Gaylor, J. M., G. Raman, M. Chung, J. Lee, M. Rao, J. Lau, and D. S. Poe. 2013. “Cochlear Implantation in Adults: A Systematic Review and Meta-Analysis.” JAMA Otolaryngology–Head & Neck Surgery 139 (3): 265–272. doi:10.1001/jamaoto.2013.1744.
- Gifford, R. H., J. K. Shallop, and A. M. Peterson. 2008. Speech recognition materials and ceiling effects: Considerations for cochlear implant programs. Audiology and Neuro-Otology, 13 (3): 193–205. doi:10.1159/000113510.
- Heng, J., G. Cantarero, M. Elhilali, and C. J. Limb. 2011. “Impaired Perception of Temporal Fine Structure and Musical Timbre in Cochlear Implant Users.” Hearing Research 280 (1-2): 192–200. doi:10.1016/j.heares.2011.05.017.
- Heo, J. H., J. H. Lee, and W. S. Lee. 2013. “Bimodal Benefits on Objective and Subjective Outcomes for Adult Cochlear Implant Users.” Korean Journal of Audiology 17 (2): 65–73. doi:10.7874/kja.2013.17.2.65.
- Hinderink, J. B., P. F. Krabbe, and P. Van Den Broek. 2000. “Development and Application of a Health-Related Quality-of-Life Instrument for Adults with Cochlear Implants: The Nijmegen Cochlear Implant Questionnaire.” Otolaryngology–Head and Neck Surgery 123 (6): 756–765. doi:S0194-5998(00)94548-0 [pii]. doi:10.1067/mhn.2000.108203.
- Huang, I. C., J. L. Lee, P. Ketheeswaran, C. M. Jones, D. A. Revicki, and A. W. Wu. 2017. “Does Personality Affect Health-Related Quality of Life? A Systematic Review.” PloS One 12 (3): e0173806. doi:10.1371/journal.pone.0173806.
- Johnson, E., T. Ricketts, and B. Hornsby. 2009. The effect of extending high-frequency bandwidth on the acceptable noise level (ANL) of hearing-impaired listeners. Int J Audiol 48 (6): 353–362. doi:10.1080/14992020802662964.
- Klop, W. M., P. P. Boermans, M. B. Ferrier, W. B. van den Hout, A. M. Stiggelbout, and J. H. Frijns. 2008. “Clinical Relevance of Quality of Life Outcome in Cochlear Implantation in Postlingually Deafened Adults.” Otology & Neurotology 29 (5): 615–621. doi:10.1097/MAO.0b013e318172cfac.
- Koch, X., G. Dingemanse, A. Goedegebure, and E. Janse. 2016. “Type of Speech Material Affects Acceptable Noise Level Test Outcome.” Frontiers in Psychology 7: 186. doi:10.3389/fpsyg.2016.00186.
- Looi, V., M. Mackenzie, and P. Bird. 2011. “Quality-of-Life Outcomes for Adult Cochlear Implant Recipients in New Zealand.” The New Zealand Medical Journal 124 (1340): 21–34.
- McRackan, T. R., M. Bauschard, J. L. Hatch, E. Franko-Tobin, H. R. Droghini, S. A. Nguyen, and J. R. Dubno. 2018a. “Meta-Analysis of Quality-of-Life Improvement after Cochlear Implantation and Associations with Speech Recognition Abilities.” The Laryngoscope 128 (4): 982–990. doi:10.1002/lary.26738.
- McRackan, T. R, M. Bauschard, J. L. Hatch, E. Franko-Tobin, H. R. Droghini, C. A. Velozo, S. A. Nguyen, and J. R. Dubno. 2018b. “Meta-Analysis of Cochlear Implantation Outcomes Evaluated with General Health-Related Patient-Reported Outcome Measures.” Otology & Neurotology 39 (1): 29–36. doi:10.1097/MAO.0000000000001620.
- Mertens, G., A. K. Punte, and P. Van de Heyning. 2013. “Self-Assessment of Hearing Disabilities in Cochlear Implant Users Using the SSQ and the Reduced SSQ5 Version.” Otology & Neurotology 34 (9): 1622–1629. doi:10.1097/MAO.0b013e31829ce980.
- Moberly, A. C, M. S. Harris, L. Boyce, K. Vasil, T. Wucinich, D. B. Pisoni, J. Baxter, C. Ray, and V. Shafiro. 2018. “Relating Quality of Life to Outcomes and Predictors in Adult Cochlear Implant Users: Are We Measuring the Right Things?” The Laryngoscope 128 (4): 959–966. doi:10.1002/lary.26791.
- Minimum Speech Test Battery (MSTB). 2011. New Minimum Speech Test Battery for adult cochlear implant users. Retrieved from: http://www.auditorypotential.com/MSTBfiles/MSTBManual2011-06-20%20.pdf. (accessed March 2018).
- Mueller, H. G., J. Weber, and B. W. Hornsby. 2006. The effects of digital noise reduction on the acceptance of background noise. Trends Amplif, 10 (2): 83–93.
- Nabelek, A. K., M. C. Freyaldenhoven, J. W. Tampas, S. B. Burchfiel, and R. A. Muenchen. 2006. “Acceptable Noise Level as a Predictor of Hearing Aid Use.” Journal of the American Academy of Audiology 17 (9): 626–639. doi:10.3766/jaaa.17.9.2.
- Nabelek, A. K., F. M. Tucker, and T. R. Letowski. 1991. “Toleration of Background Noises: Relationship with Patterns of Hearing Aid Use by Elderly Persons.” Journal of Speech, Language, and Hearing Research 34 (3): 679–685. doi:10.1044/jshr.3403.679.
- Park, E., D. B. Shipp, J. M. Chen, J. M. Nedzelski, and V. Y. Lin. 2011. “Postlingually Deaf Adults of All Ages Derive Equal Benefits from Unilateral Multichannel Cochlear Implant.” Journal of the American Academy of Audiology 22 (10): 637–643. doi:10.3766/jaaa.22.10.2.
- Pearsons, K. S., R. L. Bennett, and S. Fidell. 1977. Speech levels in various noise environments. Washington, D.C.: U.S. Environmental Protection Agency.
- Peeters, H., F. Kuk, C. C. Lau, and D. Keenan. 2009. Subjective and objective evaluation of noise management algorithms. J Am Acad Audiol, 20 (2): 89–98. doi:10.3766/jaaa.20.2.2.
- Plyler, P. N., J. Bahng, and D. von Hapsburg. 2008. “The Acceptance of Background Noise in Adult Cochlear Implant Users.” Journal of Speech, Language, and Hearing Research 51 (2): 502–515. doi:10.1044/1092-4388(2008/036).
- Ramakers, G. G. J., Y. E. Smulders, A. van Zon, G. A. Van Zanten, W. Grolman, and I. Stegeman. 2017. “Correlation Between Subjective and Objective Hearing Tests after Unilateral and Bilateral Cochlear Implantation.” BMC Ear, Nose and Throat Disorders 17 (1): 10. doi:10.1186/s12901-017-0043-y.
- Smeds, K., F. Wolters, and M. Rung. 2015. “Estimation of Signal-to-Noise Ratios in Realistic Sound Scenarios.” Journal of the American Academy of Audiology 26 (2): 183–196. doi:10.3766/jaaa.26.2.7.
- Smits, C., and T. Houtgast. 2006. “Measurements and Calculations on the Simple Up-Down Adaptive Procedure for Speech-in-Noise Tests.” Journal of the Acoustical Society of America. 120 (3): 1608–1621. doi:10.1121/1.2221405.
- Stevenson, R. A., S. W. Sheffield, I. M. Butera, R. H. Gifford, and M. T. Wallace. 2017. “Multisensory Integration in Cochlear Implant Recipients.” Ear and Hearing 38 (5): 521–538. doi:10.1097/AUD.0000000000000435.
- Studebaker, G. A. 1985. “A “Rationalized” Arcsine Transform.” Journal of Speech, Language, and Hearing Research 28 (3): 455–462. doi:10.1044/jshr.2803.455.
- Thornton, A. R., and M. J. Raffin. 1978. “Speech-Discrimination Scores Modeled as a Binomial Variable.” Journal of Speech and Hearing Research 21 (3): 507–518. doi:10.1044/jshr.2103.507.
- Vermeire, K., J. P. Brokx, F. L. Wuyts, E. Cochet, A. Hofkens, and P. H. Van de Heyning. 2005. “Quality-of-Life Benefit from Cochlear Implantation in the Elderly.” Otology & Neurotology 26 (2): 188–195. doi:10.1097/00129492-200503000-00010.
- Versfeld, N. J., L. Daalder, J. M. Festen, and T. Houtgast. 2000. “Method for the Selection of Sentence Materials for Efficient Measurement of the Speech Reception Threshold.” Journal of the Acoustical Society of America. 107 (3): 1671–1684. doi:10.1121/1.428451.
- Vroegop, J. L., J. G. Dingemanse, M. P. van der Schroeff, R. M. Metselaar, and A. Goedegebure. 2017. “Self-Adjustment of Upper Electrical Stimulation Levels in CI Programming and the Effect on Auditory Functioning.” Ear and Hearing 38 (4): e232–e240. doi:10.1097/AUD.0000000000000404.
- Won, J. H., W. R. Drennan, and J. T. Rubinstein. 2007. “Spectral-Ripple Resolution Correlates with Speech Reception in Noise in Cochlear Implant Users.” Journal of the Association for Research in Otolaryngology 8 (3): 384–392. doi:10.1007/s10162-007-0085-8.
- Zhang, J., R. Tyler, H. Ji, C. Dunn, N. Wang, M. Hansen, and B. Gantz. 2015. “Speech, Spatial and Qualities of Hearing Scale (SSQ) and Spatial Hearing Questionnaire (SHQ) Changes over Time in Adults with Simultaneous Cochlear Implants.” American Journal of Audiology 24 (3): 384–397. doi:10.1044/2015_AJA-14-0074.