
Abstract
Objective
Speech-in-noise tests are widely used in hearing diagnostics but typically without reverberation, although reverberation is an inextricable part of everyday listening conditions. To support the development of more real-life-like test paradigms, the objective of this study was to explore how spatially reproduced reverberation affects speech recognition thresholds in normal-hearing and hearing-impaired listeners.
Design
Thresholds were measured with a Finnish speech-in-noise test without reverberation and with two test conditions with reverberation times of ∼0.9 and 1.8 s. Reverberant conditions were produced with a multichannel auralisation technique not used before in this context.
Study sample
Thirty-four normal-hearing and 14 hearing-impaired listeners participated in this study. Five people were tested with and without hearing aids.
Results
No significant differences between test conditions were found for the normal-hearing listeners. Results for the hearing-impaired listeners indicated better performance for the 0.9 s reverberation time compared to the reference and the 1.8 s conditions. Benefit from hearing aid use varied between individuals; for one person, an advantage was observed only with reverberation.
Conclusions
Auralisations may offer information on speech recognition performance that is not obtained with a test without reverberation. However, more complex stimuli and/or higher signal-to-noise ratios should be used in the future.
1. Introduction
Anechoic sounds can be regarded as an anomaly in our everyday life and perhaps even “unnatural” for our auditory system to process. Such sounds are however commonly used in traditional hearing diagnostics, including pure-tone audiometry and conventional speech recognition tests in quiet and noise conditions (e.g. Plomp and Mimpen Citation1979; Hagerman Citation1982; Kollmeier and Wesselkamp Citation1997; Versfeld et al. Citation2000; Dietz et al. Citation2014). Many researchers have noted a discrepancy between real-life sounds and stimuli commonly used in clinical practice (e.g., Middelweerd, Festen, and Plomp Citation1990; Bronkhorst and Plomp Citation1990). This is particularly prevalent with hearing aid (HA) users, who have been reported to complain about the performance of their devices during background noise and acoustically adverse situations (Bentler et al. Citation1993; Walden et al. Citation2000; Wu Citation2010; Hougaard and Ruf Citation2011). Research on auralisations can offer the means to study HA performance in more realistic sound environments (Compton-Conley et al. Citation2004; Minnaar, Favrot, and Buchholz Citation2010; Mueller et al. Citation2012; Minnaar et al. Citation2013; Grimm, Kollmeier, and Hohmann Citation2016; Cubick and Dau Citation2016). Various sound materials for speech recognition tests that include variations in reverberation have also been developed (Noffsinger, Wilson, and Musiek Citation1994) and are becoming more widely used, for instance, in research on cochlear synaptopathy (Liberman et al. Citation2016; Mepani et al. Citation2020).
In natural reverberant environments, sound arrives at the listener’s ears as a combination of direct sound (DS) followed by early reflections (ERs) from different directions and late reverberation, until the sounds are attenuated below audibility. These reflected and reverberated sounds provide our auditory system with an acoustic background to operate in, and it has been found that we are sensitive to the natural characteristics of reverberation encountered in real environments (Traer and McDermott Citation2016). Studies also indicate that the normally functioning auditory system compensates for influences of reverberation, which can lead to an improvement in speech intelligibility (Beeston, Brown, and Watkins Citation2014; Brandewie and Zahorik Citation2013). Interestingly, this compensation mechanism (or room exposure effect) seems to be dependent on the amount of reverberant sound energy in a room and is suggested to be maximal in moderate reverberation (Zahorik and Brandewie Citation2016).
In a continuous speech, reflected sound waves from different directions overlap with the sound arriving directly from the source, resulting in linear distortions in the perceived signal. Speech is characterised by slow and fast spectrotemporal variations involving continuous (e.g. vowels, fricatives) and transient (e.g. occlusives) sounds (Liberman et al. Citation1967).
Many older studies on speech perception in rooms did not make the distinction between the effects of ERs and late reverberation. For instance, studies by Nabelek and colleagues (Nábĕlek and Dagenais Citation1986; Nabelek Citation1988; Nábĕlek, Letowski, and Tucker Citation1989) indicated that at the level of individual phonemes, reverberation (in general) causes two types of masking effects: “overlap” (or forward)-masking, meaning that a preceding phoneme (vowel, consonant) masks the following phoneme, and “self”-masking, i.e., “internal” temporal smearing that was shown to result in confusion and incorrect identification of individual phonemes. Considering that the time-frame of phonemes is typically short, e.g. occlusives such as /k/ are much less than 50 ms, and vowels and fricatives also only in the range of 100−150 ms, self-masking is probably caused by ERs and overlap-masking by the reverberation tail. ERs and late reverberation may induce such different masking effects. Furthermore, they have also been found to have different, perhaps opposing consequences on speech intelligibility.
ERs have been found to enhance the intelligibility of speech to some extent (Bradley, Reich, and Norcross Citation1999; Bradley, Sato, and Picard Citation2003; Arweiler, Buchholz, and Dau Citation2009). Depending on their delay time, direction and intensity, ERs may not be perceived per se, but their energy can be integrated with the DS due to the precedence effect (Litovsky et al. Citation1999). This process has been found to increase the loudness of DS and improve speech intelligibility (Bradley, Sato, and Picard Citation2003) and has been at least partially observed even at the level of the auditory brainstem (Al Osman, Dajani, and Giguère Citation2017). For speech, the period of integration time is around 50 ms, after which reflections begin to smear and mask the speech signal and reduce its intelligibility (Lochner and Burger Citation1961). In addition, the integration process is not only dependent on the time-delay of the reflections but also their direction (Rennies et al. Citation2014b) and spectral properties (Arweiler and Buchholz Citation2011). In background noise, the precedence effect is at least partially disrupted, as ERs, depending on their properties, are masked by or merged with the interfering noise stream (Soulodre, Popplewell, and Bradley Citation1989; Rouch and Parizet Citation2018).
In contrast to possible improvements of speech intelligibility by ERs, late reverberation has most often been found to adversely affect speech intelligibility in rooms (Steinberg Citation1929; Lochner and Burger Citation1961; Nábĕlek and Robinson Citation1982). When related to the overlap-masking effect mentioned above, late reverberation tends to “fill in” the spectrotemporal dips and gaps in the speech signal and to overlap and smear the intensity modulations (Houtgast and Steeneken Citation1985) that are important to speech intelligibility.
It is worthwhile to note that the effects of reverberation (incl. ERs) act on the signal itself, whereas masking by interfering sounds, such as background noise, can be considered additive and not depending on the energy of the previous sound segments (Nábĕlek, Letowski, and Tucker Citation1989). Nevertheless, reverberation also has important consequences on the interfering noise. According to the “Equalization–Cancellation (E–C)” theory (Durlach Citation1963), binaural hearing eliminates interfering sounds from the target stream by first equalising the masking signals between the two ears as much as possible and then cancelling the interfering signal out from the total signal by subtraction. Because late reverberation effectively decorrelates and reduces the interaural coherence of the interfering noise between the listener’s ears, it makes it more difficult for the hearing system to equalise the signals at the two ears by making the cancellation process less effective, and this way turning the interfering noise to a more efficient masker (Lavandier and Culling Citation2008). Late reverberation is detrimental to speech understanding in noisy situations by basically two mechanisms: it smears the spectrotemporal pattern of the speech signal itself and enhances the effective interference of the masker by reducing its interaural coherence.
Warzybok et al. (Citation2013) studied how the delay and spatial separation of a single reflection (an exact copy of the DS) affected speech recognition thresholds (SRTs) in noise. They found out that in the co-located condition the intelligibility of the speech was worse in a condition where the masker contained the same reflection as the speech than in a condition when only speech but not noise included the reflection. The reflected noise reduced the benefit otherwise obtained from the integration of the ER to the DS. However, when the target speech was accompanied by a reflection, SRTs improved by as much as 4.1 dB in diffuse noise compared to a frontally located noise. They attributed 2.9 dB of this improvement to better-ear listening. This result is somewhat in contrast with the E–C theory (Durlach Citation1963), that late (diffuse) reverberation makes the masking noise less coherent between the ears and therefore a more efficient masker. Thus, while their results indicate that including the same ERs for the masker as for the speech deteriorates speech intelligibility, on the other hand, noise subjected to diffuse late reverberation may result in improvement in intelligibility.
The most used measure to quantify the effects of (full) reverberation and noise on speech intelligibility is the Speech Transmission Index (STI; Houtgast and Steeneken Citation1985). Both reverberation and noise reduce the fluctuations of the speech envelope, and this reduction can be quantified by the modulation transfer function, which is calculated over 14 modulation frequencies (from 0.63 to 12.5 Hz) and seven octave bands from 125 to 8000 Hz. STI can be measured either directly in the room or calculated indirectly from the room impulse responses by considering the sound pressure levels of the signal and the interfering noise as well as the effects of auditory thresholds and masking. Although STI in its basic form does not consider spatial hearing, i.e. the effects of reverberation on the interaural coherence of the masking noise, it has been found to accurately predict speech intelligibility regardless of whether it is disrupted by noise, reverberation or a combination of the two (Duquesnoy and Plomp Citation1980; George et al. Citation2010).
Given the above-mentioned influences of reverberation on speech intelligibility, as well as our sensitivity to the natural characteristics of reverberation (Traer and McDermott Citation2016), it is important to keep reverberation as realistic as possible when applied in hearing diagnostics in clinical work. Virtual acoustics technology has advanced greatly in the last decade, and there are now several virtual acoustic methods that can be used to create real-life like acoustic conditions in the laboratory, that is, to auralize room acoustics. Auralisations can be produced in many ways, for instance, from recordings of real sound scenes (Koski, Sivonen, and Pulkki Citation2013), but most often they are based on room impulse responses (RIRs) generated via room acoustics simulations (Favrot and Buchholz Citation2010; Zahorik Citation2009) or by the measurement of real rooms. Studies have shown a promising correspondence between SRTs in noise obtained in real and virtual sound scenes (Koski, Sivonen, and Pulkki Citation2013; Ahrens, Marschall, and Dau Citation2019), and virtual sound environments have already been used in several studies focussing on the performance of hearing aids (Compton-Conley et al. Citation2004; Minnaar, Favrot, and Buchholz Citation2010; Mueller et al. Citation2012; Minnaar et al. Citation2013; Grimm, Kollmeier, and Hohmann Citation2016; Cubick and Dau Citation2016). However, considering different auralisation techniques in the context of speech perception, Ahrens, Marschall, and Dau (Citation2019) have recently pointed out that the inaccuracies in the modelling of ERs possibly have a large effect on speech intelligibility. This is probably related to the findings that not only the spatio-temporal pattern of ERs (Warzybok et al. Citation2013) but also the spectral characteristics of the reflections influence how ERs are integrated with the DS in speech perception (Arweiler and Buchholz Citation2011). Also, a study by Rennies et al. (Citation2014a) showed that speech recognition performance was influenced by the type of RIRs, that is, whether the used RIR was exponentially decaying white noise, simulated by acoustic modelling or measured in real rooms.
The current study aims to extend a clinically used Finnish speech-in-noise test with auralisations of two real rooms to investigate the effect of reverberation on the SRTs of normal-hearing (NH) and hearing-impaired (HI) listeners. Even just a mild to moderate degree of hearing loss can critically affect speech understanding in noisy conditions (Dubno, Dirks, and Morgan Citation1984). HI listeners who may have decreased acuity in frequency and/or temporal processing of auditory information are known to suffer more from spectral and temporal smearing caused by reverberation than NH counterparts (Duquesnoy and Plomp Citation1980; Nabelek and Mason Citation1981; Helfer and Wilber Citation1990; Neuman et al. Citation2010). Auralisations are based on measured RIRs from real rooms to preserve the natural characteristics of the reverberation as much as possible. Spatial RIRs are measured and produced with the Spatial Decomposition Method (SDM; Tervo et al. Citation2013) and convolved with the (quasi-) anechoic source signals. SDM has been previously used in many perceptual studies of room acoustics ranging from concert halls (e.g. Kuusinen and Lokki Citation2015) and small rooms (Kaplanis et al. Citation2019) to critical listening environments (Tervo et al. Citation2014) to car cabins (Kaplanis et al. Citation2017). Sound materials for the study and a well-established baseline measure are obtained from the Finnish Matrix Sentence Test (FMST) (Dietz et al. Citation2014), which is in use in clinical hearing diagnostics in Finland. The reverberant conditions are kept as similar as possible to the original test to enable a direct comparison between the results and the reference values. In this way, the objective is to establish a solid premise for further development of Finnish speech-in-noise test and to explore the feasibility of our auralisation method in clinical practice.
2. Methods and materials
2.1. Auralisation
depicts an overview of the auralisation process. First, RIRs were measured with the sine-sweep technique (Farina Citation2000) from a source (Genelec model 8020B) to a receiver, which consisted of an array of six microphones (GRAS type 50 VI-1). The source-receiver distance was 1 m, and the source and the receiver were both at a height of 1.2 m from the floor. Second, SDM was applied to the six impulse responses to estimate the directions of arrival of sound waves to the receiver. In SDM, the estimation of directions is performed with a small (approx. 1 ms) sliding window with a 99% overlap. In its current implementation, SDM estimates only one direction per time instant. In the case of two or more sound waves arriving at the receiver simultaneously, the estimation result is the direction which is the most likely according to the impulse response data. When the reflection density rises and the sound field becomes more and more diffuse, the direction estimates also become more or more random. In this way, SDM provides accurate direction estimates for arriving sound waves when the reflection density is sparse, as in the early sound field. Besides, it produces quasi-random direction estimates when the reflection density is higher, as in late reverberation, which is commonly considered diffuse (i.e.,“random”) by definition. Note that SDM estimates the directions of arriving sound waves in three dimensions, and it can be used with arbitrary configurations of reproduction loudspeakers. Here, reproduction loudspeakers in the listening room, illustrated in , were located in the horizontal plane around the listener, and the directional estimates were analysed in relation to this two-dimensional configuration.
Figure 1. Outline of the auralisation procedure (see Section 2.1. for more details). A complete description of the Spatial Decomposition Method (SDM) has been described by Tervo et al. (Citation2013). The panoramic photo of the listening room is adapted from Ojansivu (Citation2017).
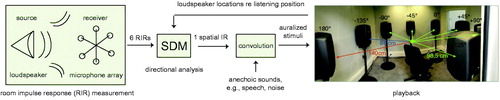
The direction estimates for each sample were used to distribute one RIR (i.e., one pressure signal) from a single omnidirectional microphone to the reproduction loudspeaker channels in the listening room. In this experiment, this reassignment was performed according to the principle of the nearest neighbour, i.e. the sample was assigned to the loudspeaker in the direction closest to the estimated direction for that sample. The distances to the reproduction loudspeakers from the listening position are also taken into account in this process. The nearest neighbour procedure had been observed to produce a minimal amount of spectral colouration in the auralised sound field (Pätynen, Tervo, and Lokki Citation2014). Finally, these spatialised impulse responses were convolved with the sound material from FMST to produce the stimuli for playback.
2.2. Test conditions
FMST (Dietz et al. Citation2014) served as the reference test, and the original condition without reverberation is referred to as “Reference” in the remaining part of the article. Like other similar speech-in-noise tests (Kollmeier et al. Citation2015), FMST contains a 10 by 5 matrix of phonetically balanced words, which are used to produce random and unpredictable non-sense sentences in the structure: name—verb—numeral—adjective—noun. Sentences preserved the natural prosody of the Finnish language and were spoken by a female speaker. The interfering steady-state noise was matched in the spectrum with the long-term average of the speech material. The expected SRTs in noise for NH people is −9.7 ± 0.7 dB signal-to-noise ratio (SNR) in adaptive test procedures (Dietz et al. Citation2014). The test was generally administered in a soundproof room, and the noise level was fixed at 65 dB sound pressure level (SPL). Details of the development and the evaluation of FMST are given by Dietz et al. (Citation2014).
The test was clinically administered by playing back the speech sentences and the masking noise from the same loudspeaker at a distance of 1 m in front of the listener. Because this is the first study to apply the current auralisation method in this context, the reverberant conditions were decided to be kept as comparable to the original test as possible. Therefore, we decided to use the same co-located speech and noise conditions and the same source-receiver distance of one metre in the auralisations to avoid the effects of changing the distance to the source and investigate the effects of added reverberation. In the reverberant conditions, both the target speech and the masking noise were constantly auralised with the same RIR. The following two rooms were selected according to their differences in perceptual acoustic qualities as well as their availability for performing the measurements.
Room 1 is rectangular (approx. 14 m (width, W), 11 m (length, L), 2.5 m (height, H), 385 m3) with glass walls on two sides, brick and plaster on the other two walls, hard floor and a ceiling with acoustic tiles. This space has been used as an internet cafeteria as well as a lecture hall. The measurement position was central, with a minimum of 3 m to each side wall, but tables and chairs were irregularly spaced in the room and around the receiver position. Reverberation time in this space is almost one second across the whole frequency spectrum.
Room 2 is an open, four-level high staircase with brick and plaster walls, glass doors and glass windows (approx. 4.2 m (W), 4.5 m (L), 17 m (H), 321 m3). The measurement position was at the lowest level with an open space above with the ceiling at a height of 17 m. Stairs were on one side while the brick wall was on the other side at ∼0.6 m distance from the receiver. Reverberation time T20 in this space is approximately 1.8 s.
Concerning binaural aspects, a relatively simple binaural measure is the interaural cross correlation coefficient (IACC) that estimates the coherence of early and late sound fields between the ears. The average mid-frequency (500, 1000, 2000 Hz) values of IACC for the early (E3) and late (L3) part of the RIRs in indicate that the early sound field in Room 1 is more coherent than in Room 2. Phenomena like spatial release from masking are more relevant in situations where the target and the masker are at different locations so that there is a clear benefit from binaural processing. In the co-located target and masker condition, both signals contain exactly the same patterns of ERs and late reverberation and thus, also the same binaural cues.
Table 1. T20, C50, IACCE3/L3, STI and D/R values for each room.
The average values of T20, speech clarity index C50, IACC for ERs (0–50 ms) (E3) and late reverberation (50 ms-) (L3), direct-to-reverberant ratio D/R, STI as well as reverberation radius RR are tabulated in . IACC values were calculated by using binaural RIRs rendered with the CIPIC head-related transfer function (HRTF) set number 28 (Algazi et al. Citation2001). The reverberation radius was estimated by, where V is the volume of the room and Q (=3) is the directivity factor of the source. The factor of three was chosen as a compromise between the low and the high frequencies, where the measurement loudspeaker is close to omnidirectional (Q = 1) and highly directive (Q > 6), respectively. Other values in the table are calculated directly from the RIRs used in the auralisations.
2.3. Listening test setup
The listening tests were performed at the Helsinki University Hospital in a sound booth of approx. 2.5 m (W), 2.6 m (L) and 2.1 m (H). A photo of the booth is shown in including the angles and the distances of the eight loudspeakers (Genelec 8050 A) located around the listener in the horizontal plane at ear height. Note that sound was presented only from a single loudspeaker in the frontal direction in the Reference condition, while it was presented from all loudspeakers in the reverberant conditions. The signals were played back from a laptop computer through a high-quality audio interface (RME Fireface 802). The room was not anechoic, so small acoustic effects due to the room were unavoidable. The reverberation time of the room is very short (close to 0.05 s at 500 and 1000 Hz octave bands) and the acoustically treated walls, floor and ceiling are highly absorbent in all but the very lowest frequencies. In practice, the acoustic effects of the listening room can be considered insignificant.
Reference SRTs were measured with the original FMST software. However, to measure SRTs with the auralized conditions, the same test was implemented in Matlab according to the descriptions and definitions of the sentence test measurement protocol given by Brand and Kollmeier (Citation2002) and Dietz et al. (Citation2014). In short, the SRT in noise was estimated by a 1-up/1-down protocol by varying the SNR of the speech and noise signals. The noise level was fixed in the procedure and the multichannel auralisations were summed into mono signals for the derivation of the SNR value. Step size was adaptively changed, and SRT was estimated by the maximum likelihood of the logistic function as defined by Brand and Kollmeier (Citation2002). The length of the adaptive track was fixed to 20 trials (i.e. sentences) as in the original FMST.
To ensure that the original test and our Matlab implementation would yield comparable results, the test was completed with each version four times by two of the authors (in the reference condition). The average differences in SRTs between the two versions were 0.025- and 0.275-dB SNR for the two authors, respectively. There were no signs of any systematic difference one way or another.
In the original FMST, the system is calibrated with a calibration noise signal to 65 dB SPL at the listening position. Because this condition is equivalent to the DS, the reverberant signals were calibrated with the calibration noise convolved only with the DS of the RIRs. DS was extracted by using a 5-ms window starting 1 ms before the maximum peak value of the RIR. For Room 2, this time window included a single strong reflection from the sidewall, but this was practically unavoidable and considered not to be a critical aspect of this study.
The full-length reverberation tail does increase the overall level of auralized signals compared to the reference. To evaluate the possible influence of this level increase due to reverberation, we measured the SPL of the calibration noise convolved with the complete RIRs and compared the result to the DS only condition. We observed an ∼1–2 dB increase in SPL. Considering that SRT values usually do not depend on the absolute presentation levels when noise is clearly audible (H¨orTech gGmbH Citation2018), it is unlikely that these small SPL differences affect the results of this study.
2.4. Participants
On one hand, participants were recruited via social media and anyone could enrol. On the other hand, participants were recruited among the patients of the hearing clinic, who expressed their interest and were considered suitable for the study by the audiologists. Informed consent to participate in the study was obtained from all listeners. The study was approved by the ethical committee of Helsinki University Hospital.
A total of 48 listeners that were composed of 31 women and 17 men aged between 20 and 82 years (with a median of 56 years) were recruited. Participants were tested with the standard pure-tone audiometry if they had not been tested recently in the hospital.
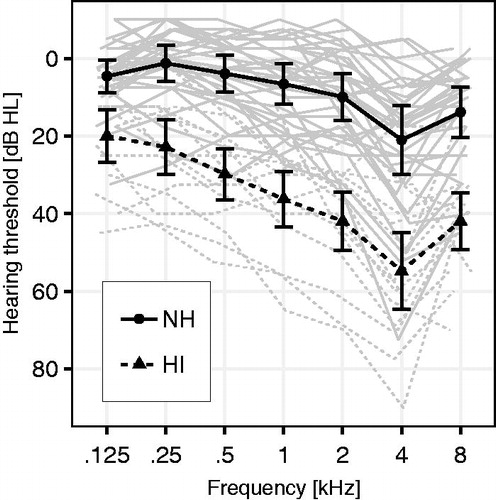
The pure-tone averages (PTAs, averaged over 500, 1000, 2000 and 4000 Hz and both ears) were between −6- and 57-dB hearing level (HL). Fourteen (14) people had a PTA score above 25 dB HL and were grouped as HI. The hearing threshold levels at standard frequencies (averaged over both ears) are depicted in .
Figure 2. Hearing thresholds of all individual participants (grey lines) and the average thresholds of normal-hearing (NH; PTA < 25 dB HL) and hearing-impaired (HI; PTA ≥ 25 dB HL) groups. The pure-tone average (PTA) scores are calculated as the average over both ears and at 500, 1000, 2000 and 4000 Hz frequencies. The individual lines have been horizontally displaced to improve their visibility in the figure.
The distribution of ages in the NH group had a minimum of 20, a maximum of 75, a median of 47 and a mean of 49.15 years. In comparison, the age distribution in the HI group had a minimum of 28, a maximum of 82, a median of 70.5 and a mean of 66.2 years.
Five participants used HA devices, one of whom was practically deaf in the other ear, and wore a hearing device that sent signals from the deaf side to the HA device on the better ear. HA users completed the tests first with their devices set to a setting they most preferred in their normal daily lives. Then, they also completed the tests without using their devices.
It deserves to be noted that the absolute presentation level was not adjusted according to the individual hearing thresholds, not even for individuals with the highest hearing threshold levels. Thus, for individuals with severe sensitivity loss, some speech frequencies may have been below the individual threshold levels when listened without HA, and this may have been reflected in the results.
2.5. Test procedure
Following the clinical guidelines of the FMST, participants first performed two practice runs of 20 sentences each, one with a fixed +10 dB SNR and a second run with the adaptive procedure. These practice runs were performed in the Reference condition, and they served to capture the strongest portion of the training/learning effect so that only minor improvements can be expected from the third run onward as described by Dietz et al. (Citation2014). To further counter the effect of learning in the sequential presentation of the test conditions, the participants performed the actual tests, namely, the Reference, Room 1 and Room 2, in a randomised order.
3. Results
3.1. NH listeners
The results of NH listeners were analysed with a two-way repeated measure analysis of variance (ANOVA). In addition to the test condition, presentation order was included in the analysis to examine the potential learning effect. The assumptions of normality were inspected by quartile-quartile plots of the residuals and by Shapiro–Wilk test, which did not indicate any violations of normality. The requirement for homogeneity of variances between factor levels was also met when tested with Bartlett’s test.
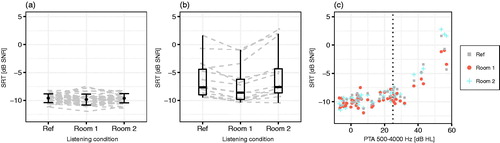
The analysis results indicated no significant differences between the test conditions (F(2,64) = 2.68, p = 0.08). Averages and standard deviations (SDs) are illustrated in Reference: −9.6 dB SNR (SD, 0.8 dB); Room 1: −9.8 dB SNR (SD, 1.0 dB); and Room 2: −9.6 dB SNR (SD, 0.9 dB).
Figure 3. (a) Normal hearing: Averages and standard deviations per test condition. (b) Hearing-impaired: Median and the 25th and 75th percentiles per test condition. Whiskers extend maximally to 1.5 times the inter-quartile range. (c) Pure-tone average (PTA; 500–4000 Hz; both ears) scores plotted against the SRT results for each test condition. The vertical dotted line depicts the 25 dB HL PTA cut-off for normal hearing. Ref: Grey squares; Room 1: Red points; Room 2: Blue crosses.
The analysis results indicated a significant effect of presentation order (F(2,64) = 7.24, p = 0.001). Further, results of Tukey’s post-hoc test indicated a significant difference (p < 0.01) between the first (mean, −9.45 dB SNR; SD, 0.9 dB) and second presentation (mean, −9.84 dB SNR; SD, 0.9 dB), but no difference between the second and third presentation (mean, −9.78 dB SNR; SD, 0.8 dB). The small average improvement of 0.4 dB in the performance observed between the first and later presentations is consistent with that reported with the training effect (Dietz et al. Citation2014). Because the presentation order of the three test conditions was randomised between the listeners, the order effect could be considered to have equal influence in all three conditions.
3.2. HI listeners and HA benefit
HI listeners were, on average, older than NH listeners. It is possible that an age-related decline, for instance, in the suprathreshold auditory processing abilities and/or in cognitive functions, could have an impact on the SRTs (Gordon-Salant and Cole Citation2016). To examine the possibility of such age-related influences on the observed SRTs, we categorised the results of the 14 oldest listeners in the NH group (min age, 49 years; max age, 75 years; median age, 63.5 years; mean age, 63 years) as the “age-matched controls” group and compared the SRTs of these individuals with that of the younger NH listeners (min age, 20 years; max age, 48 years; median age, 42 years; mean age, 39 years). The overall results concerning the differences between the test conditions remained practically the same between these two groups; results of one-way ANOVA comparing the SRTs in the reference test condition also did not indicate significant differences between the two groups (F(1,32) = 3.42, p = 0.07).
The SRT results of the HI group did not comply with the assumptions of parametric ANOVA test. A commonly used non-parametric alternative for repeated measures ANOVA is Friedman’s test, but it can only handle one variable at a time. However, it is possible to rank-transform the data and use a linear mixed effects model with listeners as a random factor (Baguley Citation2012); this approach was used as a proxy for repeated measures ANOVA. The analysis results indicated that differences between the test conditions were significant (F(2,24) = 17.15, p < 0.001), while the differences because of presentation order were not significant (F(2,24) = 3.05, p = 0.07). Applying the mixed effects model also allowed for post-hoc examination, which confirmed that SRTs for Room 1 were significantly lower (p < 0.001) than that for Reference and Room 2; The results also confirmed that there was no significant difference between Reference and Room 2 (p = 0.9). depicts the medians with 25% and 75% percentiles. The median values were as follows: Reference, −7.65 dB SNR; Room 1, −8.64 dB SNR; and Room 2, −7.63 dB SNR. The effect of presentation order was also inspected visually; a systematic pattern of improvement across presentation orders was not observed.
depicts the association between the PTAs (500–4000 Hz) and SRTs. This association is interesting as it might predict speech recognition performance in noise with the pure-tone thresholds. For HI participants (PTA ≥ 25 dB HL), the association between PTAs and SRTs was captured by Spearman’s rank correlation coefficient, with values of 0.73, 0.77 and 0.69 for Reference, Rooms 1, and 2, respectively. In comparison, for NH participants (PTA < 25 dB HL), the coefficients of determination, r2, between PTAs and SRTs were 0.25, 0.16 and 0.25, respectively.
Finally, we analysed the possible HA benefit for the five individuals who performed the tests with and without their hearing aids. In the test, they set their devices to the operation mode that they most commonly used on a day-to-day basis. illustrates the differences in SRTs between the test results obtained with and without the use of a HA. Clearly, there are large differences between individuals, and in the best case, maximal benefit of up to 9 dB SNR can be obtained.
Figure 4. Hearing aid benefits per individual and test condition.
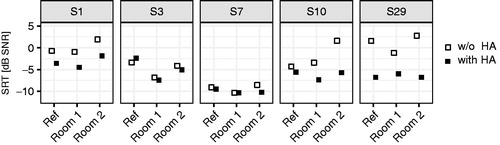
On investigating these individuals (all women) more closely, subject S1 (77-year-old woman with a PTA of 56 dB HL) seems to have largely benefitted from her HAs (bilateral fitting, receiver-in-canal [RIC] device), with a similar improvement in SRT in all test conditions. S3 (69-year-old woman with a PTA of 43 dB HL; bilateral, RIC), in contrast, had extremely limited benefit from her devices, as did S7 (58-year-old woman with a PTA of 26 dB HL; bilateral, RIC).
However, the results of S10 (82-year-old woman with a PTA of 57 dB HL) are interesting because in her data, we can observe both the influence of reverberation (w/o HA: Room 2) and the major benefit of using her HA (bilateral, RIC), which indicates that this benefit is the greatest in Room 2. Although this effect was only observed in a single listener, it indicated that auralisations may be useful in revealing and evaluating the benefits of HAs in real-life acoustic conditions, because a similar extent of benefit was not shown in the Reference test.
S29 (52-year-old woman with a PTA of 54 dB HL) was practically deaf in one ear and wore a contralateral routeing of signals (CROS)-device, which transmits the sounds arriving at the deaf ear side to the hearing ear via a Bluetooth connection (left ear: FM transmitter; right ear: RIC). Thus, as expected, her data showed tremendous benefit following the use of HAs, which reduced SRT scores to below −5 dB SNR.
4. Discussion
This experiment explored the influence of reverberation on SRTs in noise conditions by adding spatially distributed reverberation to the test stimuli in the FMST. Except for the added reverberation, the test conditions were kept as similar as possible to the original test to allow for a direct comparison between the present results and results from already published studies.
For NH listeners, reverberation did not result in significant differences in SRTs, and the results are in line with the expectation of −9.7 dB SNR with SD of 0.7 dB given by Dietz et al. (Citation2014). Nevertheless, many studies (Steinberg Citation1929; Lochner and Burger Citation1961; Nábĕlek and Robinson Citation1982; Nábĕlek and Dagenais Citation1986; Nábĕlek, Letowski, and Tucker Citation1989; Payton, Uchanski, and Braida Citation1994; Koehnke and Besing Citation1996; Neuman et al. Citation2010) have shown that reverberation makes speech recognition more difficult. These studies have been mostly conducted with source-listener distances that are beyond the critical distance in the room and therefore in the reverberant field.
Thus, the apparent discrepancy between the present and previous results may be due to the differences in the distance between the source and the listener and consequently due to the differences in the balance between the DS and late reverberation.
At a close distance, DS dominates, and late reverberation does not affect speech intelligibility as much as that at greater distances, where intelligibility is dependent mainly on the amount of late reverberant sound energy (Peutz Citation1971). Bradley, Reich, and Norcross (Citation1999) observed the detrimental effect of increased reverberation on speech intelligibility only with smaller C50 values, that is, in conditions with more reverberant sound energy. In the conditions with relatively less reverberation and C50 values in the same range as in this study, there was no effect of reverberation on speech intelligibility. Moreover, in a study by Klatte, Lachmann, and Meis (Citation2010) using two virtual classrooms, the effect of reverberation was apparent only in locations further away from the source. The current results are also in line with the results reported by Beutelmann and Brand (Citation2006) who did not find significant differences in SRTs in noise between an anechoic chamber, an office space (RT 0.6 s) and an empty cafeteria hall (RT 1.3 s) in a co-located condition.
Another probable reason for the lack of differences between the test conditions for NH listeners is the decision to follow the clinical guidelines of FMST and to target the 50% recognition rate. At the level of 50% of SRT, the SNR in FMST is expected to be as low as −9.7 dB for NH listeners. At such a low SNR level, reverberation may not have any effect on recognition performance because its effects are masked by the noise. illustrates the reductions in modulation depth at different modulation frequencies by depicting the modulation transfer ratios (MTRs) at different SNR levels. MTRs form the basis for calculating the STI. These calculations are made with the functions provided in the AARAE toolbox by Cabrera, Jimenez, and Martens (Citation2014a; Cabrera et al. Citation2014b), and they are based on RIRs and octave band SPLs of the speech and the interfering noise signals. RIRs are used to derive the modulation transfer functions (MTFs), and octave band SPLs are used to estimate the effects of SNR, auditory masking and auditory thresholds on the MTF. SPLs are derived computationally using the standard 20 µPa as the reference SPL value, and they are not based on actual measurements.
Figure 5. Modulation transfer ratios for each room and SNRs of 0, −5 and −10 dB. The values are calculated by using RIRs and a single randomly selected sentence from the Finnish Matrix Sentence Test.
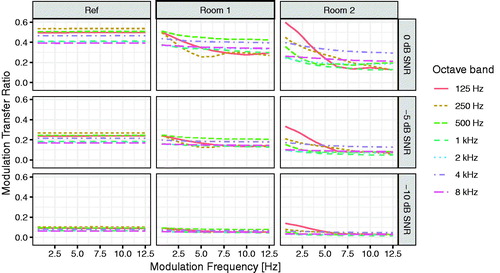
Considering speech modulations at different frequencies, the influences of reverberation and reflections are typically manifested in MTRs as sloping or “bumpy” patterns that depend on the reverberation characteristics. Often the effect is observed in the lowest octave bands (125 and 250 Hz) as in at 0 and −5 dB SNR.
In contrast, an increase in relative noise levels result in a linear reduction of MTRs across the whole range of modulation frequencies and octave bands (Houtgast and Steeneken Citation1985) as shown in in the leftmost panel (i.e., Reference). In both reverberant conditions, the influences of reverberation and reflections are apparent at 0 dB SNR. However, at lower SNR levels, these influences decrease, and at −10 dB SNR, the MTRs show only little variation across the frequencies. If one were to zoom in the figure, the presence of reverberation even at lower SNRs could be observed, but the relative influences are very small compared with the 0 dB SNR level. Thus, the lower the SNR is, the less we may expect to observe the influence of reverberation on speech intelligibility. Considering that most of our daily speech communication happens with people directly in front and at SNRs between 0 and 10 dB (mean around 4 dB) (Wu et al. Citation2018), it would be “ecologically” more valid to study the influence of reverberation on speech recognition at higher SNR levels. The presented results are consistent with this observation.
Association between SRTs and PTA scores illustrated in indicated that more positive SRTs in noise are associated with increased PTAs. In line with previous studies that also investigated SRTs in noise (Bosman and Smoorenburg Citation1995; Smits, Kapteyn, and Houtgast Citation2004), the strength of correlations was moderate (r2s between 0.25 and 0.3) for NH listeners. In the HI data with higher PTA scores (>25 dB HL), the Spearman’s rank correlations were between 0.69 and 0.77 indicating a stronger association.
It is also interesting that among the 14 individuals who were categorised as HI, seven listeners produced reference SRT scores below −7.6 dB SNR. These scores are within 3 SDs from the previously reported −9.7 dB SNR for NH listeners, and in a normally distributed data, 99.7% of samples lie within this range. Considering speech recognition abilities measured with the FMST, these individuals could be regarded as NH. These data highlight the importance of employing multiple measures in determining the severity and the functional consequences of hearing impairment.
The results of HI listeners also showed significantly better speech recognition performance in Room 1 than in Reference and Room 2. This observation is difficult to explain, but it is perhaps associated with ERs, which are known to be beneficial for speech recognition (Bradley, Sato, and Picard Citation2003). HI listeners require higher SNRs, which also results in an increased level of ERs and reverberation. At this higher SNR, ERs may now become helpful and result in an observable difference between Room 1 and Reference. Although there are also strong ERs present in Room 2, their effect may be counteracted by the detrimental effect of late reverberation that is much stronger in Room 2 than in Room 1. There is evidence that hearing impairment does not affect the benefit that is normally gained with ERs (Bradley, Sato, and Picard Citation2003; Arweiler and Buchholz Citation2011). Thus, it is possible that the benefit of ERs was only observed with HI listeners due to the increased SNR. As mentioned, the relatively higher level of masking noise at lower SNR levels can render the effects and the possible benefits of ERs negligible for NH listeners.
An alternative or complementary explanation for the observed advantage of Room 1 over the other conditions is that in speech perception the human auditory system has been found to compensate for reverberation (Brandewie and Zahorik Citation2013; Zahorik and Brandewie Citation2016). This compensation mechanism has been suggested to be the most efficient for moderate reverberation times (Zahorik and Brandewie Citation2016).
Considering research on HAs, virtual sound scenes have already been used in several studies (Compton-Conley et al. Citation2004; Minnaar, Favrot, and Buchholz Citation2010; Mueller et al. Citation2012; Minnaar et al. Citation2013; Grimm, Kollmeier, and Hohmann Citation2016; Cubick and Dau Citation2016). Results have been promising, and here we showed that in some cases auralisations can provide information that is not obtained with stimuli that do not contain the influences of room acoustics. Thus, auralisations/virtual sound scenes are a useful and viable approach for the development of novel diagnostic tools for clinical work in many ways.
Overall, this study indicates that the influence of reverberation to speech recognition in noise may be better investigated with greater source-listener distances and/or more complex sound scenes and also by targeting SRTs at higher SNR levels (e.g. 80%), where the effects of reverberation are not so heavily masked by the noise. With this premise, it appears reasonable to explore scenarios with greater source-receiver distances and acoustic scenes with multiple interfering sound sources in the future development of speech-in-noise tests.
5. Conclusions
For NH listeners, there were no significant differences in SRTs between the reverberant conditions and the reference test. Unexpectedly, reverberation did not result in a decrease in speech recognition performance even in the 1.8 s reverberation time, but this can be explained by the combination of a short distance between the sound source and the listener, the colocation of speech and masking noise and the decision to target the 50% recognition rate in the SRT measurement resulting in a low SNR level around −10 dB. The relatively high level of noise compared to speech probably reduced the depth of speech modulations so heavily that the effect of reverberation was practically insignificant at this SNR. Therefore, it may be concluded that the influence of reverberation can be better studied at higher SNRs, for instance, by SRT corresponding to 80% recognition performance. In contrast, the results of HI listeners indicated significantly better performance in Room 1 with a 0.9-s reverberation time than in the conditions with an 1.8 s reverberation time or no reverberation. The reason for this result is unclear, but this is possibly associated with the benefit obtained from ERs and/or a compensation mechanism by the human auditory system of moderate reverberation.
Acknowledgments
Thanks to all participants and the personnel at the Helsinki University Hospital, who made it possible to carry out this research. We also would like to thank the anonymous reviewers for their invaluable input and suggestions to the final version of this article.
Declaration of interest
None
Data availability statement
The data that support the findings of this study are available on request from the corresponding author, A.K. The data are not publicly available due to the nature of this study.
Additional information
Funding
References
- Ahrens, Axel, Marton Marschall, and Torsten Dau. 2019. “Measuring and Modeling Speech Intelligibility in Real and Loudspeaker-Based Virtual Sound Environments.” Hearing Research 377: 307–317. doi:10.1016/j.heares.2019.02.003.
- Al Osman, Rida, Hilmi Dajani, and Christian Giguère. 2017. “Self-Masking and Overlap-Masking from Reverberation Using the Speech-Evoked Auditory Brainstem Response.” The Journal of the Acoustical Society of America 142 (6): EL555–EL560. doi:10.1121/1.5017522.
- Algazi, Ralph, Richard Duda, Dennis Thompson, and Carlos Avendano. 2001. “The cipic hrtf database.” Proceedings of the 2001 IEEE Workshop on the Applications of Signal Processing To Audio and Acoustics (Cat. No. 01TH8575), 99–102. IEEE. doi:10.1109/ASPAA.2001.969552.
- Arweiler, Iris, and Jörg Buchholz. 2011. “The Influence of Spectral Characteristics of Early Reflections on Speech Intelligibility.” Journal of the Acoustical Society of America 130 (2): 996–1005. doi:10.1121/1.3609258.
- Arweiler, Iris, Jörg Buchholz, and Torsten Dau. 2009. “Speech Intelligibility Enhancement by Early Reflections.” Proceedings of the International Symposium on Auditory and Audiological Research.” Vol. 2, 289–298.
- Baguley, Thomas. 2012. “Serious Stats: A Guide to Advanced Statistics for the Behavioral Sciences.” London, UK: Macmillan International Higher Education.
- Beeston, Amy, Guy Brown, and Anthony Watkins. 2014. “Perceptual Compensation for the Effects of Reverberation on Consonant Identification: Evidence from Studies with Monaural Stimuli.” The Journal of the Acoustical Society of America 136 (6): 3072–3084. doi:10.1121/1.4900596.
- Bentler, Ruth, Diane Niebuhr, Janet Getta, and Charles Anderson. 1993. “Longitudinal Study of Hearing Aid Effectiveness. II: Subjective Measures.” Journal of Speech and Hearing Research 36 (4): 820–831. doi:10.1044/jshr.3604.820.
- Beutelmann, Rainer, and Thomas Brand. 2006. “Prediction of Speech Intelligibility in Spatial Noise and Reverberation for Normal-Hearing and Hearing-Impaired Listeners.” The Journal of the Acoustical Society of America 120 (1): 331–342. doi:10.1121/1.2202888.
- Bosman, A. J., and G. F. Smoorenburg. 1995. “Intelligibility of Dutch CVC Syllables and Sentences for Listeners with Normal Hearing and with Three Types of Hearing Impairment.” Audiology : official Organ of the International Society of Audiology 34 (5): 260–284. doi:10.3109/00206099509071918.
- Bradley, John, Rebecc Reich, and Scott Norcross. 1999. “On the Combined Effects of Signal-to-Noise Ratio and Room Acoustics on Speech Intelligibility.” The Journal of the Acoustical Society of America 106 (4 Pt 1): 1820–1828. doi:10.1121/1.427932.
- Bradley, John, Hiroshi Sato, and Michel Picard. 2003. “On the Importance of Early Reflections for Speech in Rooms.” The Journal of the Acoustical Society of America 113 (6): 3233–3244. doi:10.1121/1.1570439.
- Brand, Thomas, and Birger Kollmeier. 2002. “Efficient Adaptive Procedures for Threshold and Concurrent Slope Estimates for Psychophysics and Speech Intelligibility Tests.” The Journal of the Acoustical Society of America 111 (6): 2801–2810. doi:10.1121/1.1479152.
- Brandewie, Eugene, and Pavel Zahorik. 2013. “Time Course of a Perceptual Enhancement Effect for Noise-Masked Speech in Reverberant Environments.” The Journal of the Acoustical Society of America 134 (2): EL265–EL270. doi:10.1121/1.4816263.
- Bronkhorst, Adelbert, and Reinier Plomp. 1990. “A Clinical Test for the Assessment of Binaural Speech Perception in Noise.” Audiology 29 (5): 275–285. doi:10.3109/00206099009072858.
- Cabrera, Densil, Daniel Jimenez, and William Martens. 2014a. “Audio and Acoustical Response Analysis Environment (AARAE): a tool to support education and research in acoustics.” INTER-NOISE and NOISE-CON Congress and Conference Proceedings, 1667–1676. Institute of Noise Control Engineering.
- Cabrera, Densil, Doheon Lee, Glenn Leembruggen, and Daniel Jimenez. 2014b. “Increasing Robustness in the Calculation of the Speech Transmission Index from Impulse Responses.” Building Acoustics 21 (3): 181–198. doi:10.1260/1351-010X.21.3.181.
- Compton-Conley, Cynthia, Arlene Neuman, Mead Killion, and Harry Levitt. 2004. “Performance of Directional Microphones for Hearing Aids: Real-World versus Simulation.” Journal of the American Academy of Audiology 15 (6): 440–445. doi:10.3766/jaaa.15.6.5.
- Cubick, Jens, and Torsten Dau. 2016. “Validation of a Virtual Sound Environment System for Testing Hearing Aids.” Acta Acustica United with Acustica 102 (3): 547–557. doi:10.3813/AAA.918972.
- Dietz, Aarno, Michael Buschermöhle, Antti A. Aarnisalo, Annukka Vanhanen, Taneli Hyyrynen, Olli Aaltonen, Heikki Löppönen, Melanie A. Zokoll, and Birger Kollmeier. 2014. “The Development and Evaluation of the Finnish Matrix Sentence Test for Speech Intelligibility Assessment.” Acta Oto-Laryngologica 134 (7): 728–737. doi:10.3109/00016489.2014.898185.
- Dubno, Judy, Donald Dirks, and Donald Morgan. 1984. “Effects of Age and Mild Hearing Loss on Speech Recognition in Noise.” Journal of the Acoustical Society of America 76 (1): 87–96. doi:10.1121/1.391011.
- Duquesnoy, A. J., and Reinier Plomp. 1980. “Effect of Reverberation and Noise on the Intelligibility of Sentences in Cases of Presbyacusis.” Journal of the Acoustical Society of America 68 (2): 537–544. doi:10.1121/1.384767.
- Durlach, Nathaniel. 1963. “Equalization and Cancellation Theory of Binaural Masking-Level Differences.” Journal of the Acoustical Society of America 35 (8): 1206–1218. doi:10.1121/1.1918675.
- Farina, Angelo. 2000. “Simultaneous measurement of impulse response and distortion with a swept-sine technique.” In Audio Engineering Society Convention 108, Paris, France, Feb. 19–22, Audio Engineering Society. http://www.aes.org/e-lib/browse.cfm?elib=10211
- Favrot, Sylvain, and Jörg Buchholz. 2010. “LoRA: A Loudspeaker-Based Room Auralization System.” Acta Acustica United with Acustica 96 (2): 364–375. doi:10.3813/AAA.918285.
- George, Erwin, Theo Goverts, Joost Festen, and Tammo Houtgast. 2010. “Measuring the Effects of Reverberation and Noise on Sentence Intelligibility for Hearing-Impaired Listeners.” Journal of Speech, Language, and Hearing Research 53 (6): 1429–1439. doi:10.1044/1092-4388(2010/09-0197). doi:10.1044/1092-4388(2010/09-0197).
- gGmbH, HörTech. 2018. Finnish Matrix Test - Manual of audio CD for research & development.
- Gordon-Salant, Sandra, and Stacey Samuels Cole. 2016. “Effects of Age and Working Memory Capacity on Speech Recognition Performance in Noise among Listeners with Normal Hearing.” Ear and Hearing 37 (5): 593–602. doi:10.1097/AUD.0000000000000316.
- Grimm, Giso, Birger Kollmeier, and Volker Hohmann. 2016. “Spatial Acoustic Scenarios in Multichannel Loudspeaker Systems for Hearing Aid Evaluation.” Journal of the American Academy of Audiology 27 (7): 557–566. doi:10.3766/jaaa.15095.
- Hagerman, Björn. 1982. “Sentences for Testing Speech Intelligibility in Noise.” Scandinavian Audiology 11 (2): 79–87. doi:10.3109/01050398209076203.
- Helfer, Karen, and Laura Wilber. 1990. “Hearing Loss, Aging, and Speech Perception in Reverberation and Noise.” Journal of Speech and Hearing Research 33 (1): 149–155. doi:10.1044/jshr.3301.149.
- Hougaard, Søren, and Stefan Ruf. 2011. “EuroTrak I: A Consumer Survey about Hearing Aids in Germany, France and the UK.” Hearing Review 18 (2): 12–28.
- Houtgast, Tammo, and Herman Steeneken. 1985. “A Review of the MTF Concept in Room Acoustics and Its Use for Estimating Speech Intelligibility in Auditoria.” Journal of the Acoustical Society of America 77 (3): 1069–1077. doi:10.1121/1.392224.
- Pätynen Jukka, Tervo Sakari, and Lokki Tapio. 2014. Amplitude Panning Decreases Spectral Brightness with Concert Hall Auralizations.” in Audio Engineering Society Conference: 55th International Conference: Spatial Audio, Aug. http://www.aes.org/e-lib/browse.cfm?elib=17373.
- Kaplanis, Neofytos, Søren Bech, Tapio Lokki, Toon van Waterschoot, and Søren Holdt Jensen. 2019. “Perception and Preference of Reverberation in Small Listening Rooms for Multi-Loudspeaker Reproduction.” Journal of the Acoustical Society of America 146 (5): 3562–3576. doi:10.1121/1.5135582.
- Kaplanis, Neofytos, Søren Bech, Sakari Tervo, Jukka Pätynen, Tapio Lokki, Toon van Waterschoot, and Søren Holdt Jensen. 2017. “Perceptual Aspects of Reproduced Sound in Car Cabin Acoustics.” Journal of the Acoustical Society of America 141 (3): 1459–1469. doi:10.1121/1.4976816.
- Klatte, Maria, Thomas Lachmann, and Markus Meis. 2010. “Effects of Noise and Reverberation on Speech Perception and Listening Comprehension of Children and Adults in a Classroom-like Setting.” Noise & Health 12 (49): 270–282. doi:10.4103/1463-1741.70506.
- Koehnke, Janet, and Joan Besing. 1996. “A Procedure for Testing Speech Intelligibility in a Virtual Listening Environment.” Ear and Hearing 17 (3): 211–217. doi:10.1097/00003446-199606000-00004.
- Kollmeier, Birger, Anna Warzybok, Sabine Hochmuth, Melanie Zokoll, Verena Uslar, Thomas Brand, and Kirsten Wagener. 2015. “The Multilingual Matrix Test: Principles, Applications, and Comparison across Languages: A Review.” International Journal of Audiology 54 (sup2): 3–16. doi:10.3109/14992027.2015.1020971.
- Kollmeier, Birger, and Matthias Wesselkamp. 1997. “Development and Evaluation of a German Sentence Test for Objective and Subjective Speech Intelligibility Assessment.” The Journal of the Acoustical Society of America 102 (4): 2412–2421. doi:10.1121/1.419624.
- Koski, Teemu, Ville Sivonen, and Ville Pulkki. 2013. “Measuring Speech Intelligibility in Noisy Environments Reproduced with Parametric Spatial Audio.” Audio Engineering Society Convention 135: Paper 8952.
- Kuusinen, Antti, and Tapio Lokki. 2015. “Investigation of Auditory Distance Perception and Preferences in Concert Halls by Using Virtual Acoustics.” Journal of the Acoustical Society of America 138 (5): 3148–3159. doi:10.1121/1.4935388.
- Lavandier, Mathieu, and John F. Culling. 2008. “Speech Segregation in Rooms: Monaural, Binaural, and Interacting Effects of Reverberation on Target and Interferer.” The Journal of the Acoustical Society of America 123 (4): 2237–2248. doi:10.1121/1.2871943.
- Liberman, A. M., F. S. Cooper, D. P. Shankweiler, and M. Studdert-Kennedy. 1967. “Perception of the Speech Code.” Psychological Review 74 (6): 431–461. doi:10.1037/h0020279.
- Liberman, Charles, Michael Epstein, Sandra Cleveland, Haobing Wang, and Stéphane Maison. 2016. “Toward a Differential Diagnosis of Hidden Hearing Loss in Humans.” Plos ONE 11 (9): e0162726. doi:10.1371/journal.pone.0162726.
- Litovsky, Ruth, Steven Colburn, William Yost, and Sandra Guzman. 1999. “The Precedence Effect.” Journal of the Acoustical Society of America 106 (4 Pt 1): 1633–1654. doi:10.1121/1.427914.
- Lochner, J. P. A., and J. F. Burger. 1961. “The Intelligibility of Speech under Reverberant Conditions.” Acta Acustica United with Acustica 11 (4): 195–200.
- Mepani, Anita M., Sarah A. Kirk, Kenneth E. Hancock, Kara Bennett, Victor de Gruttola, M. Charles Liberman, and Stéphane F. Maison. 2020. “Middle Ear Muscle Reflex and Word Recognition in “Normal-Hearing” Adults: Evidence for Cochlear Synaptopathy??” Ear and Hearing 41 (1): 25–38. doi:10.1097/AUD.0000000000000804.
- Middelweerd, M. J., J. M. Festen, and R. Plomp. 1990. “Difficulties with speech intelligibility in Noise in Spite of a Normal Pure-Tone Audiogram.” Audiology 29 (1): 1–7. doi:10.3109/00206099009081640.
- Minnaar, Pauli, Sylvain Favrot, and Jörg Buchholz. 2010. “Improving Hearing Aids through Listening Tests in a Virtual Sound Environment.” The Hearing Journal 63 (10): 40–42. doi:10.1097/01.HJ.0000389926.64797.3e.
- Minnaar, Pauli, Signe Frølund Albeck, Christian Stender Simonsen, Boris Søndersted, Sebastian Alex Dalgas Oakley, and Jesper Bennedbaek. 2013. “Reproducing Real-Life Listening Situations in the Laboratory for Testing Hearing Aids.” Audio Engineering Society Convention. http://www.aes.org/e-lib/browse.cfm?elib=17001.
- Mueller, Martin, Andrea Kegel, Steven Schimmel, Norbert Dillier, and Markus Hofbauer. 2012. “Localization of Virtual Sound Sources with Bilateral Hearing Aids in Realistic Acoustical Scenes.” Journal of the Acoustical Society of America 131 (6): 4732–4742. doi:10.1121/1.4705292.
- Nábĕlek, A. K., and P. A. Dagenais. 1986. “Vowel Errors in Noise and in Reverberation by Hearing-Impaired Listeners.” Journal of the Acoustical Society of America 80 (3): 741–748. doi:10.1121/1.393948.
- Nábĕlek, A. K., T. R. Letowski, and F. M. Tucker. 1989. “Reverberant overlap- and self-masking in consonant identification.” Journal of the Acoustical Society of America 86 (4): 1259–1265. doi:10.1121/1.398740.
- Nábĕlek, A. K., and P. K. Robinson. 1982. “Monaural and Binaural Speech Perception in Reverberation for Listeners of Various Ages.” Journal of the Acoustical Society of America 71 (5): 1242–1248. doi:10.1121/1.387773.
- Nabelek, Anna. 1988. “Identification of Vowels in Quiet, Noise, and Reverberation: Relationships with Age and Hearing Loss.” Journal of the Acoustical Society of America 84 (2): 476–484. doi:10.1121/1.396880.
- Nabelek, Anna, and David Mason. 1981. “Effect of Noise and Reverberation on Binaural and Monaural Word Identification by Subjects with Various Audiograms.” Journal of Speech and Hearing Research 24 (3): 375–383. doi:10.1044/jshr.2403.375.
- Neuman, Arlene, Marcin Wroblewski, Joshua Hajicek, and Adrienne Rubinstein. 2010. “Combined Effects of Noise and Reverberation on Speech Recognition Performance of Normal-Hearing Children and Adults.” Ear and Hearing 31 (3): 336–344. doi:10.1097/AUD.0b013e3181d3d514.
- Noffsinger, Douglas, Richard Wilson, and Frank Musiek. 1994. “Department of Veterans Affairs Compact Disc Recording for Auditory Perceptual Assessment: Background and Introduction.” Journal of the American Academy of Audiology 5 (4): 231–235.
- Ojansivu, Tuukka. 2017. “Realistinen ¨äaniymp¨aris¨o kuulontutkimuksiin (engl. A realistic listening environment for audiometry).” Bachelor Thesis, Metropolia University of Applied Sciences https://www.theseus.fi/bitstream/handle/10024/125480/Ojansivu.Tuukka.pdf.
- Payton, Karen, Rosalie Uchanski, and Louis Braida. 1994. “Intelligibility of Conversational and Clear Speech in Noise and Reverberation for Listeners with Normal and Impaired Hearing.” The Journal of the Acoustical Society of America 95 (3): 1581–1592. doi:10.1121/1.408545.
- Peutz, Victor. 1971. “Articulation Loss of Consonants as a Criterion for Speech Transmission in a Room.” Journal of the Audio Engineering Society 19 (11): 915–919.
- Plomp, Reinier, and A. M. Mimpen. 1979. “Improving the Reliability of Testing the Speech Reception Threshold for Sentences.” Audiology 18 (1): 43–52. doi:10.3109/00206097909072618.
- Rennies, Jan, Henning Schepker, Inga Holube, and Birger Kollmeier. 2014a. “Listening Effort and Speech Intelligibility in Listening Situations Affected by Noise and Reverberation.” Journal of the Acoustical Society of America 136 (5): 2642–2653. doi:10.1121/1.4897398.
- Rennies, Jan, Anna Warzybok, Thomas Brand, and Birger Kollmeier. 2014b. “Modeling the Effects of a Single Reflection on Binaural Speech Intelligibility.” Journal of the Acoustical Society of America 135 (3): 1556–1567. doi:10.1121/1.4863197.
- Rouch, Jérémy, and Étienne Parizet. 2018. “The Influence of an Early Reflection upon Speech Intelligibility in the Presence of a Background Noise.” Acta Acustica United with Acustica 104 (4): 668–630. doi:10.3813/AAA.919206.
- Smits, Cas, Theo Kapteyn, and Tammo Houtgast. 2004. “Development and Validation of an Automatic Speech-in-Noise Screening Test by Telephone.” International Journal of Audiology 43 (1): 15–28. doi:10.1080/14992020400050004.
- Soulodre, G. A., N. Popplewell, and J. S. Bradley. 1989. “Combined Effects of Early Reflections and Background Noise on Speech Intelligibility.” Journal of Sound and Vibration 135 (1): 123–133. doi:10.1016/0022-460X. (89)90759-1 doi:10.1016/0022-460X(89)90759-1.
- Steinberg, John. 1929. “Effects of Distortion upon the Recognition of Speech Sounds.” Journal of the Acoustical Society of America 1 (1): 121–137. doi:10.1121/1.1901878.
- Tervo, Sakari, Perttu Laukkanen, Jukka Pätynen, and Tapio Lokki. 2014. “Preferences of Critical Listening Environments among Sound Engineers.” Journal of the Audio Engineering Society 62 (5): 300–314. doi:10.17743/jaes.2014.0022.
- Tervo, Sakari, Jukka Pätynen, Antti Kuusinen, and Tapio Lokki. 2013. “Spatial decomposition method for room impulse responses.” Journal of the Audio Engineering Society, 61 (1/2): 17–28.
- Traer, James, and Josh McDermott. 2016. “Statistics of Natural Reverberation Enable Perceptual Separation of Sound and Space.” Proceedings of the National Academy of Sciences of the United States of America 113 (48): E7856–E7865. doi:10.1073/pnas.1612524113.
- Versfeld, Niek, Laura Daalder, Joost Festen, and Tammo Houtgast. 2000. “Method for the Selection of Sentence Materials for Efficient Measurement of the Speech Reception Threshold.” The Journal of the Acoustical Society of America 107 (3): 1671–1684. doi:10.1121/1.428451.
- Walden, Brian, Rauna Surr, Mary Cord, Brent Edwards, and Laurel Olson. 2000. “Comparison of Benefits Provided by Different Hearing Aid Technologies.” Journal of the American Academy of Audiology 11 (10): 540–560.
- Warzybok, Anna, Jan Rennies, Thomas Brand, Simon Doclo, and Birger Kollmeier. 2013. “Effects of Spatial and Temporal Integration of a Single Early Reflection on Speech Intelligibility.” Journal of the Acoustical Society of America 133 (1): 269–282. doi:10.1121/1.4768880.
- Wu, Yu-Hsiang. 2010. “Effect of Age on Directional Microphone Hearing Aid Benefit and Preference.” Journal of the American Academy of Audiology 21 (2): 78–89. doi:10.3766/jaaa.21.2.3.
- Wu, Yu-Hsiang, Elizabeth Stangl, Octav Chipara, Syed Shabih Hasan, Anne Welhaven, and Jacob Oleson. 2018. “Characteristics of Real-World Signal to Noise Ratios and Speech Listening Situations of Older Adults with Mild to Moderate Hearing Loss.” Ear and Hearing 39 (2): 293–304. doi:10.1097/AUD.0000000000000486.
- Zahorik, Pavel. 2009. “Perceptually Relevant Parameters for Virtual Listening Simulation of Small Room Acoustics.” Journal of the Acoustical Society of America 126 (2): 776–791. doi:10.1121/1.3167842.
- Zahorik, Pavel, and Eugene Brandewie. 2016. “Speech Intelligibility in Rooms: Effect of Prior Listening Exposure Interacts with Room Acoustics.” Journal of the Acoustical Society of America 140 (1): 74–86. doi:10.1121/1.4954723.