
 ?Mathematical formulae have been encoded as MathML and are displayed in this HTML version using MathJax in order to improve their display. Uncheck the box to turn MathJax off. This feature requires Javascript. Click on a formula to zoom.
Abstract
Objective
To determine if tinnitus was related to working memory (WM) in adults and if tinnitus handicap was related to WM in adults with tinnitus.
Design
Two groups, cross-sectional design.
Study samples
76 adults forming a tinnitus group (n = 38) and a control group (n = 38). Each group included 19 adults with normal hearing and 19 adults with hearing loss matched for age, sex and educational backgrounds. All participants completed the visual n-back test; pure tone audiometry (0.125–16 kHz); and the Hospital Anxiety and Depression Scale (HADS). Tinnitus sufferers also completed the Tinnitus Handicap Inventory (THI).
Results
For all participants, tinnitus was not related to WM scores when corrected for hearing thresholds, anxiety, and depression. The corrections for best ear high-frequency pure-tone average hearing threshold (BEHFPTA: 10, 12.5, 14 and 16 kHz) were significant. For tinnitus sufferers, THI was related to WM scores in the easiest n-back condition, and BEHFPTA was related to WM scores in the easiest and the hardest n-back condition.
Conclusion
Tinnitus was not related to WM scores. Tinnitus handicap was related to some WM scores in tinnitus sufferers. Further investigation of the possible relationship between high-frequency hearing and WM is warranted.
Introduction
Reports of impaired concentration in adults with tinnitus have led to suggestions that tinnitus could negatively affect cognitive abilities (Tyler and Baker Citation1983; Hallam, McKenna, and Shurlock Citation2004; Waechter and Brännström Citation2015; Hall et al. Citation2018; Waechter et al. Citation2019). This has been supported by behavioural studies reporting poorer performances in adult tinnitus sufferers on tasks involving attention (Andersson et al. Citation2000; Jackson, Coyne, and Clough Citation2014) or working memory (WM) (Rossiter, Stevens, and Walker Citation2006).
The notion that tinnitus could impair attention is supported by Andersson et al. (Citation2000) and Jackson, Coyne, and Clough (Citation2014) who used versions of the Stroop test (Stroop Citation1935) to examine executive attention in tinnitus sufferers compared to control participants. Andersson et al. (Citation2000) recruited tinnitus sufferers from an audiology clinic, while Jackson, Coyne, and Clough (Citation2014) only included tinnitus sufferers who had never sought help or treatment for their condition. In contrast to the study reported by Jackson, Coyne, and Clough (Citation2014), Andersson et al. (Citation2000) reported the absence of the classic Stroop effect. However, both studies reported significantly slower response times in tinnitus sufferers compared to control participants. These findings led to the conclusion that tinnitus may impair executive attention. In addition, studies reported by Leaver et al. (Citation2011) and Mühlau et al. (Citation2006) conducted fMRI scans to compare neuroanatomy in tinnitus sufferers and control subjects. Both studies indicated tinnitus sufferers had less grey matter in the subcallosal region of the brain. Activity from this brain region has been reported to correlate with perception of unpleasant sounds (e.g. Blood et al. Citation1999) and is assumed to be involved in depression (e.g. Hamani et al. Citation2011). Atrophy in the subcallosal region is however also significantly associated with behavioural symptoms of neurodegenerative diseases such as mild cognitive impairment, Alzheimer’s disease and behavioural variant frontotemporal dementia irrespective of disease aetiology (Cajanus et al. Citation2019), indicating that the subcallosal region could also play a role for cognitive processes.
The notion that tinnitus impairs WM capacity is mainly supported by a study conducted by Rossiter and colleagues (Citation2006). Working memory is defined as a cognitive system for temporarily storing information so that the information can be retrieved in order to solve external tasks (Miyake and Shah Citation1999). Tinnitus is believed to have a negative impact on that ability as the neural resources available for WM are limited and the act of suppressing tinnitus uses neural resources that could otherwise have been used to store information (Rossiter, Stevens, and Walker Citation2006). Rossiter, Stevens, and Walker (Citation2006) compared performances on a reading span-test in nineteen tinnitus sufferers and nineteen age-matched control participants without tinnitus. The study found a small but significant difference in mean reading span between the groups, and the authors concluded that tinnitus impairs WM capacity.
While suggestive, the research linking tinnitus to poorer cognitive performance has been limited by poor control of co-occurring factors that could affect cognitive performance in and of themselves. Perhaps the strongest of these factors is hearing loss (Mohamad, Hoare, and Hall Citation2016). Hearing loss is an important consideration when studying tinnitus and cognitive performance because of the high prevalence of hearing loss in adults with tinnitus (estimated to be as high as 90%: Barnea et al. Citation1990; Sanchez et al. Citation2005) and the possible links between hearing loss and cognitive performance (Uchida et al. Citation2019). The effects of controlling for hearing loss when studying cognitive performance can be seen in two studies by Waechter and Brännström (Citation2015) and Waechter et al. (Citation2019). Waechter and Brännström (Citation2015) examined executive attention (via a visual Stroop task) in 40 adults of whom 20 reported having tinnitus and all had normal hearing thresholds (≤20 dB HL) at 0.125–8 kHz in the worse ear. Contrary to previous studies (Andersson et al. Citation2000; Jackson, Coyne, and Clough Citation2014), these authors found no relationship between executive attention and tinnitus. Waechter et al. (Citation2019) examined WM (via the n-back task) in 62 adults of whom 31 had tinnitus, all had normal hearing thresholds (≤20 dB HL) at 0.125–8 kHz in the worse ear, and some had hearing loss (>20 dB HL) at 10–16 kHz in the better ear. Waechter et al. (Citation2019) found a relationship between WM and hearing loss at 10–16 kHz, but no relationship between WM and tinnitus. In addition, when controlling more carefully for hearing status, the previously reported differences between individuals with and without tinnitus in terms of neuroanatomy also appear to be associated with hearing thresholds above 8 kHz rather than the presence of tinnitus (Melcher, Knudson, and Levine Citation2013).
Other factors co-occurring with tinnitus that could affect cognitive performance include depression and anxiety (Cisler and Koster Citation2010; Kaiser et al. Citation2003; Peckham, McHugh, and Otto Citation2010) and tinnitus distress (Rossiter, Stevens, and Walker Citation2006; Stevens et al. Citation2007). With some exceptions (e.g. Jackson, Coyne, and Clough Citation2014), the majority of studies in this area show no correlations between anxiety or depression and cognitive performance in adults with tinnitus (Andersson et al. Citation2000; Rossiter, Stevens, and Walker Citation2006; Stevens et al. Citation2007). Correlations between tinnitus distress and cognitive performance are less clear with Dornhoffer et al. (Citation2006) and Stevens et al. (Citation2007) reporting no correlations on small samples of adults with tinnitus (n = 29 and 11, respectively) but Wang et al. (Citation2018) reporting a clear, negative correlation in a large sample of adults with tinnitus (n > 200). Yet other factors thought to affect cognitive performance include age (e.g. Harada, Natelson Love, and Triebel Citation2013; Bialystok and Craik Citation2006) and education (e.g. Falch and Massih Citation2011) with younger adults with higher education generally showing higher cognitive performance.
Suggestions that tinnitus could affect cognitive performance have been limited by poor control of co-occurring factors. The present study aimed to address this concern by examining tinnitus and WM in adults with and without tinnitus, and tinnitus distress and WM in adults with tinnitus, in a manner that controlled for hearing loss, depression and anxiety. Such controlled research is needed to develop evidence-based interventions that address the direct causes of cognitive difficulties in adults with tinnitus. The research questions asked in this study were: (1) in adults, is tinnitus related to WM scores after correcting for hearing thresholds, anxiety, and depression; and (2) in adults with tinnitus, are tinnitus handicap, hearing thresholds, anxiety and depression related to WM scores?
Methods
Participants
Eighty-two volunteer participants were initially recruited through audiological clinics in southern Sweden, public advertising and word of mouth. Six participants were subsequently excluded from the study; three due to difficulty finding age-matched co-participants, one due to difficulty finding an education matched co-participant, one due to neurological comorbidity assumed to affect the results, and one who withdrew from the study after reporting fatigue when completing the study’s cognitive tasks. shows the descriptive statistics for the final 76 participants by group (n = 38 with tinnitus and n = 38 without tinnitus). shows the characteristics of the participants who reported having tinnitus. Of the participants both with and without tinnitus, half had hearing thresholds of ≤20 dB HL at 0.125, 0.25, 0.5, 1, 1.5, 2, 3, 4, 6 and 8 kHz in both ears and half had hearing impairment (hearing thresholds >20 dB HL for at least one frequency in the better ear). There was no significant difference in mean hearing thresholds between the tinnitus group and the control group (for best ear pure tone average [BEPTA; 0.5, 1, 2 and 4 kHz] or best ear high frequency pure tone average [BEHFPTA; 10, 12.5, 14 and 16 kHz]). See for mean hearing thresholds at each frequency for the participants with normal hearing and hearing impairment. To be included in the tinnitus group (with or without hearing loss), participants must have reported subjective tinnitus for the first time at least 6 months prior to participating in the study. Chronic tinnitus was not a formal inclusion criterion for the tinnitus group, but almost every included tinnitus participant reported having chronic tinnitus. To be in the control group (with or without hearing loss), participants must have not reported subjective tinnitus prior to participating in the study. Included participants had self-reported normal or corrected to normal vision and were matched for education (current or former university students), age (matched participants differed in age by <24 months) and sex.
Figure 1. Mean hearing thresholds at 0.125–16 kHz in left and right ear, for the normal hearing (n = 19) and the hearing impaired (n = 19) participants of the tinnitus group, and the normal hearing (n = 19) and the hearing impaired (n = 19) participants of the control group. Error bars = 1 SD.
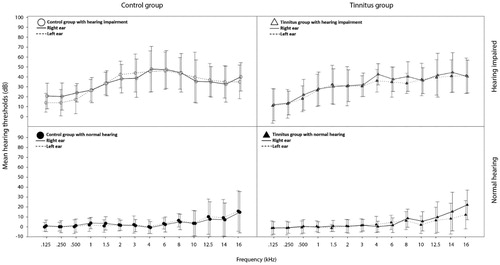
Table 1. Demographic statistics for all participants and each group.
Table 2. Characteristics of participants with tinnitus (n = 38).
Prior to participation, all volunteers were informed of the purpose and conditions of the study and provided written consent to participate in the study. Ethical approval for this study was granted from the Regional Ethical Review Board in Lund, Sweden (approval number 2014/95).
Materials
Equipment
A Madsen Astera2 (GN Otometrics) audiometer was used for pure-tone audiometry. Auditory stimuli were presented via HDA 200 (Sennheiser) earphones calibrated in accordance with ISO 389-8 (Citation2004) and ISO 389-5 (Citation2006). Calibration was performed using a Brüel & Kjaer type 2209 sound level metre and type 4153 artificial ear.
Measure of working memory: the n-back test
The n-back test is a behavioural test widely used in the field of psychology to measure WM capacity (Braver et al. Citation1997; Cohen et al. Citation1997). It is a sequential memory test where the participant is asked to indicate when a stimulus was identical to the stimulus presented n presentations ago. The test consists of different subtests, where n is equal to a different number in each subtest. For example; when n equals 0 (i.e. 0-back), the task is to indicate whether a given stimulus is presented or not; when n equals 1 (i.e. 1-back), the task is to indicate whether the present stimulus is identical to the previous stimulus or not; when n equals 2 (i.e. 2-back), the task is to identify whether the present stimulus is identical to the presentation before the last – and so on. The difficulty varies amongst these different subtests as the load on the participant’s WM is proportional to the value of n (Braver et al. Citation1997). The n-back version used in the present study was written in E-Studio 2.0 and presented via E-Run 2.0 (E-Prime Professional, developed by Ben Robinson and Becky Fuller). It was downloaded from http://step.psy.cmu.edu/scripts-plus/ and adapted by the last author for testing in the Swedish language.
The version of the n-back test used in the present study consisted of a 0-back, 1-back and 2-back task. Each task consisted of a series of 30 stimulus presentations each being a capital letter (specifically: X, S, Z, D, W, F, G, P, C, J, M, T or H) presented in random order in the centre of a computer screen. Ten of the 30 stimulus presentations were the target stimulus. Each letter was presented for 500 ms followed by a 3000 ms white screen before the next presentation. During these 3500 ms periods, the participant had to decide whether the presented letter was a target or not by pressing the corresponding button on a keyboard as quickly as possible. Prior to each n-back test condition, participants underwent a short training session for the upcoming condition (i.e. one training session before the 0-back condition, another training session before the 1-back condition, and so on). The only difference between training session and the actual test was that the training session consisted of 10 stimulus presentations only.
Measure of anxiety and depression: the HADS questionnaire
The Hospital Anxiety and Depression Scale (HADS) is a questionnaire used to assess levels of anxiety and depression. It was first presented by Zigmond and Snaith (Citation1983) and has since been widely used in the field of psychology where it has shown good validity and test–retest reliability (Bjelland et al. Citation2002; Hermann Citation1997). The HADS questionnaire consists of 14 statements of which half relate to anxiety and provide an anxiety subscale (HADSA) and half relate to depression and provide a depression subscale (HADSD). The participant is asked to report to what degree each statement is applicable to them by selecting one out of four possible response options. An example statement is “I can laugh and see the funny side of things”, for which the response options are “as much as I always could”, “not quite so much now”, “definitely not so much now”, or “not at all”. The participant’s response to each statement is scored from 0–3 depending on the level of anxiety/depression with higher scores indicating higher levels. A total score from 0 to 21 is obtained for each subscale with scores below 8 categorised as normal, 8–10 as borderline, and higher than 10 as clinical levels of anxiety or depression depending on subscale (Zigmond and Snaith Citation1983).
Measure of tinnitus distress: the THI
The Tinnitus Handicap Inventory (THI; Newman, Jacobson, and Spitzer Citation1996) has become a common tool for obtaining a self-report measure of tinnitus distress “both clinically and in studies” (Ratnayake, Jayarajan, and Bartlett Citation2009, p. 156) due to its excellent validity and test–retest reliability (McCombe et al. Citation2001). The THI consists of 25 questions regarding tinnitus (e.g. “Because of your tinnitus is it difficult for you to concentrate?”) to which the participant must respond “Yes”, “Sometimes” or “No”. Each “Yes” response scores four, each “Sometimes” response scores two, and each “No” response scores zero. Total scores range from 0 to 100 with scores of 0–16 indicating no handicap, 18–36 a mild handicap, 38–56 a moderate handicap, and 58–100 a severe handicap (58–100) due to tinnitus (Newman, Sandridge, and Jacobson Citation1998).
Measure of hearing status
Pure tone air conduction hearing thresholds were assessed at frequencies of 0.125, 0.25, 0.5, 1, 1.5, 2, 3, 4, 6, 8, 10, 12.5, 14 and 16 kHz in each ear. From these measurements, two values were calculated for each participant in order to give an indication of the participant’s hearing status: pure tone average of the better ear at 0.5, 1, 2 and 4 kHz (BEPTA), and high-frequency pure tone average of the better ear at 10, 12.5, 14 and 16 kHz (BEHFPTA). Thirteen participants (7 tinnitus sufferers, 6 control participants) had one or more hearing thresholds beyond the limits of the audiometer in the high-frequency range (10–16 kHz). For those participants, the highest tested dB HL levels at those frequencies were used for calculating the BEHFPTA. Best ear hearing thresholds were used as a measure of hearing status as this can be assumed to be the main limitation of auditory stimulation in individuals with symmetrical hearing, making it an adequate measure in the context of the present study’s participants.
Procedure
The procedure was conducted in a sound-treated room complying with the maximum permissible ambient sound levels stated in ISO 8253-1 (Citation2010). Each participant initially underwent otoscopy and pure tone audiometry before being seated approximately 0.5 m from a computer screen and given written and oral instructions for the n-back test. The n-back test required each participant to use a computer keyboard to respond to visual stimuli presented on a computer screen, with the n-back subtests presented in the order of 0-back, 1-back and 2-back. Finally, each participant completed the Swedish version of HADS and participants in the tinnitus group completed the Swedish version of THI and a short interview. The interview included open questions regarding the time of the debut of tinnitus, tinnitus lateralisation, and how the tinnitus sufferer would describe the phantom sound/s. Two participants underwent the procedure in a slightly different order due to a combination of technical difficulties and time limitations.
Data analysis
As both accuracy and response time need to work well in order for one’s WM to be functional, analysing those factors separately may lead to incorrect conclusions regarding working memory capacity. While there are several ways to combine accuracy and response time to a single factor indicative of WM capacity, the Rate Correct Score (RCS) presented by Woltz and Was (Citation2006) was deemed to be a reasonable alternative (Vandierendonck Citation2017). RCS is defined as the following formula;
where c = number of correct responses, and RT = response time. Hereinafter, the RCS will be referred to as n-back performance.
The results obtained from all participants were analysed descriptively by calculating skewness and kurtosis and inspecting frequency histograms and normal Q–Q plots. The Box test was used to examine the equality of covariance matrices in the MANCOVA models and the standardised residuals in these models were examined for normality of distribution and relationship with predicted standardised residuals. No findings were identified that threatened the assumptions for MANCOVA analyses.
The results obtained from all participants were analysed inferentially using a one-way MANCOVA with the dependent variables being n-back performance in the 0-back, 1-back and 2-back conditions, the independent variable being presence or absence of tinnitus, and the co-variables being HADSA score, HADSD score, BEPTA and BEHFPTA.
The results obtained from only participants with tinnitus were analysed using a multivariate multiple regression analysis. The dependent variables were n-back performance in the 0-back, 1-back and 2-back conditions. The independent variables (predictors) were THI score, HADSA score, HADSD score, BEPTA, and BEHFPTA.
All statistical analyses were performed using IBM SPSS Statistics version 24.0.0.0, 64-bit edition for Windows (IBM SPSS, Armonk, NY).
Results
shows the results of the multivariate MANCOVA analysis for all participants. The presence or absence of tinnitus was not related to WM scores (0-, 1-, and 2-back conditions combined) when corrected for BEPTA, BEHFPTA, anxiety, and depression. The correction for BEHFPTA was significant (p < 0.001). shows the results of the univariate MANCOVA analyses for all participants. The presence or absence of tinnitus was not related to WM scores in the separate n-back test conditions (0-, 1-, or 2-back) but neared significance in the 1-back (p = 0.065) and 2-back (p = 0.056) conditions. The correction for BEHFPTA was significant in each of the n-back test conditions (p < 0.001 for 0-, 1-, and 2-back conditions). See for a visual presentation of the relationship between BEHFPTA and n-back scores. The Box test of equality of covariance matrices for this MANCOVA was not significant (p = 0.33).
Figure 2. Relationship between high frequency hearing (best ear high frequency pure tone average at 10, 12.5, 14 and 16 kHz) and working memory (n-back performance) for each group and n-back condition. Lines depict the line of best fit for each group and n-back condition.
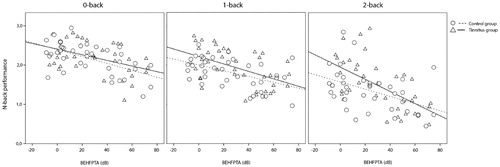
Table 3. Results of the multivariate MANCOVA analysis of all participants for the effect of tinnitus on working memory scores as measured by the performance on the n-back test (0-, 1- and 2-back conditions combined), corrected for anxiety, depression, BEPTA and BEHFPTA.
Table 4. Results of the univariate MANCOVA analyses of all participants for the effect of tinnitus on working memory scores as measured by the performance on each of the n-back tests separately (0-, 1- or 2-back conditions), corrected for anxiety, depression, BEPTA and BEHFPTA.
shows the results of the multivariate multiple regression analysis of n-back performance in participants with tinnitus. This analysis showed that in tinnitus sufferers, THI score and BEHFPTA contributed to the significant prediction of variance in the 0-back condition (F(5, 37) = 3.940, p = 0.007, R2 = 0.381, R2adjusted = 0.284), and BEHFPTA contributed to the significant prediction of variance in the 2-back condition (F(5, 37) = 4.922, p = 0.002, R2 = 0.435, R2adjusted = 0.346). BEHFPTA trended towards contributing to the near-significant prediction of variance in the 1-back condition (F(5, 37) = 2.391, p = 0.060, R2 = 0.272, R2adjusted = 0.158).
Table 5. Results of the multivariate multiple regression analysis predicting n-back performance in individuals with tinnitus based on THI, anxiety, depression, BEPTA and BEHFPTA.
Discussion
The main findings of the present study were: (1) in adults, tinnitus was not related to WM scores when corrected for hearing thresholds, anxiety, and depression, and (2) in adults with tinnitus, tinnitus handicap was related to some WM scores when analysed with hearing thresholds, anxiety, and depression. These results will now be discussed in turn.
Tinnitus was not related to WM scores when corrected for hearing thresholds, anxiety and depression
The absence of a significant relationship between tinnitus and WM when corrected for hearing thresholds, anxiety, and depression was consistent with suggestions that previous reports of this relationship (Rossiter, Stevens, and Walker Citation2006) were confounded by an absence of these corrections (particularly for hearing loss; Waechter and Brännström Citation2015; Waechter et al. Citation2019). While the present study showed no significant relationship between tinnitus and WM overall, the near significant relationships observed between tinnitus and WM in the 1-back (p = 0.065) and 2-back (p = 0.056) conditions suggests some potential for tinnitus to affect WM when the WM task is more difficult.
The highly significant (p < 0.001) correction for BEHFPTA in the MANCOVA analysis of tinnitus and WM was consistent with other studies linking high frequency hearing status and cognitive performance or neuroanatomy in tinnitus sufferers (Melcher, Knudson, and Levine Citation2013; Waechter et al. Citation2019). While the present study showed BEHFPTA explained 16–22% of the variation in WM capacity (depending on task difficulty), the reason for this relationship was unclear. Broader research into hearing loss and cognitive decline provides at least three hypotheses for consideration. Perhaps the most prominent is the cognitive load hypothesis that suggests hearing impairment implies spending greater cognitive resources on understanding speech, which leaves fewer resources for completing other cognitive tasks. The common cause hypothesis suggests the presence of a common underlying mechanism, such as suboptimal microvascular function, could impair both hearing and cognitive performance. Finally, the cascade hypothesis suggests hearing loss leads to decreased sensory stimulation of the brain, which reduces total brain volume and the resources needed for cognitive operations (see Uchida et al. [Citation2019] for a review).
Of the three hypotheses discussed above, the findings of the present study are more consistent with the cascade and common cause hypotheses. While the cognitive load hypothesis has received support from recent research reporting significant associations between hearing thresholds above 8 kHz and speech intelligibility in noise (Motlagh Zadeh et al. Citation2019; Yeend, Beach, and Sharma Citation2019), it is challenged by the most critical frequency range for speech intelligibility being between 0.2–4 kHz (Rosen and Howell Citation2011). This challenge was supported by the present study’s finding of no significant correction for BEPTA on the relationship between tinnitus and WM. It should be noted that the participants in the present study had either normal hearing or mild to moderate hearing impairment at 0.125–8 kHz. It is possible that more severe hearing impairment in this frequency range could have led to a greater effect of BEPTA on the relationship between tinnitus and WM.
Tinnitus handicap was related to some WM scores when analysed with hearing thresholds, anxiety and depression
In the present study’s adults with tinnitus, the finding that tinnitus handicap contributed to the prediction of WM in the 0-back condition (p = 0.011) was consistent with previous suggestions that greater degrees of tinnitus distress may be associated with poorer cognitive performances (e.g. Wang et al. Citation2018). The presence of this finding in the 0-back condition only suggests tinnitus handicap may contribute to WM in easy WM conditions only (with the 0-back condition being the easiest of the n-back conditions in the present study). Alternatively, tinnitus handicap could have affected a function other than working memory, with some researchers arguing the 0-back condition primarily targets sustained attention (Miller et al. Citation2009) as the participant only has to keep a single target stimulus in mind during the entire test condition.
The significant contribution of BEHFPTA to the prediction of WM capacity in the 0-back (p = 0.026) and 2-back (p = 0.017) conditions, and near significant contribution in the 1-back (p = 0.058) condition, suggested high-frequency hearing was associated with WM capacity regardless of task complexity in this study’s adults with tinnitus. When considered with the tinnitus handicap finding discussed above, this suggests that while high-frequency hearing could relate to WM in general, emotional responses to tinnitus could also affect WM in less demanding WM conditions. Previous studies of individuals without tinnitus have indicated that emotional distress may be associated both with poorer cognitive abilities in general (e.g. Horvat and Tement Citation2020; Llewellyn et al. Citation2008) and with poorer working memory specifically (e.g. Choi et al. Citation2013; Coifman et al. Citation2019), indicating that the observed relationship between tinnitus distress and WM in the present study may not be tinnitus specific, but instead could be indirectly related to emotional distress possibly elicited by tinnitus. Whilst speculative, this could indicate a potential focal point for tinnitus management in the clinical setting. Addressing the emotional response to the phantom sound experience could be recommended for tinnitus patients reporting problems carrying out easy everyday-life tasks, while a thorough hearing rehabilitation could be recommended for tinnitus patients experiencing cognitive decline.
Differences and limitations of the present study
The current study differs in several respects from previous studies investigating tinnitus sufferers’ performances on tests measuring WM capacity. In particular, the present study controlled for participant hearing status, age, sex and education, and used a test of WM that had a low linguistic load (the n-back test). Other similar studies have matched participants for age but not for sex and education, and have used tests of WM with high linguistic loads such as reading span tests (Rossiter, Stevens, and Walker Citation2006; Daneman and Hannon Citation2007).
Limiting the current study was its assessment of WM only and no other cognitive ability. 31 out of 38 tinnitus sufferers in this study reported their tinnitus affected their concentration (according to their THI-answers). The prevalence of this experience seems similar in tinnitus sufferers with normal hearing (14 out of 19) and tinnitus sufferers with hearing impairment (17 out of 19), indicating that hearing status does not seem to be decisive for whether tinnitus is perceived as limiting of the ability to concentrate or not. In light of this, it seems plausible that tinnitus might negatively affect some but not all cognitive functions. Researchers have generally been studying either behavioural cognitive performances, neural measures or a combination of the two, but the main reason for our interest in studying the association between tinnitus and cognitive performance is tinnitus sufferers experiencing concentration difficulties (Tyler and Baker Citation1983; Hallam, McKenna, and Shurlock Citation2004; Waechter and Brännström Citation2015; Waechter et al. Citation2019). In line with this, our results indicate the majority of tinnitus sufferers perceived their tinnitus negatively affected their cognitive performance even though their performances were not worse than those of sex-, age-, education- and hearing-matched control participants without tinnitus. Additionally, our data suggest WM capacity under less demanding memory conditions was significantly related to the degree of tinnitus distress (and nearly related to depression). This may be an indication that tinnitus sufferers’ emotional responses to the phantom sound experience could be critical for how tinnitus relates to cognitive performances. For these reasons, we believe it would be valuable not only to investigate how well tinnitus sufferers and control participants without tinnitus perform on different cognitive tasks but also investigating the perceived effort needed to perform the task, the emotional experience of performing it and how tiring different tasks are. To date, these aspects have been consistently disregarded.
The current study was also limited by its participant sample being restricted to adults with higher education. This was not an inclusion criterion, but rather an attempt to control levels of education amongst participants being recruited mostly from Lund, Sweden, where the majority of the population are either current or former university students. The most common cause for tinnitus seems to be excessive sound exposure, which makes tinnitus more common amongst individuals working in noisy environments (12–70% prevalence) compared to individuals working in environments with less sound exposure (2–14% prevalence) (Axelsson and Prasher Citation2000; Poole Citation2010). On a group level, individuals working and living in environments with higher levels of sound exposure tend to have lower education and be living under poorer socioeconomic circumstances compared to individuals working and living in better sound environments (e.g. Casey et al. Citation2017). Since we do not know whether or not individuals with lower levels of education would be more vulnerable to the distraction that the phantom sound experience constitutes, it is unclear to what degree our findings are applicable to the general tinnitus population.
Conclusion
Tinnitus was not related to WM scores in adults with and without tinnitus when corrected for hearing thresholds, anxiety, and depression; but tinnitus handicap was related to some WM scores in adults with tinnitus when analysed with hearing thresholds, anxiety, and depression. The significant corrections observed warrant further investigation of the possible relationship between high-frequency hearing thresholds and WM scores.
Disclosure statement
No potential conflict of interest was reported by the author(s).
Additional information
Funding
References
- Andersson, G., J. Eriksson, L.-G. Lundh, and L. Lyttkens. 2000. “Tinnitus and Cognitive Interference: A Stroop Paradigm Study.” Journal of Speech, Language, and Hearing Research 43 (5): 1168–1173. doi:10.1044/jslhr.4305.1168.
- Axelsson, A., and D. Prasher. 2000. “Tinnitus Induced by Occupational Noise and Leisure Noise.” Noise & Health 2 (8): 47–54.
- Barnea, G., J. Attias, S. Gold, and A. Shahar. 1990. “Tinnitus with Normal Hearing Sensitivity: Extended High-Frequency Audiometry and Auditory-Nerve Brain-Stem-Evoked Responses.” International Journal of Audiology 29 (1): 36–45. doi:10.3109/00206099009081644.
- Bialystok, E., and F. Craik. 2006. Lifespan Cognition: Mechanisms of Change. New York, NY: Oxford University Press, Inc.
- Bjelland, I., A. Dahl, T. Haug, and D. Neckelmann. 2002. “The Validity of the Hospital Anxiety and Depression Scale. An updated literature review.” Journal of Psychosomatic Research 52 (2): 69–77. doi:10.1016/s0022-3999(01)00296-3.
- Blood, A. J., R. J. Zatorre, P. Bermudez, and A. C. Evans. 1999. “Emotional Responses to Pleasant and Unpleasant Music Correlate with Activity in Paralimbic Brain Regions.” Nature Neuroscience 2 (4): 382–387. [Database] doi:10.1038/7299.
- Braver, T. S., J. D. Cohen, L. E. Nystrom, J. Jonides, E. E. Smith, and D. C. Noll. 1997. “A Parametric Study of Prefrontal Cortex Involvement in Human Working Memory.” Neuroimage 5 (1): 49–62. doi:10.1006/nimg.1996.0247.
- Cajanus, A., E. Solje, J. Koikkalainen, J. Lötjönen, N.-M. Suhonen, I. Hallikainen, R. Vanninen, et al. 2019. “The Association between Distinct Frontal Brain Volumes and Behavioral Symptoms in Mild Cognitive Impairment, Alzheimer’s Disease, and Frontotemporal Dementia.” Frontiers in Neurology. 10: 1059. doi:10.3389/fneur.2019.01059
- Casey, J. A., R. Morello-Frosch, D. J. Mennitt, K. Fristrup, E. L. Ogburn, and P. James. 2017. “Race/Ethnicity, Socioeconomic Status, Residential Segregation, and Spatial Variation in Noise Exposure in the Contiguous United States.” Environmental Health Perspectives 125 (7): 077017. doi:10.1289/EHP898.
- Choi, Mi-Hyun, Yoon-Ki Min, Hyung-Sik Kim, Ji-Hye Kim, Hong-Won Yeon, Jin-Seung Choi, Boseong Kim, et al. 2013. “Effects of Three Levels of Arousal on 3-Back Working Memory Task Performance.” Cognitive Neuroscience 4 (1): 1–6. doi:10.1080/17588928.2011.634064.
- Cisler, J. M., and E. H. W. Koster. 2010. “Mechanisms of Attentional Biases towards Threat in Anxiety Disorders: An Integrative Review.” Clinical Psychology Review 30 (2): 203–216. doi:10.1016/j.cpr.2009.11.003.
- Cohen, J. D., W. M. Perlstein, T. S. Braver, L. E. Nystrom, D. C. Noll, J. Jonides, and E. E. Smith. 1997. “Temporal Dynamics of Brain Activation during a Working Memory Task.” Nature 386 (6625): 604–608. doi:10.1038/386604a0.
- Coifman, K. G., M. J. Kane, M. Bishop, L. M. Matt, K. M. Nylocks, and P. Aurora. 2019. “Predicting Negative Affect Variability and Spontaneous Emotion Regulation: Can Working Memory Span Tasks Estimate Emotion Regulatory Capacity?” Emotion. Advance online publication. doi:10.1037/emo0000585.
- Daneman, M., and B. A. Hannon. 2007. “What Do Working Memory Span Tasks like Reading Span Really Measure?” In The Cognitive Neuroscience of Working Memory, edited by N. Osaka, R. H. Logie, and M. D’Esposito, 21–42. New York, NY: Oxford University Press.
- Dornhoffer, J., C. Danner, M. Mennemeier, D. Blake, and E. Garcia-Rill. 2006. “Arousal and Attention Deficits in Patients with Tinnitus.” The International Tinnitus Journal 12 (1): 9–16.
- Falch, T., and S. S. Massih. 2011. “The Effect of Education on Cognitive Ability.” Economic Inquiry 49 (3): 838–856. doi:10.1111/j.1465-7295.2010.00312.x.
- Hall, D. A., K. Fackrell, A. B. Li, R. Thavayogan, S. Smith, V. Kennedy, C. Tinoco, et al. 2018. “A Narrative Synthesis of Research Evidence for Tinnitus-Related Complaints as Reported by Patients and Their Significant Others.” Health and Quality of Life Outcomes 16 (1): 61. doi:10.1186/s12955-018-0888-9.
- Hallam, R. S., L. McKenna, and L. Shurlock. 2004. “Tinnitus Impairs Cognitive efficiency.” International Journal of Audiology 43 (4): 218–226. doi:10.1080/14992020400050030.
- Hamani, C., H. Mayberg, S. Stone, A. Laxton, S. Haber, and A. M. Lozano. 2011. “The Subcallosal Cingulate Gyrus in the Context of Major Depression.” Biological Psychiatry 69 (4): 301–308. doi:10.1016/j.biopsych.2010.09.034.
- Harada, C. N., M. C. Natelson Love, and K. Triebel. 2013. “Normal Cognitive Aging.” Clinics in Geriatric Medicine 29 (4): 737–752. doi:10.1016/j.cger.2013.07.002.
- Hermann, C. 1997. “International Experiences with the Hospital Anxiety and Depression Scale: A Review of Validation Data and Clinical Results.” Journal of Psychosomatic Research 42: 17–41. doi:10.1016/S0022-3999(96)00216-4
- Horvat, M., and S. Tement. 2020. “Self-Reported Cognitive Difficulties and Cognitive Functioning in Relation to Emotional Exhaustion: Evidence from Two Studies.” Stress and Health 36 (3): 350–364. doi:10.1002/smi.2930.
- ISO 389-8. 2004. Acoustics - Reference Zero for the Calibration of Audiometric equipment - Part 8: Reference Equivalent Threshold Sound Pressure Levels for Pure Tones and Circumaural Earphones. Geneva, Switzerland: International Organization for Standardization.
- ISO 389-5. 2006. Acoustics – Reference Zero for the Calibration of Audiometric equipment – Part 5: Reference Equivalent Threshold Sound Pressure Levels for Pure Tones in the Frequency Range 8 kHz to 16 kHz. Geneva, Switzerland: International Organization for Standardization.
- ISO 8253-1. 2010. Acoustics – Audiometric Test Methods. Geneva, Switzerland: International Organization for Standardization.
- Jackson, J. G., I. J. Coyne, and P. J. Clough. 2014. “A Preliminary Investigation of Potential Cognitive Performance Decrements in Non-Help-Seeking Tinnitus Sufferers.” International Journal of Audiology 53 (2): 88–93. doi:10.3109/14992027.2013.846481.
- Kaiser, S., J. Unger, M. Kiefer, J. Markela, C. Mundt, and M. Weisbrod. 2003. “Executive Control Deficit in Depression: Event-Related Potentials in a Go/Nogo Task.” Psychiatry Research: Neuroimaging 122 (3): 169–184. doi:10.1016/S0925-4927(03)00004-0.
- Leaver, A. M., L. Renier, M. A. Chevillet, S. Morgan, H. J. Kim, and J. P. Rauschecker. 2011. “Dysregulation of Limbic and Auditory Networks in Tinnitus.” Neuron 69 (1): 33–43. doi:10.1016/j.neuron.2010.12.002.
- Llewellyn, D. J., I. A. Lang, K. M. Langa, and F. A. Huppert. 2008. “Cognitive Function and Psychological Well-Being: Findings from a Population-Based Cohort.” Age and Ageing 37 (6): 685–689. doi:10.1093/ageing/afn194.
- McCombe, A., D. Baguley, R. Coles, L. McKenna, C. McKinney, and P. Windle-Taylor. 2001. “Guidelines for the Grading of Tinnitus Severity: The Results of a Working Group Commissioned by the British Association of Otolaryngologists, Head and Neck Surgeons, 1999.” Clinical Otolaryngology and Allied Sciences 26 (5): 388–393. doi:10.1046/j.1365-2273.2001.00490.x.
- Melcher, J. R., I. M. Knudson, and R. A. Levine. 2013. “Subcallosal Brain Structure: Correlation with Hearing Threshold at Supra-Clinical Frequencies (>8 kHz), but Not with Tinnitus.” Hearing Research 295: 79–86. doi:10.1016/j.heares.2012.03.013.
- Miller, K. M., C. C. Price, M. S. Okun, H. Montijo, and D. Bowers. 2009. “Is the n-Back Task a Valid Neuropsychological Measure for Assessing Working Memory?” Archives of Clinical Neuropsychology: Neuropsychology 24 (7): 711–717. doi:10.1093/arclin/acp063.
- Miyake A., and P. Shah, eds. 1999. Models of Working Memory. Mechanisms of Active Maintenance and Executive Control. New York, NY: Cambridge University Press.
- Mohamad, N., D. J. Hoare, and D. A. Hall. 2016. “The Consequences of Tinnitus and Tinnitus Severity on Cognition: A Review of the Behavioural Evidence.” Hearing Research 332: 199–209. doi:10.1016/j.heares.2015.10.001.
- Motlagh Zadeh, M. L., N. H. Silbert, K. Sternasty, D. W. Swanepoel, L. L. Hunter, and D. R. Moore. 2019. “Extended High-Frequency Hearing Enhances Speech Perception in Noise.” Proceedings of the National Academy of Sciences 116 (47): 23753–23759. doi:10.1073/pnas.1903315116.
- Mühlau, M., J. P. Rauschecker, E. Oestreicher, C. Gaser, M. Röttinger, A. M. Wohlschläger, F. Simon, T. Etgen, B. Conrad, and D. Sander. 2006. “Structural Brain Changes in Tinnitus.” Cerebral Cortex 16 (9): 1283–1288. doi:10.1093/cercor/bhj070.
- Newman, C. W., G. P. Jacobson, and J. B. Spitzer. 1996. “Development of the Tinnitus Handicap Inventory.” Archives of Otolaryngology-Head & Neck Surgery 122 (2): 143–148. doi:10.1001/archotol.1996.01890140029007.
- Newman, C. W., S. A. Sandridge, and G. P. Jacobson. 1998. “Psychometric Adequacy of the Tinnitus Handicap Inventory (THI) for Evaluating Treatment Outcome.” Journal of the American Academy of Audiology 9 (2): 153–160.
- Peckham, A. D., R. K. McHugh, and M. W. Otto. 2010. “A Meta-Analysis of the Magnitude of Biased Attention in Depression.” Depression and Anxiety 27 (12): 1135–1142. doi:10.1002/da.20755.
- Poole, K. 2010. A Review of the Current State of Knowledge on Tinnitus in Relation to Noise Exposure and Hearing Loss. Norwich, UK: Health and Safety Executive (HSE Books).
- Ratnayake, S., V. Jayarajan, and J. Bartlett. 2009. “Could an Underlying Hearing Loss Be a Significant Factor in the Handicap Caused by Tinnitus?” Noise & Health 11: 156–160. doi:10.4103/1463-1741.53362
- Rosen, S., and P. Howell. 2011. Signals and Systems for Speech and Hearing. 2nd ed. Bingley, UK: Emerald Group Publishing Limited.
- Rossiter, S., C. Stevens, and G. Walker. 2006. “Tinnitus and Its Effect on Working Memory and Attention.” Journal of Speech, Language, and Hearing Research 49 (1): 150–160. doi:10.1044/1092-4388(2006/012).
- Sanchez, T. G., Í. R. T. de Medeiros, C. P. D. Levy, J. R. O. Ramalho, and R. F. Bento. 2005. “Tinnitus in Normally Hearing Patients: Clinical Aspects and Repercussions.” Brazilian Journal of Otorhinolaryngology 71 (4): 427–431. doi:10.1590/S0034-72992005000400005.
- Stevens, C., G. Walker, M. Boyer, and M. Gallagher. 2007. “Severe Tinnitus and Its Effect on Selective and Divided Attention.” International Journal of Audiology 46 (5): 208–216. doi:10.1080/14992020601102329.
- Stroop, J. R. 1935. “Studies of Interference in Serial Verbal Reactions.” Journal of Experimental Psychology 18 (6): 643–662. doi:10.1037/h0054651.
- Tyler, R. S., and L. J. Baker. 1983. “Difficulties Experienced by Tinnitus Sufferers.” The Journal of Speech and Hearing Disorders 48 (2): 150–154. doi:10.1044/jshd.4802.150.
- Uchida, Y., S. Sugiura, Y. Nishita, N. Saji, M. Sone, and H. Ueda. 2019. “Age-related hearing loss and cognitive decline – The potential mechanisms linking the two.” Auris, Nasus, Larynx 46 (1): 1–9. doi:10.1016/j.anl.2018.08.010.
- Vandierendonck, A. 2017. “A Comparison of Methods to Combine Speed and Accuracy Measures of Performance: A Rejoinder on the Binning Procedure.” Behavior Research Methods 49 (2): 653–673. doi:10.3758/s13428-016-0721-5.
- Waechter, S., and K. J. Brännström. 2015. “The Impact of Tinnitus on Cognitive Performance in Normal-Hearing Individuals.” International Journal of Audiology 54 (11): 845–851. doi:10.3109/14992027.2015.1055836.
- Waechter, S., L. Hallendorf, E. Malmstein, A. Olsson, and K. J. Brännström. 2019. “The Impact of Tinnitus on N-Back Performance in Normal Hearing Individuals.” Journal of the American Academy of Audiology 30 (3): 169–177. doi:10.3766/jaaa.17048.
- Wang, Y., J.-N. Zhang, W. Hu, J.-J. Li, J.-X. Zhou, J.-P. Zhang, G.-F. Shi, P. He, Z.-W. Li, and M. Li. 2018. “The Characteristics of Cognitive Impairment in Subjective Chronic Tinnitus.” Brain and Behavior 8 (3): e00918. doi:10.1002/brb3.918.
- Woltz, D. J., and C. A. Was. 2006. “Availability of Related long-term memory during and after attention focus in working memory.” Memory & Cognition 34 (3): 668–684. doi:10.3758/bf03193587.
- Yeend, I., E. F. Beach, and M. Sharma. 2019. “Working Memory and Extended High Frequency Hearing in Adults: Diagnostic Predictors of Speech-in-Noise Perception.” Ear and Hearing 40 (3): 458–467. 0000000000000640 doi:10.1097/AUD.
- Zigmond, A. S., and R. P. Snaith. 1983. “The Hospital Anxiety and Depression Scale.” Acta Psychiatrica Scandinavica 67 (6): 361–370. doi:10.1111/j.1600-0447.1983.tb09716.x.