
Abstract
Objective
Pupillometry is sensitive to cognitive resource allocation and has been used as a potential measure of listening-related effort and fatigue. We investigated associations between peak pupil diameter, pre-stimulus pupil diameter, performance on a listening task, and the dimensionality of self-reported outcomes (task-related listening effort and fatigue).
Design
Pupillometry was recorded while participants performed a speech-in-noise task. Participants rated their experience of listening effort and fatigue using the NASA-Task Load Index (NASA-TLX) and the Visual Analogue Scale of Fatigue (VAS-F), respectively. The dimensionality of the NASA-TLX and the VAS-F was investigated using factor analysis.
Study sample
82 participants with either normal hearing or aided hearing impairment (age range: 55–85 years old, 43 male).
Results
Hierarchal linear regression analyses suggested that pre-stimulus pupil diameter predicts a dimension of self-reported fatigue, which we interpreted as tiredness/drowsiness, and listening task performance when controlling for hearing level and age: Larger pre-stimulus pupil diameter was associated with less tiredness/drowsiness and better task performance.
Conclusion
Pre-stimulus pupil diameter is a potential index of listening fatigue associated with speech processing in challenging listening conditions. To our knowledge, this is the first investigation of the associations between pre-stimulus pupil diameter and self-reported ratings of listening effort and fatigue.
Introduction
Individuals with hearing impairment often report increased levels of listening-related effort and fatigue in everyday life (Alhanbali et al. Citation2017). Listening effort is defined as “the mental exertion required to attend to and to understand an auditory message” (McGarrigle et al. Citation2014, 434). More recently, Pichora-Fuller et al. (Citation2016, 10) defined listening effort as “the deliberate allocation of mental resources to overcome obstacles in goal pursuit when carrying out a task that involves listening”. Listening-related fatigue is defined as “extreme tiredness resulting from effortful listening” (McGarrigle et al. Citation2014, 434). Identifying reliable measures of listening-related effort and fatigue has the potential to improve the quality of hearing rehabilitation by tapping into aspects of listening difficulties that cannot be assessed using traditional clinical audiometric procedures.
A number of self-report, behavioural, and physiological tools have been used as potential measures of listening effort/fatigue and have demonstrated sensitivity to increased listening demands (e.g. McGarrigle et al. Citation2014; Hornsby, Naylor, and Bess Citation2016; Pichora-Fuller et al. Citation2016). When multiple measures of listening effort/fatigue are acquired within the same listeners, often these measures do not correlate with each other (Hornsby Citation2013; Miles et al. Citation2017; Strand et al. Citation2018; Alhanbali et al. Citation2019). Different measures may tap into different dimensions of listening effort and/or listening fatigue (Alhanbali et al. Citation2019).
The use of pupillometry in the assessment of cognitive resource allocation
Pupillometry may provide a non-invasive index of changes in control state; i.e. engagement/exploitation or disengagement/exploration (Gilzenrat et al. Citation2010) and is commonly used as an objective measure of cognitive resource allocation (e.g. Zekveld, Kramer, and Festen Citation2010; Zekveld, Kramer, and Festen Citation2011; Koelewijn et al. Citation2014; Kramer, Teunissen, and Zekveld Citation2016; Wendt, Dau, and Hjortkjar Citation2016). However, there are multiple interpretations of what task-evoked changes in pupil diameter may index (for a recent review see Zekveld, Koelewijn, and Kramer Citation2018). For example, task-evoked pupil dilation during speech processing has been interpreted as an indication of increased processing load (e.g. Zekveld, Kramer, and Festen Citation2010), cognitive load (e.g. Zekveld, Kramer, and Festen Citation2011), cognitive effort (e.g. Piquado, Isaacowitz, and Wingfield Citation2010), or listening effort (e.g. Koelewijn et al. Citation2012).
Task-evoked pupil dilation has also been considered an indicator of attentional capacity (Kramer, Teunissen, and Zekveld Citation2016). For example, when assessing differences in task-evoked pupil dilation between individuals who are hearing-impaired and individuals with normal hearing, greater task-evoked pupil size was identified in individuals with normal hearing when the listening task was performed in the presence of background noise (Kramer, Teunissen, and Zekveld Citation2016). This was despite hearing-impaired listeners reporting significantly greater effort compared to listeners with normal hearing. Smaller task-evoked pupil dilation in listeners who are hearing-impaired may indicate limited attentional capacity likely due to increased consumption of attentional resources as a result of the hearing loss (Kramer, Teunissen, and Zekveld Citation2016).
Fatigue has been reported to be associated with larger peak pupil diameter (Koelewijn et al. Citation2018). Other work, however, found a significant association between fatigue and smaller peak pupil diameter (Ohlenforst et al. Citation2017; Wang et al. Citation2018). The interpretation of changes in peak pupil diameter during a listening task therefore remains unclear: a smaller pupil diameter may reflect an inability to invest further effort in a task due to fatigue, or it may represent disengagement from the task.
In addition to task-evoked peak pupil diameter, changes in pupil diameter measured in the absence of the stimulus of interest, i.e. “baseline” pupil diameter or “resting” pupil diameter, may also index shifts in control state (Zekveld, Kramer, and Festen Citation2010; Hopstaken et al. Citation2015; Wang et al. Citation2018). In speech-in-noise tasks consisting of multiple trials, the pre-stimulus pupil diameter represents the average pupil diameter measured during a period of noise that precedes the presentation of the target stimulus (speech in a noise background) in each trial (Zekveld, Kramer, and Festen Citation2010; Hopstaken et al. Citation2015; Wang et al. Citation2018). Here we will use the term “pre-stimulus pupil diameter”, rather than “baseline pupil diameter”, to avoid confusion with the “resting pupil diameter”, which has been used as the term for measurements of pupil diameter either before or after a listening task (e.g. Zhao et al. Citation2019).
Pre-stimulus pupil diameter has been used to index changes in control state that are likely to fluctuate over the duration of task performance (e.g. Hopstaken et al. Citation2015). For example, larger pre-stimulus pupil diameter is associated with poorer task performance, possibly indicating lapses in task engagement (Aston-Jones and Cohen Citation2005; Gilzenrat et al. Citation2010; Zekveld, Kramer, and Festen Citation2010; Wang et al. Citation2018). In contrast, smaller pre-stimulus pupil diameter has sometimes been interpreted as reduced task engagement due to increased time-on-task fatigue in visual (Hopstaken et al. Citation2015) and auditory tasks (Zekveld, Kramer, and Festen Citation2010).
Due to the lack of agreement on the interpretation of different pupillometric indices, it is essential to consider the design characteristics of each individual research study when attempting to explain what changes in different pupillometric indices represent (Zekveld, Koelewijn, and Kramer Citation2018). It is generally agreed that increased pupil diameter reflects increased arousal in demanding conditions where increased cognitive resource allocation is required. However, pupil size was found to increase with more challenging task demands as long as individuals remain engaged in the task (Ohlenforst et al. Citation2017). As suggested by the Framework for Understanding Effortful Listening (FUEL; Pichora-Fuller et al. Citation2016), in addition to the effort required to perform a task, motivation, performance, success importance, and fatigue can also influence fluctuations in pupil size. The FUEL suggests that displeasure, fatigue and low motivation can result in disengagement even when available capacity is sufficient for performing the task. Therefore, pupil size may decrease for a number of possible reasons: (i) decreased listening demands, (ii) a lack of task engagement due to poor motivation, or (iii) the development of fatigue. The FUEL also suggests an interaction between listening demands, performance and motivation, e.g. poor performance due to an inability to cope with listening demands of the task may result in reduced motivation and lead to a decrease in pupil size.
Pupillometry as a potential index of fatigue
Pupillometry has been used as a potential index of mental fatigue that develops over the duration of performing demanding, lengthy experiments. For instance, McGarrigle et al. (Citation2017) reported a decrease in pupil size over the duration of performing a listening task that was just under an hour long. A decrement in pupil size was only identified in the more challenging SNR condition. McGarrigle et al. suggested that reduced pupil size might be an indication of reduced task engagement as a result of the development of fatigue. Both Hopstaken et al. (Citation2015) and Zekveld, Kramer, and Festen (Citation2010) had participants perform experiments over a long duration of time (2 hours and 1.5 hours respectively) and reported decrements in pre-stimulus pupil diameter over the duration of task performance. They therefore suggested that decrements in pre-stimulus pupil size might be an indication of reduced task engagement over the course of the experiment as a result of the development of fatigue. It is also possible to experience fatigue at the level of individual trials in an experiment e.g. in cases where performing each trial in the task requires high levels of attention. This might happen when participants who are likely to experience chronic fatigue perform a mentally demanding task. For instance, Wang et al. (Citation2018) identified a correlation between self-reported fatigue in everyday life and peak pupil diameter when participants with hearing impairment performed a speech-in-noise task, despite the fact that the task was not excessively long (cf. Hopstaken et al. Citation2015; Zekveld, Kramer, and Festen Citation2010). The timescales over which fatigue was assessed in these studies, i.e. chronic (Wang et al. Citation2018) cf. transient fatigue (Hopstaken et al. Citation2015), was very different and it remains unclear whether different pupillometric indices might be more sensitive to particular aspects of fatigue than others.
The relationship between pupillometric indices and self-report measures
In an attempt to identify the underlying dimensions of different pupillometric indices, the relationship between these indices and self-reported measures has been investigated. For example, Wang et al. (Citation2018) found that smaller peak pupil diameter was linked with increased self-reported fatigue in everyday life, as assessed by the Need for Recovery (NFR; van Veldhoven and Broersen Citation2003) scale, an 11-item scale that can be used for the assessment of fatigue associated with work, but not the Checklist for Individual Strength (CIS; Vercoulen et al. Citation1994), a 20-item scale that can be used in the assessment of chronic fatigue. Pre-stimulus pupil diameter was not significantly related to NFR or the CIS. However, in Hopstaken et al. (Citation2015) a significant correlation was identified between decreased pre-stimulus pupil diameter and self-reported time-on-task fatigue in a lengthy (2 hrs), demanding experiment.
The choice of self-reported fatigue tool may also affect the likelihood of identifying significant associations between pre-stimulus pupil diameter/peak pupil diameter and the experience of fatigue. There are no validated subjective measures of listening-related fatigue, which may be more relevant in the context of hearing impairment. It seems plausible that measures of self-reported fatigue associated with task performance, such as self-reported time-on-task fatigue (Hopstaken et al. Citation2015) or the Visual-Analogue Scale of Fatigue (VAS-F; Lee, Hicks, and Nino-Murcia Citation1991), are more likely to be associated with pre-stimulus pupil diameter/peak pupil diameter. The VAS-F scale was used to measure fatigue associated with task performance in Alhanbali et al. (Citation2019) and contains 2 subscales: fatigue (items 1–5 and 11–18) and energy (items 6–10), see Lee, Hicks, and Nino-Murcia (Citation1991) for descriptions of individual items. To our knowledge, the VAS-F is one of the few standardised self-reported measures of fatigue associated with task performance. However, it is important to note that previous reports suggest the inability of the VAS-F to assess fatigue as a distinct dimension (LaChapelle and Finlayson Citation1998). According to LaChapelle and Finlayson (Citation1998), some of the items in the VAS-F might not refer to fatigue per se, but to other phenomena that are likely to occur as a result of fatigue such as sleepiness (LaChapelle and Finlayson Citation1998). Therefore, one of the aims of the current study is to assess the dimensionality of the VAS-F.
Self-reported listening effort and fatigue may assess different dimensions of hearing-related disability (Alhanbali et al. Citation2017). Exploratory analyses (i.e. correlations uncorrected for multiple comparisons or potential confounding factors) reported in Alhanbali et al. (Citation2019) (see their ), suggested that peak pupil diameter, and the mean task-evoked pupil dilation, were negatively correlated with scores on a task-related, self-reported measure of listening-related fatigue, the VAS-F; (Lee, Hicks, and Nino-Murcia Citation1991) but not a self-reported measure of listening-related effort (NASA-TLX; Hart & Staveland Citation1988). Further clarification on how peak pupil diameter and pre-stimulus pupil diameter relate to the self-reported listening effort and/or listening fatigue may help to shed some light on the conflicting results arising from studies using multiple physiological measures of “listening effort” (Alhanbali et al. Citation2019).
We carried out a secondary analysis of the data acquired in Alhanbali et al. (Citation2019) with the following aims:
The first aim of the study is to determine whether the different items of the VAS-F (Lee, Hicks, and Nino-Murcia Citation1991) and the NASA-TLX (Hart and Staveland Citation1988) assess the same underlying dimensions of fatigue and work load, respectively, when participants are asked to perform a digits-in-noise task. The applicability of the different items of the VAS-F and the NASA-TLX measures might be influenced by the nature of the task to be performed. For example, the physical and extreme exhaustion items in the VAS-F (such as “extremely worn out” and “moving my body is a tremendous chore”) are unlikely to be applicable to listening-related fatigue evoked by a digits-in-noise task. The dimensions of workload included in the NASA-TLX (mental demand, physical demand, temporal demand, performance, effort and frustration) might not necessarily be perceived as a single dimension in a digits-in-noise task. Investigating the dimensionality of the measures can be useful for identifying which of their components are more relevant to a digits-in-noise task.
The second aim is to investigate the possibility of predicting pre-stimulus/peak pupil diameter during performance of a digits-in-noise task from participants’ self-reported experience of listening effort and fatigue, after controlling for potential confounds of age (e.g. Zekveld, Kramer, and Festen Citation2011) and hearing levels (e.g. Kramer, Teunissen, and Zekveld Citation2016). In Alhanbali et al. (Citation2019) we did not include pre-stimulus pupil diameter in the data analyses, although pupil size was recorded throughout each trial. If there is an association between pre-stimulus/peak pupil diameter and self-reported effort/fatigue, this would suggest that pupillometry is a potential physiological measure of listening effort/fatigue in a speech-in-noise task.
To our knowledge, this is the first within-listeners investigation of how participants’ performance on a listening task and their subjective experiences of both task-related, self-reported listening fatigue and listening effort independently contribute to changes in pre-stimulus pupil diameter and post-stimulus peak pupil diameter.
Methods
Below we provide a summarised version of the methods section in Alhanbali et al. (Citation2019).
Participants
The factor analysis reported in Alhanbali et al. (Citation2019) was based on data from 116 participants. A subset of these participants (N = 82, 43 male, age range 55–85 years, M: 70, SD: 7), i.e. only those with complete datasets, was included in the present study.
Participants’ hearing level ranged from “good” hearing (those who had hearing thresholds ≤30 dB HL at frequencies of 500, 1000, 2000, and 4000 Hz) to severe hearing impairment based on the criteria defined by the British Society of Audiology (Citation2018). Participants who were hearing aid users (53 of 59 participants with hearing impairment) performed the listening task wearing their hearing aids. Details about hearing aid prescription and use can be found in Alhanbali et al. (Citation2019). Hearing thresholds were averaged across frequencies. For each participant, the better ear pure-tone average (PTA) was used in the analysis.
Listening task
To minimise differences in performance across participants with different hearing levels, an individualised SNR was established at 71% criterion performance using a 2-down, 1-up, adaptive procedure with a 2-dB step size. Individualised SNRs were established using sequences of 3 digits (1–9, excluding 7) that participants had to memorise and recall in the correct order. The digits were taken from the conversational speech level recordings in the Whispered Voice Test (McShefferty et al. Citation2013). Digits were presented at a level of 65 dBA in the presence of stationary background noise that started 5 secs before the first digit and ended 1 sec after the end of the last digit. The digits were presented via two loudspeakers placed 1 m away from where the participant was sitting at ±45 degrees azimuth. The SNR range required to establish 71% correct performance was −13 to 23 dB (M: −4 dB, SD: 6 dB).
The main listening task, during which pupillometry was recorded, was a modified version of the Sternberg paradigm (Sternberg Citation1966) in which participants are asked to recall speech material presented during a stimulus-free retention period, based on similar paradigms (e.g. Obleser et al. Citation2012; Petersen et al. Citation2015). In the original Sternberg paradigm, the material to be memorised is presented visually. However, here and in previous work (Obleser et al. Citation2012; Petersen et al. Citation2015) spoken speech material was presented.
In the main listening task, speech material from the Whispered Voice Test (McShefferty et al. Citation2013) was also used but participants were presented with sequences of 6 single digits instead of 3 digits. Participants were required to memorise all the digits they heard. After listening to the 6 digits, a 3-sec retention period followed, during which participants mentally rehearsed the digits they heard. A digit then appeared on a computer screen in front of the participant and an audible pure-tone was presented to alert the participant to respond. Using a button box with “Yes” and “No” labels, participants responded with “Yes” if the digit on the screen was one of the digits they heard and with “No” if it was not. The total number of trials in the main listening task was 50. Performance accuracy (% correct) in the main listening task was transformed to Rationalised Arcsine Units (RAU) (Studebaker Citation1985) prior to analysis.
VAS-F
The VAS-F (Lee, Hicks, and Nino-Murcia Citation1991) consists of two subscales: fatigue (12 items; e.g. fatigued, tired) and energy (6 items; e.g. active, energetic). In the original VAS-F, respondents are required to place a mark along a visual line that runs between two extreme points such as “not exhausted at all” and “extremely exhausted”. Here, we used the VAS-F in a Likert-type manner where intermediate demarcations ranging from 1 to 10 were placed along the line between the start and end points. VAS-F scores were converted into percentages. In Alhanbali et al. (Citation2019) participants completed the VAS-F before and after performing the listening task. In order to rule out any effect of fatigue that is not related to task performance, final scores were based on the difference between the scores before and after completing the task.
NASA-TLX
NASA-TLX (Hart and Staveland Citation1988) has six items: mental demand, physical demand, temporal demand, perceived performance, effort, and frustration. After completion of the main listening task, participants provided responses on a 20-step scale, ranging from low demand to high demand for each dimension. The score of each item was converted to a percentage and the total score was calculated based on the mean score of the items used.
Pupillometry
An EyeLink 1000 was used for recording pupil size with a sampling rate of 1000 Hz. Pupil size was measured in pixels and then converted into mm by calculating the number of pixels in an artificial pupil with a known size. Room illumination was adjusted following the luminance adjustment procedures reported in Zekveld, Kramer, and Festen (Citation2010) to avoid floor and ceiling effects. For each participant, pupil size was recorded in a bright (room brightness at 263 lux and screen brightness at 123 cd/m2) and a dark setting (room brightness at 0.28 lux and screen brightness at 0.0019 cd/m2). Room lighting and screen brightness were then adjusted to achieve a pupil size that was in the middle range of the bright and the dark setting. The pupil size of the right eye was measured for all participants. Calibration of the camera was performed before the start of the listening task. The camera of the eye tracker was calibrated by asking participants to fixate on a black circle that periodically appeared at one of nine different coordinate positions on the computer monitor. During the listening task, participants were asked to keep their gaze at a fixation cross that appeared in the middle of computer monitor. The luminance of the visual display did not change throughout the duration of the task. A rectangular “area of interest” was created in the centre of the visual display, and any erratic fixations (i.e. fixations that fell outside of this perimeter) were removed from the analysis. This limited the potential for any pupil size estimation errors caused by changes in gaze position away from the fixation cross.
Trials with more than 15% missing data between the start of the baseline period to the end of the retention period due to blinks, saccades, gaze position outside the defined interest area, or artefacts were excluded from the analysis (Zekveld, Kramer, and Festen Citation2011; Ohlenforst et al. Citation2017). Missing data points were replaced using linear interpolation and the data were smoothed using 5-point moving average.
After exclusion of trials containing artefacts, the remaining “accepted” trials were averaged to obtain two pupil measures for each participant: (1) a pre-stimulus pupil diameter and (2) a peak pupil diameter. The pre-stimulus pupil diameter was calculated as the average pupil size in the last second of noise, i.e. a 1-sec “noise alone” period, which preceded the presentation of the digits (e.g. Zekveld, Kramer, and Festen Citation2011; Koelewijn et al. Citation2012; Kramer, Teunissen, and Zekveld Citation2016). The peak pupil diameter was calculated relative to the pre-stimulus pupil diameter i.e. the mean pre-stimulus pupil diameter was subtracted from the peak pupil diameter on a per-participant basis. Trials for which incorrect responses were provided were not excluded from the analysis.
Analysis
Factor analysis
To address the first aim of the study, factor analysis (FA) was used to investigate the dimensionality of the VAS-F and the NASA-TLX items. The suitability of the data for a FA was confirmed using the Kaiser–Meyer–Olkin measure of sampling adequacy (KMO) test and Bartlett’s test of sphericity (Field Citation2009). Factors were identified based on eigenvalues greater than one (Field Citation2009). It was expected that the different factors would correlate with each other. Therefore, oblique rotation was considered appropriate for identifying how measures load into distinct factors (Field Citation2009).
Regression analysis
Correlations between the dependent and the independent variables suggested that linear models were suitable for the analysis. This was confirmed with the curve estimation function in SPSS for both of the regression models (IBM statistics SPSS version 22).
To address the second aim of the study, two hierarchical linear regression models were fitted. Peak pupil diameter was the dependent variable in model 1 and pre-stimulus pupil diameter was the dependent variable in model 2. In both models, age, hearing thresholds, performance on the digits-in-noise task (“task performance”), and distinct factors of VAS-F and the NASA-TLX were entered as predictors.
As age and hearing level are known to influence pupil diameter (for a recent review see Zekveld, Koelewijn, and Kramer Citation2018), they were entered in the first step of both of the models. The distinct factors of self-reported effort and fatigue were entered in the second step of the models in a step-wise manner as the potentially unique contributions of these predictors to peak pupil diameter/pre-stimulus pupil diameter in a digits-in-noise task are unknown. Task performance was entered in the third step of the models. Before performing the regression analysis, case-wise diagnostics and collinearity diagnostics were carried out and the Durbin-Watson statistic was calculated (model 1 d = 1.86; model 2 d = 1.73). Case-wise diagnostics identified 1 participant outlier in model 2. Therefore, for model 2, regression analysis was performed both with and without this participant to rule out any effect they might have had on the overall results of the regression analysis.
Collinearity diagnostics did not suggest that the outcomes of the regression model were influenced by multicollinearity based on the variance inflation factor (VIF) (Bowerman and O’Connell Citation1990) (model 1 mean VIF = 1.04, maximum VIF = 1.04; model 2 mean VIF = 1.05, maximum VIF = 1.07).
Results
Factor analysis
VAS-F
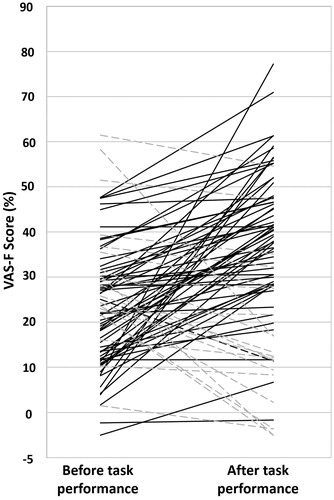
The difference in the VAS-F (Lee, Hicks, and Nino-Murcia Citation1991) scores before and after the digits-in-noise task was used for analysis. shows the average VAS-F score for each participant before and after performing the digits-in-noise task. The mean VAS-F scores before and after the listening task were 27.7% (SD: 15.3) and 36.7% (SD: 18.4), respectively. Nineteen listeners reported negative changes in VAS-F scores i.e. lower fatigue after completing the listening task. The mean change in VAS scores in these 19 listeners was −8% (range: −0.33% to −40.25%).
Figure 1. Self-reported fatigue scores (VAS-F) for individual participants before and after performing the digits-in-noise-task. Solid lines represent increased VAS-F scores after task performance. Dashed lines represent decreased VAS-F scores after task performance.
Results of a KMO test (0.86) indicated the adequacy of the sample size for a FA (Field Citation2009). Bartlett’s test of sphericity [X2 (153) = 1523.74, p < 0.001], indicated that correlations between the variables were sufficient for a FA. FA yielded 3 factors with eigenvalues >1 that explained about 77% of the total variance. Factor 1 explained around 46% of the variance, factor 2 explained around 20% of the variance, and factor 3 explained around 11% of the variance. provides details of the loading of each variable onto the different factors. To facilitate the interpretation of the data, low loadings of less than 0.30 are not shown (Field Citation2009). Both structure and pattern matrices yielded similar results, so only the pattern matrix is reported here. Oblique rotation resulted in items 1–5 loading into factor 3, items 6–10 loading into factor 2, and items 11 and 18 loading into factor 1. The scores of the questions that loaded to each factor were averaged to create three independent factors of the VAS-F. We refer to these independent factors as: VAS-1; items 1–5: tiredness/drowsiness, VAS-2; items 6–10: energy, VAS-3; items 11–18: exhaustion and physical fatigue (see Lee, Hicks, and Nino-Murcia (Citation1991) for descriptions of individual items).
Table 1. Pattern matrix: Factor loadings of the variables to each factor in the VAS-F.
Factor analysis supported the hypothesis that VAS-F assesses more than 2 subscales i.e. fatigue and energy. According to the VAS-F (Lee, Hicks, and Nino-Murcia Citation1991), items 1–5 and 11–18 belong to the fatigue subscale and items 6–10 belong to the energy subscale. Consistent with this interpretation, items 6–10 (the energy subscale) loaded into VAS-2: energy. However, the factor analysis grouped the “fatigue subscale” into 2 different factors; items 1–5 loaded into VAS-1 and items 11–18 into VAS-3. Based on the content of the VAS-F questions for these different factors we interpret VAS-1 as items that can be considered as synonyms for the word fatigue (e.g. tired, worn out). Therefore, they loaded into the same dimension. However, items that loaded in VAS-3 represent either a more extreme state of fatigue (e.g. exhausted) or physical effects resulting from fatigue (e.g. desire to lie down). Items in VAS-3 might have loaded into a distinct dimension because extreme states of mental fatigue and physical fatigue are unlikely to develop as a result of performing a brief speech-in-noise task.
NASA-TLX
The mean NASA-TLX (Hart and Staveland Citation1988) score was 35.7% (SD: 19.8). Results of a KMO test (0.78) indicated the adequacy of the sample size for a FA (Field Citation2009). Bartlett’s test of sphericity [X2 (15) = 159.26, p < 0.001], indicated that correlations between the variables were sufficient for a FA. FA yielded 2 factors with eigenvalues >1 that explained about 69% of the total variance. Factor 1 explained around 51% of the variance, and factor 2 explained around 18% of the variance. provides details of the loading of each variable onto the different factors. To facilitate the interpretation of the data, low loadings of less than 0.30 are not shown (Field Citation2009). Both structure and pattern matrices yielded similar results, so only the pattern matrix is reported here. Oblique rotation resulted in items 1, 2, 3, 5, and 6 loading into factor 1, and item 4 loading into factor 2 (see for descriptors of the items). The scores of the questions that loaded to factor 1 were averaged to create two independent factors of the NASA-TLX. These independent factors are referred to as: NASA-1: workload and NASA-2: performance.
Table 2. Pattern matrix: Factor loadings of the variables to each factor in the NASA-TLX.
Task performance
The performance accuracy in the main listening task ranged from 68 to 98% correct (M: 89%, SD: 6).
Pupillometry
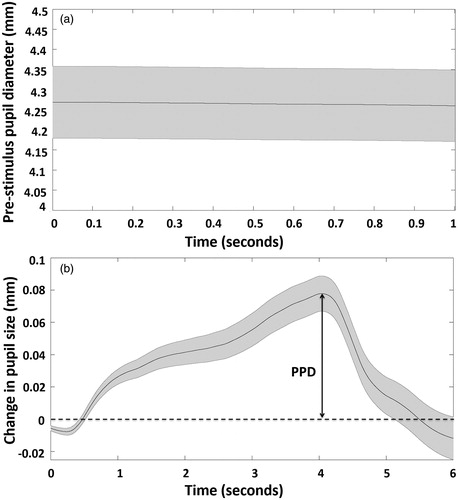
The mean raw pre-stimulus pupil diameter was 4.3 mm (±0.81 mm) and the mean peak pupil diameter, corrected to baseline, was 0.11 mm (±0.09 mm). shows the average pupil response during the pre-stimulus period (pre-stimulus pupil diameter) and shows the average pupil response during the speech presentation period. Peak pupil diameters presented in are corrected to baseline, i.e. the pre-stimulus period in the 1 second of noise that preceded speech presentation.
Figure 2. Time in seconds (0–1 sec: pre-stimulus period, 1–4 sec: speech presentation period, 4–6 sec: retention period) is shown on the x axis. Panel a shows mean (black line) pupil diameter during the 1-second pre-stimulus period. The shaded grey area represents ±1 SE. Panel b shows the mean change in pupil diameter, relative to pre-stimulus baseline during the speech presentation period and during the retention period. The shaded grey area represents ±1 SE. PPD: peak pupil diameter.
Correlations between the dependent and the independent variables
To aid with interpretation of the regression analyses, provides Pearson’s correlation coefficients between the dependent and independent variables entered into both regression models.
Table 3. Correlation coefficients (Pearson’s [r], 1-tailed significance) for the dependent (peak pupil diameter and pre-stimulus pupil diameter) and independent variables (PTA, age, VAS-1: tiredness/drowsiness, VAS-2: energy, VAS-3: exhaustion and physical fatigue, NASA-1: workload, NASA-2: performance, Task performance (RAU)) entered into the regression models.
Predictors of pupil size during the digits-in-noise listening task
In model 1, peak pupil diameter was not predicted by the first step of the model (R2 = 0.02, p = 0.52), which included PTA and age. Task performance, the 2 independent NASA-TLX factors and the 3 independent VAS-F factors, added in the second step of the model, did not result in a significant model fit.
shows the results of the regression analysis used to assess predictors of pre-stimulus pupil diameter, after excluding the participant outlier. In model 2, for predictors of pre-stimulus pupil diameter, the first step of the model (R2 = 0.06, p = 0.08), which included PTA and age, did not result in a significant model fit. At the second step, task performance, the 2 independent NASA-TLX factors and the 3 independent VAS-F factors, improved the model fit (R2 = 0.15, ΔR2 = 0.09, p = 0.008). The results shown in suggest that VAS-1 (tiredness/drowsiness) (β = −0.29, p = 0.008) is a unique contributor to this improvement in fit. At the third step, task performance further improved the model fit (R2 = 0.19, ΔR2 = 0.04, p = 0.04). The results shown in suggest that VAS-1 (tiredness/drowsiness) (β = −0.28, p = 0.008) and task performance (β = 0.25, p = 0.04) are unique contributors to this improvement in fit at the third model step. shows that smaller pre-stimulus pupil diameter was associated with increased self-reported, task-related fatigue. shows that larger pre-stimulus pupil diameter was associated with increased performance accuracy.
Figure 3. a. Relation between partial regressions for pre-stimulus pupil diameter and a sub-dimension of self-reported fatigue (VAS-1; tiredness/drowsiness), when hearing level and age are taken into account. Smaller pre-stimulus pupil diameter is associated with increased self-reported fatigue. b. Relation between partial regressions for pre-stimulus pupil diameter and performance, when hearing level and age are taken into account. Larger pre-stimulus pupil diameter is associated with increased performance accuracy.
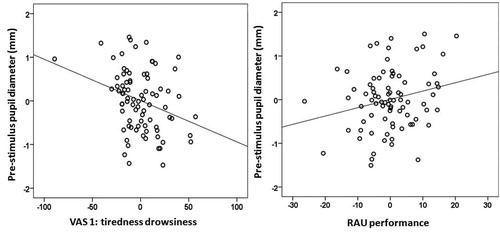
Table 4. Model 2: Linear model predictors (PTA, age, VAS-1: tiredness/drowsiness, task performance) of pre-stimulus pupil diameter.
When predictors of pre-stimulus pupil diameter were analysed with the participant outlier included, the model fit for the first step was not significant (R2 = 0.07, p = 0.07). The fit at the second step was significant (R2 = 0.15, p = 0.006) and the association between VAS-1 (β = −0.29, p = 0.008) and pre-stimulus pupil diameter remained. However, there was no significant association between task performance and pre-stimulus pupil diameter when the participant outlier was included.
Discussion
Listening-related fatigue is commonly reported by individuals with hearing impairment (Alhanbali et al. Citation2017, Citation2019). The assessment of self-reported fatigue is of potential importance in clinical settings as it provides insight into individuals’ perception of an important impact of hearing impairment not indexed by standard audiometric indices. Self-report measures have often been used to interpret potential behavioural and physiological measures of fatigue. Objective measures (including both behavioural and physiological measures) are also of potential benefit for the assessment of listening-related fatigue in clinical settings. However, objective measures of listening-related fatigue are currently lacking. The identification of an objective measure of listening-related fatigue may provide an objective assessment of the benefit derived from using listening devices and improve the quality of hearing rehabilitation by tapping into aspects of listening difficulties that are not currently assessed by standard audiometric tools. Although any behaviourally or physiologically measured benefit (reduced fatigue) might be of minimal clinical importance if not subjectively reported, being able to objectively quantify how much improvement the patient gains would provide a useful index for the assessment of benefit or the assessment of a clinically meaningful difference. For example, if behavioural or physiological methods are more sensitive to changes in fatigue than self-report measures.
The association between self-reported fatigue and changes in pupillometric indices can also provide insights into the ability to predict the experience of fatigue in daily life from individual differences in pupil responses (e.g. Wang et al. Citation2018). This is particularly important given the lack of association that has been often reported between hearing levels and self-reported fatigue (e.g. Hornsby and Kipp Citation2016; Alhanbali et al. Citation2017). For example, Wang et al. (Citation2018) hypothesised that the assessment of pupillometric responses in laboratory settings can provide insights into individuals’ experience of fatigue, which can potentially predict their motivation to exert effort in different listening situations in daily life, as suggested by the FUEL (Pichora-Fuller et al. Citation2016).
Pupillometry may provide objective measures of listening-related effort/fatigue (Ohlenforst et al. Citation2017; Wang et al. Citation2018; but also see Koelewijn et al. Citation2018). In the present study, FA was applied to self-reported measures of both task-related fatigue i.e. VAS-F (Lee, Hicks, and Nino-Murcia Citation1991) and task-related effort i.e. NASA-TLX (Hart and Staveland Citation1988). FA was applied to assess whether different sub-dimensions of these self-reported measures are associated with peak pupil diameter and/or pre-stimulus pupil diameter. Then, the associations between peak pupil diameter/pre-stimulus pupil diameter, task performance and task-related, self-reported listening effort and fatigue were investigated, while controlling for known confounds of pre-stimulus pupil diameter/peak pupil diameter, including age and hearing thresholds (e.g. Zekveld, Koelewijn, and Kramer Citation2018).
No association was identified between peak pupil diameter and task performance or self-reported, task-related listening fatigue or listening effort. However, smaller pre-stimulus pupil diameter was associated with higher scores on a distinct dimension of VAS-F (VAS-1: tiredness/drowsiness) but not self-reported listening effort. Smaller pre-stimulus pupil diameter was also associated with poorer task performance. The present results suggest that pre-stimulus pupil diameter has potential as an objective measure of fatigue related to listening tasks.
Factor analysis of VAS-F and NASA-TLX
The multidimensionality of the fatigue subscale supports the argument that VAS-F is unable to measure fatigue as a distinct symptom (LaChapelle and Finlayson Citation1998). Item loadings of the VAS-F (Lee, Hicks, and Nino-Murcia Citation1991) may be consistent with the arguments of Hockey (Citation2013) who suggested that physical and mental fatigue are two distinct phenomena. According to Hockey (Citation2013), physical and mental fatigue have different origins and occur as a result of different types of work. In physical fatigue, the musculature and cardiovascular system are activated in order for the body to move or to maintain its posture. Fatigue that is of physical origin tends to be associated with inability of the cardio-respiratory system and musculature to maintain oxygen transport and energy production. In the case of mental fatigue, depletion of energy, as a result of performing mental tasks, tends to be associated with changes in the pattern of the brain activity that can include glucose metabolism, blood flow and oxygen take-up, and changes in the difference between oxygenated and deoxygenated blood between resting and task conditions. Items in VAS-3 might have loaded into a distinct dimension because extreme states of mental fatigue and physical fatigue are unlikely to develop as a result of performing a brief speech-in-noise task.
Correlation analyses (see ), uncorrected for multiple comparisons, suggested that peak pupil diameter is correlated with VAS-1 (tiredness/drowsiness) and VAS-3 (exhaustion and physical fatigue) but these associations did not survive after controlling for age and hearing levels in the first stage of the regression model. Correlation analyses also suggested that pre-stimulus pupil diameter is correlated with VAS-1 (tiredness/drowsiness), VAS-3 (exhaustion and physical fatigue), and task performance. However, VAS-1 (tiredness/drowsiness) and task performance were the only factors that were significantly associated with pre-stimulus pupil diameter, after taking into account age and hearing levels in the regression model. The items that loaded into VAS-1 (tiredness/drowsiness) are potentially a more sensitive measure of task-related listening fatigue than the full VAS-F questionnaire.
The NASA-TLX (Hart and Staveland Citation1988) assesses a number of workload dimensions that tend to be associated with task performance. The different dimensions of the NASA-TLX are considered a single variable. Therefore, according to Hart and Staveland (Citation1988), the amount of workload associated with task performance equals the average response to the different items in the NASA-TLX. Here, all of the items in the NASA-TLX loaded into a single dimension with the exception of the item “performance”. Given the nature of the listening task and the fact that most participants had a hearing impairment, we expected the task to have a similar impact on participant perceptions of task load across a number of domains (mental demand, temporal demand, effort and frustration) indexed by the NASA-TLX. However, the fact the physical demand loaded into NASA-1 was not expected, particularly given that the physical fatigue was identified as an independent dimension in the VAS-F. It is possible that asking participants to maintain a fixed posture while performing the task was demanding and resulted in physical demand being perceived as a dimension of the workload. However, it seems that the amount of physical demand was not perceived as large enough to result in physical fatigue.
Performance may have loaded into a single dimension (NASA-2: performance) due to a possible relationship between participants’ perceptions of task performance level and the amount of work invested during the task, i.e. one might anticipate successful performance if perceived effort investment is high. Alternatively, if perceived effort investment is high, one might infer the task has a high difficulty level and expect poor performance.
The nature of the response scale for the different items in the NASA-TLX might also have contributed to the finding that performance loaded into an independent dimension. In the NASA-TLX, the scale for the different items places highest demands towards the right end and the lowest demands towards the left end, e.g. a participant who experienced a lot of effort would place a mark towards the right end of the scale. When considering performance, the scale is coded backwards: The right end of the performance scale is poorest performance while the left end of the scale is best performance, e.g. if performance is perceived to be close to a 100%, a mark needs to be placed towards the left end of the scale. This might have been confusing for participants who may be associating “high” values with the right side of each scale and therefore using marks on the right-hand of the scale to indicate good performance.
Pre-stimulus pupil diameter and self-reported fatigue
In the present study, VAS-1, which we interpret to represent tiredness/drowsiness, was found to be negatively correlated with pre-stimulus pupil diameter. These findings are consistent with Hopstaken et al. (Citation2015) who identified a relationship between smaller pre-stimulus pupil diameter and (i) increased self-reported fatigue, which was assessed by asking participants to rate their experience of fatigue on a scale ranging from 1 to 10 in response to the question “how fatigued are you”, and (ii) decreased performance accuracy during a 2-hr visual task. Hopstaken et al. (Citation2015) suggested that changes in pre-stimulus pupil diameter index fatigue that develops over the course of performing a task and also indicates reduced task engagement. Our results extend the findings of Hopstaken et al. (Citation2015) by suggesting that: (i) the association between self-reported task-related fatigue and pre-stimulus pupil diameter also applies for auditory tasks, and (ii) individual differences in the experience of fatigue can be predicted by pre-stimulus pupil diameter even in tasks of relatively short duration. This effect persists after controlling for age and hearing levels, which are established confounds of pupil diameter (Zekveld, Koelewijn, and Kramer Citation2018).
The negative correlation between pre-stimulus pupil diameter and VAS-1 (tiredness/drowsiness) is consistent with the suggestion that increased pre-stimulus pupil diameter generally reflects increased alertness, corresponding to enhanced sensitivity of the cognitive system to different inputs, which is likely to decline with increased fatigue (van der Meer et al. Citation2010; Koelewijn et al. Citation2014). The current results are also consistent with studies that reported decreased pupil size with time-on-task which may indicate an effect of fatigue and levels of task engagement on pre-stimulus pupil diameter (see Zekveld, Koelewijn, and Kramer Citation2018 for a review). The association between smaller pre-stimulus pupil diameter and poor task performance is consistent with the hypothesis that reduced task engagement can result in impaired task performance (Hopstaken et al. Citation2015; Pichora-Fuller et al. Citation2016).
Peak pupil diameter and self-reported fatigue
Wang et al. (Citation2018) investigated the relationship between pupillometry and self-reported measures of fatigue in daily life. Wang et al. (Citation2018) found that smaller peak pupil diameter was linked with increased self-reported fatigue, as assessed by NFR but not the CIS. The association between peak pupil diameter and NFR, but not with the CIS, might be because NFR assesses early symptoms of fatigue at work (van Veldhoven and Broersen Citation2003) while the CIS assesses chronic fatigue (Vercoulen et al. Citation1994). Wang et al. (Citation2018) suggested that decreased peak pupil diameter in fatigued participants might be an indication of reduced task engagement as a result of fatigue. In contrast, Koelewijn et al. (Citation2018) did not find a significant association between NFR scores and peak pupil diameter. The reason(s) for this discrepancy are unclear but they may relate to one or more of the following: (i) in Koelewijn et al. (Citation2018), motivation was manipulated by rewarding correct responses with a financial incentive. This approach might have limited the amount of fatigue developed during the experiment and masked any effect it might have had on peak pupil diameter, (ii) all of the participants recruited in Koelewijn et al. (Citation2018) had normal hearing while Wang et al. (Citation2018) included a group of participants with normal hearing and a group of participants with hearing impairment, who are more likely to experience listening-related fatigue (Alhanbali et al. Citation2017), and (iii) when participants completed the NFR In Koelewijn et al. (Citation2018), participants completed the questionnaire before performing the listening task while participants in Wang et al. (Citation2018) completed it at the end of the speech-in-noise task.
The results of the regression analysis presented here suggested that individual differences in self-reported, task-related fatigue did not predict peak pupil diameter. It should be noted that both Koelewijn et al. (Citation2018) and Wang et al. (Citation2018) asked participants to rate their experience of fatigue in daily life using the NFR scale. Here, participants were asked to rate the experience of fatigue associated with performance on the listening task using VAS-F (Lee, Hicks, and Nino-Murcia Citation1991). None of the VAS-F sub-dimensions were related to peak pupil diameter, after controlling for age and hearing thresholds. Taken together, these results suggest that the choice of self-reported fatigue measure may impact the potential relationship between peak pupil diameter and self-reported fatigue. Alternatively, when assessing fatigue associated with task performance, peak pupil dilation might be more sensitive to the experience of fatigue that develops over the course of performing a lengthy task (e.g. Hopstaken et al. Citation2015; Zekveld, Kramer, and Festen Citation2010).
It is also important to consider the possibility that pre-stimulus pupil diameter and peak pupil diameter are not completely independent. In the present study there was an association between pre-stimulus pupil diameter and peak pupil diameter (see ). Nevertheless, we did not find any associations between peak pupil diameter and self-reported fatigue after controlling for potential confounding factors.
The results of the regression analysis also suggested that individual differences in age, hearing level and task performance did not predict peak pupil diameter. The lack of a significant effect of hearing level on peak pupil diameter might be due to the use of a hearing aid by most of the participants who took part in the present study, as the use of a hearing aid may have partially compensated for the hearing impairment. The absence of an influence of age on peak pupil diameter might be to the limited age range of the participants recruited in this study, as all of them were older adults.
Exploratory correlation analyses presented in suggested direct associations between peak pupil diameter and sub-dimensions of VAS-F (VAS-1: tiredness/drowsiness and VAS −3: exhaustion and physical fatigue), consistent with Alhanbali et al. (Citation2019). However, after controlling for hearing level and age, the associations between peak pupil diameter and these VAS-F sub-dimensions were no longer significant. Hearing level and age were not significantly correlated with peak pupil diameter (see ) but adding these predictors into the regression analyses moderated the association between peak pupil diameter and VAS-F sub-dimensions. This result suggests that it may be important to consider potential confounding factors, including age and hearing level, in future studies of associations between self-reported fatigue and peak pupil diameter.
The need for a measure of listening-related fatigue
Within the field of audiology, listening-related fatigue has been investigated using scales that assess fatigue in individuals’ everyday life such as NFR and the CIS (Wang et al. Citation2018), or using scales that can be used to assess fatigue associated with task performance such as the VAS-F (Alhanbali et al. Citation2019). Others have developed scales that are specific for the purpose of their studies i.e. ask participants about their experience of fatigue after performing a demanding task (e.g. Hornsby Citation2013).
The absence of standardised scales for the assessment of fatigue in individuals with hearing impairment has led to variability in the self-reported scales used in the assessment of listening-related fatigue. This variability has likely contributed to the lack of consistent results across the studies investigating the correlation between self-reported fatigue and pre-stimulus pupil diameter/peak pupil diameter (Ohelnforst et al. Citation2017; Wang et al. Citation2018, Koelewijn et al. Citation2018). Drawing definitive conclusions regarding the ability of behavioural/physiological measures to tap into the perceived experience of listening-related fatigue remains challenging. Further research is required to identify the tools that are most appropriate for the purpose of investigating the relationship between the perceived experience of listening-related fatigue and fatigue assessed using objective/physiological measures. Research efforts should be invested in the development of hearing-specific scales that can be used for the assessment of fatigue in everyday life and fatigue associated with task performance within the field of audiology. The results presented here suggest that the VAS-1 sub-dimension (tiredness/drowsiness), identified through FA, has potential as measure of task-related, self-reported fatigue that can be linked with pre-stimulus pupil diameter, i.e. an objective measure of listening fatigue.
Conclusions
Smaller pre-stimulus pupil diameter is associated with higher levels of task-related, self-reported listening fatigue. Smaller pre-stimulus pupil diameter is also associated with higher hearing thresholds, consistent with models suggesting a role of motivation on levels of task engagement (e.g. FUEL; Pichora-Fuller et al. Citation2016): individuals with poorer hearing levels may perceive listening tasks to be more challenging and therefore feel less motivated to engage with the task. Current findings suggest that pre-stimulus pupil diameter might be a potential objective index of task-related listening fatigue (as measured by VAS-1: tiredness/drowsiness) that can be used in clinical settings to improve hearing rehabilitation in individuals with hearing impairment.
Disclosure statement
No potential conflict of interest was reported by the author(s).
Additional information
Funding
References
- Alhanbali, S., P. Dawes, S. Lloyd, and K. J. Munro. 2017. “Self-Reported Listening-Related Effort and Fatigue in Hearing-Impaired Adults.” Ear Hear 38: e39–e48. doi:https://doi.org/10.1097/AUD.0000000000000361.
- Alhanbali, S., P. Dawes, R. E. Millman, and K. J. Munro. 2019. “Measures of Listening Effort Are Multidimensional.” Ear Hear 4: 1–14.doi: https://doi.org/10.1097/AUD.0000000000000697.
- Aston-Jones, G., and J. D. Cohen. 2005. “An Integrative Theory of Locus Coeruleus-Norepinephrine Function: Adaptive Gain and Optimal Performance.” Annual Review of Neuroscience 28: 403–450. doi:https://doi.org/10.1146/annurev.neuro.28.061604.135709.
- Bowerman, B. L., and R. T. O’Connell. 1990. Linear Statistical Models: An Applied Approach, 2nd ed. Belmont, CA: Duxvury Press.
- British Society of Audiology. 2018. Pure tone air and bone conduction threshold audiometry with and without masking [Online]. Accessed 20 November 2020. https://www.thebsa.org.uk/wp-content/uploads/2018/11/Recommended-Procedure-Pure-Tone-Audiometry-August-2018-FINAL.pdf.
- Field, A. 2009. Discovering Statistics Using SPSS. London: Sage Publications.
- Gilzenrat, M. S., S. Nieuwenhuis, M. Jepma, and J. D. Cohen. 2010. “Pupil Diameter Tracks Changes in Control State Predicted by the Adaptive Gain Theory of Locus Coeruleus Function.” Cognitive, Affective & Behavioral Neuroscience 10 (2): 252–269. doi:https://doi.org/10.3758/CABN.10.2.252.
- Hart, S. G., and L. E. Staveland. 1988. “Development of NASA-TLX (Task Load Index): Results of Empirical and Theoretical Research.” Adv Psychol 52: 139–183. doi:https://doi.org/10.1016/S0166-4115(08)62386-9.
- Hockey, R. 2013. The Psychology of Fatigue: Work, Effort and Control. Cambridge: University Press.
- Hopstaken, J., D. van der Linden, A. Bakker, and M. Kompier. 2015. “A Multifaceted Investigation of the Link between Mental Fatigue and Task Disengagement.” Psychophysiology 52 (3): 305–315. doi:https://doi.org/10.1111/psyp.12339.
- Hornsby, B. W. Y., and A. M. Kipp, 2016. "Subjective Ratings of Fatigue and Vigor in Adults with Hearing Loss are Driven by Perceived Hearing Difficulties not Degree of Hearing Loss." Ear Hear 37: 1–10.
- Hornsby, B. W. Y. 2013. “The Effects of Hearing Aid Use on Listening Effort and Mental Fatigue Associated with Sustained Speech Processing Demands.” Ear and Hearing 34 (5): 523–534. doi: 10.1097/AUD.0b013e31828003d8. doi:https://doi.org/10.1097/AUD.0b013e31828003d8.
- Hornsby, B. W. Y., G. Naylor, and F. H. Bess. 2016. “A Taxonomy of Fatigue Concepts and Their Relation to Hearing Loss.” Ear Hear 37: 136S–144S. doi:https://doi.org/10.1097/AUD.0000000000000289.
- Koelewijn, T., B. G. Shinn-Cunningham, A. A. Zekveld, and S. E. Kramer. 2014. “The Pupil Response is Sensitive to Divided Attention during Speech Processing.” Hearing Research 312: 114–120. doi:https://doi.org/10.1016/j.heares.2014.03.010.
- Koelewijn, T., A. A. Zekveld, J. M. Festen, and S. E. Kramer. 2012. “Pupil Dilation Uncovers Extra Listening Effort in the Presence of a Single-Talker Masker.” Ear Hear 32: 291–300. doi:https://doi.org/10.1177/2331216518777174.
- Koelewijn, T., A. A. Zekveld, T. Lunner, and S. E. Kramer. 2018. “The Effect of Reward on Listening Effort as Reflected by the Pupil Dilation Response.” Hearing Research 367: 106–112. doi:https://doi.org/10.1016/j.heares.2018.07.011.
- Kramer, S. E., C. E. Teunissen, and A. A. Zekveld. 2016. “Cortisol, Chromogranin A, and Pupillary Responses Evoked by Speech Recognition Tasks in Normally Hearing and Hard-of-Hearing Listeners: A Pilot Study.” Ear and Hearing 37 (suppl 1): 126S–135S. doi:https://doi.org/10.1097/AUD.0000000000000311.
- LaChapelle, D., and M. Finlayson. 1998. “An Evaluation of Subjective and Objective Measures of Fatigue in Patients with Brain Injury and Healthy Controls.” Brain Injury 12 (8): 649–659. doi:https://doi.org/10.1080/026990598122214.
- Lee, K. A., G. Hicks, and G. Nino-Murcia. 1991. “Validity and Reliability of a Scale to Assess Fatigue.” Psychiatry Research 36 (3): 291–298. doi:https://doi.org/10.1016/0165-1781(91)90027-m.
- McGarrigle, R., P. Dawes, A. Stewart, S. Kuchinsky, and K. Munro. 2017. “Pupillometry Reveals Changes in Physiological Arousal during a Sustained Listening Task.” Psychophysiology 54 (2): 193–203. doi:https://doi.org/10.1111/psyp.12772.
- McGarrigle, Ronan, Kevin J. Munro, Piers Dawes, Andrew J. Stewart, David R. Moore, Johanna G. Barry, Sygal Amitay, et al. 2014. “Listening Effort and Fatigue: What Exactly Are we Measuring? A British Society of Audiology Cognition in Hearing Special Interest Group ‘White Paper’.” International Journal of Audiology 53 (7): 433–440. doi:https://doi.org/10.3109/14992027.2014.890296.
- McShefferty, D., W. M. Whitmer, I. R. C. Swan, and M. Akeroyd. 2013. “The Effect of Experience on the Sensitivity and Specificity of the Whispered Voice Test: A Diagnostic Accuracy Study.” BMJ Open 3 (4): e002394–9. doi:https://doi.org/10.1136/bmjopen-2012-002394.
- Miles, K., C. McMahon, I. Boisvert, R. Ibrahim, et al. 2017. “Objective Assessment of Listening Effort: coregistration of Pupillometry and EEG.” Trends Hear 21: 1–13. doi: https://doi.org/10.1177/2331216517706396.
- Obleser, Jonas, Malte Wöstmann, Nele Hellbernd, Anna Wilsch, and Burkhard Maess. 2012. “Adverse Listening Conditions and Memory Load Drive a Common α Oscillatory Network.” The Journal of Neuroscience: The Official Journal of the Society for Neuroscience 32 (36): 12376–12383. doi:https://doi.org/10.1523/JNEUROSCI.4908-11.2012.
- Ohlenforst, B., A. A. Zekveld, T. Lunner, D. Wendt, G. Naylor, Y. Wang, N. J. Versfeld, et al. 2017. “Impact of Stimulus-Related Factors and Hearing Impairment on Listening Effort as Indicated by Pupil Dilation.” Hear Res 351: 68–79. doi:https://doi.org/10.1016/j.heares.2017.05.012.
- Petersen, E. B., M. Wöstmann, J. Obleser, S. Stenfelt, et al. 2015. “Hearing Loss Impacts Neural Alpha Oscillations under Adverse Listening Conditions.” Frontiers in Psychology. 6: 1–11. doi: https://doi.org/10.3389/fpsyg.2015.00177.
- Pichora-Fuller, M. Kathleen, Sophia E. Kramer, Mark A. Eckert, Brent Edwards, Benjamin W. Y. Hornsby, Larry E. Humes, Ulrike Lemke, et al. 2016. “Hearing Impairment and Cognitive Energy: The Framework for Understanding Effortful Listening (FUEL).” Ear and Hearing 37: 5S–27S. doi:https://doi.org/10.1097/AUD.0000000000000312.
- Piquado, T., D. Isaacowitz, and A. Wingfield. 2010. “Pupillometry as a Measure of Cognitive Effort in Younger and Older Adults.” Psychophysiology 47 (3): 560–569. doi:https://doi.org/10.1111/j.1469-8986.2009.00947.x.
- Sternberg, S. 1966. “High-Speed Scanning in Human Memory.” Science 153 (3736): 652–654. doi:https://doi.org/10.1126/science.153.3736.652.
- Strand, Julia F., Violet A. Brown, Madeleine B. Merchant, Hunter E. Brown, and Julia Smith. 2018. “Measuring Listening Effort: Convergent Validity, Sensitivity, and Links with Cognitive and Personality Measures.” Journal of Speech, Language, and Hearing Research: JSLHR 61 (6): 1463–1486. doi:https://doi.org/10.1044/2018_JSLHR-H-17-0257.
- Studebaker, G. 1985. “A ‘Rationalized’ Arcsine Transform.” Journal of Speech and Hearing Research 28 (3): 455–462. doi:https://doi.org/10.1044/jshr.2803.455.
- van der Meer, Elke, Reinhard Beyer, Judith Horn, Manja Foth, Boris Bornemann, Jan Ries, Juerg Kramer, et al. 2010. “Resource Allocation and Fluid Intelligence: Insights from Pupillometry.” Psychophysiology 47 (1): 158–169. doi:https://doi.org/10.1111/j.1469-8986.2009.00884.x.
- van Veldhoven, M., and S. Broersen. 2003. “Measurement Quality and Validity of the “Need for Recovery Scale.” Occupational and Environmental Medicine. 60 (suppl): i3–9. doi:https://doi.org/10.1136/oem.60.suppl_1.i3.
- Vercoulen, J. H., C. M. Swanink, J. F. Fennis, J. M. Galama, J. W. van der Meer, and G. Bleijenberg. 1994. “Dimensional Assessment of Chronic Fatigue Syndrome.” Journal of Psychosomatic Research 38 (5): 383–392. doi:https://doi.org/10.1016/0022-3999(94)90099-X.
- Wang, Yang, Graham Naylor, Sophia E. Kramer, Adriana A. Zekveld, Dorothea Wendt, Barbara Ohlenforst, Thomas Lunner, et al. 2018. “Relations between Self-Reported Daily-Life Fatigue, Hearing Status, and Pupil Dilation during a Speech Perception in Noise Task.” Ear and Hearing 39 (3): 573–582. doi:https://doi.org/10.1097/AUD.0000000000000512.
- Wendt, D., T. Dau, and J. Hjortkjar. 2016. “Impact of Background Noise and Sentence Complexity on Processing Demands during Sentence Comprehension.” Frontiers in Psychology. 7: 1–12. doi: https://doi.org/10.3389/fpsyg.2016.00345.
- Zekveld, A., T. Koelewijn, and S. Kramer. 2018. “The Pupil Dilation Response to Auditory Stimuli: Current State of Knowledge.” Trends Hear 22: 1–25. doi:https://doi.org/10.1177/2331216518777174.
- Zekveld, A. A., S. E. Kramer, and J. M. Festen. 2010. “Pupil Response as an Indication of Effortful Listening: The Influence of Sentence Intelligibility.” Ear and Hearing 31 (4): 480–490. doi:https://doi.org/10.1097/AUD.0b013e3181d4f251.
- Zekveld, A. A., S. E. Kramer, and J. M. Festen. 2011. “Cognitive Load during Speech Perception in Noise: The Influence of Age, Hearing Loss, and Cognition on the Pupil Response.” Ear and Hearing 32 (4): 498–510. doi:https://doi.org/10.1097/AUD.0b013e31820512bb.
- Zhao, S., G. Bury, A. Milne, and M. Chait. 2019. “Pupillometry as an Objective Measure of Sustained Attention in Young and Older Listeners.” Trends in Hearing 23: 233121651988781.doi:https://doi.org/10.1177/2331216519887815.