
Abstract
Objective
Primarily to understand whether clinically relevant factors affect the International Outcome Inventory (IOI-HA) scores and to examine if IOI-HA scores improve when renewing the hearing aids (HA) for experienced users. Secondly, to estimate the overall HA effectiveness using the IOI-HA.
Design
A prospective observational study.
Study sample
In total, 1961 patients with hearing loss were included. All patients underwent a hearing examination, were fitted with HAs, and answered the IOI-HA. Factor analysis of IOI-HA separated the items into a Factor 1 (use of HA, perceived benefits, satisfaction, and quality of life) and Factor 2 (residual activity limitation, residual participation restriction and impact on others) score.
Results
Degree of hearing loss, word recognition score, motivation, HA usage time, tinnitus, asymmetry, and sex were significantly associated with total IOI-HA, Factor 1, or Factor 2 scores. The seven IOI-HA items increased on average by 0.4 (p < 0.001) when renewing HAs. The total median IOI-HA score at follow-up was 29 (7) for experienced (n = 460) and first-time users (n = 1189), respectively.
Conclusions
Degree of hearing loss, word recognition score, motivation, tinnitus, asymmetry, and sex may be used to identify patients who require special attention to become successful HA users.
1. Introduction
Self-reported outcomes in terms of hearing aid (HA) effectiveness are fundamental to measure the success of a HA treatment. A key aspect of a successful HA treatment is a satisfied HA-user, which should be the natural outcome of every HA fitting. Hence, investigating the satisfaction of the HA-user is an ongoing concern in hearing rehabilitation. Studies have suggested that approximately 20% of older adults with hearing loss (HL) are dissatisfied with their HAs and do not use these regularly (Kochkin Citation2009; Hartley et al. Citation2010). A consequence of unsuccessful HA fittings is multiple re-visits in clinics and a negative impact on the quality of life of the patient and their significant others (Arlinger Citation2003; Cunningham and Tucci Citation2017; Elberling et al., Citation1989). Several studies have tried to discover why people are not satisfied with their HAs and what makes people achieve a successful HA uptake (Laplante-Lévesque, Hickson, and Worrall Citation2012; Meyer and Hickson Citation2012; McCormack and Fortnum Citation2013). Nevertheless, the underlying reasons for a low HA uptake are still not fully understood, and this emphasises the importance of investigating the determinants of a successful HA treatment.
HA effectiveness can be assessed in numerous ways, and the number of patient-reported outcome questionnaires has increased considerably over the last decade (Granberg et al. Citation2014). Some popular instruments for measuring HA benefit include the Abbreviated Profile of Hearing Aid Benefit (Cox and Alexander Citation1995), and the Speech, Spatial, and Qualities of Hearing Scale (SSQ) (Gatehouse and Noble Citation2004), that were designed to assess the individual’s perception of their listening capabilities in various situations, and thus provide a measure of subjective hearing status. One of the most well-known and widely used questionnaires to measure the effectiveness of a HA treatment is the standardised multi-dimensional International Outcome Inventory for Hearing Aids (IOI-HA) (Cox et al. Citation2000). It was developed as a result of an international scientific workshop in 2000 and intended for usage in research settings to make it possible to compare outcomes of HA fittings in seven different outcome domains across different countries and cultures. The original version was in English (Cox and Alexander Citation2002), but translations are available in many languages (Cox, Stephens, and Kramer Citation2002). The seven items are: (1) The use of HAs (Use), (2) The perceived benefits (Ben), (3) Residual activity limitation (RAL), (4) Satisfaction (Sat), (5) Residual participation restriction (RPR), (6) Impact on others (Ioth) and (7) Change in quality of life (QoL). All questions are intended to probe the experience during the recent past (2 weeks). Each item has five possible responses and proceeds from the worst possible outcome on the left to the best possible outcome on the right in each of the domains. The items are scored from 1 to 5, where a higher score indicates a better outcome in the specific domain. Originally, the IOI-HA was intended to be administered in a paper and pencil mode, but Thorén, Andersson, and Lunner (Citation2012) found that the IOI-HA can be administered in an online format with similar results and without compromising reliability. Jespersen et al. (Citation2005) found a problem with the interpretation of Item 5 in the Danish version because the Danish translation of Item 5 was not semantically clear. The semantic issue was remedied by a rewording in Item 5 from the word “indflydelse” (influence) to “begrænset” (limited) in Jespersen, Bille, and Legarth (Citation2014). The revised translation is used in this study.
Several studies have identified two subscales within the IOI-HA when performing a principal component analysis (Cox and Alexander Citation2002; Kramer et al. Citation2002; Brännström and Wennerström Citation2010; Jespersen, Bille, and Legarth Citation2014). Factor 1 includes Use, Ben, Sat, and QoL (Items 1, 2, 4 and 7), whereas Factor 2 includes RAL, RPR, and Ioth (Items 3, 5 and 6). Cox and Alexander (Citation2002) considered Factor 1 as “me and my HAs” describing the overall benefit with HAs, whereas Factor 2 was considered as “me and the rest of the world” describing the residual limitations after HA fitting. This underlines that the IOI-HA is not a strictly unidimensional measure and that the two factors explain different aspects of HA effectiveness. Cox and Alexander (Citation2002) discussed how the responses should be reported, either each item individually, the overall total score, or as two separate subscale scores – one for each factor. They implied that vital information might be lost if only using the total IOI-HA score, and the best choice would depend on the purpose when using the IOI-HA, whether it is intended for a clinical, administrative, or research purpose.
Previous research has investigated a range of potential predictors of successful HA outcomes using either the total IOI-HA score or the Factor 1 and Factor 2 score as an outcome measure. The studies indicated that the degree of HL in terms of Average Pure-Tone hearing thresholds at 0.5, 1, 2, and 4 kHz (PTA-4) is a significant factor for reported IOI-HA score (Jespersen, Bille, and Legarth Citation2014), as well as the duration of HL (Kramer et al. Citation2002), HA configuration (bi- vs. unilateral fitting) (Arlinger, Nordqvist, and Öberg Citation2017; Kramer et al. Citation2002), cost of HA (Liu et al. Citation2011), and experience with HAs (Jespersen et al. Citation2005; Williams, Johnson, and Danhauer Citation2009; Arlinger, Nordqvist, and Öberg Citation2017), and the studies yielded somewhat conflicting results. Williams, Johnson, and Danhauer (Citation2009) and Heuermann, Kinkel, and Tchorz (Citation2005) found no significant effects of age, gender, average HL, type of HA fitting, or HA experience (Nexp = using HAs for more than 3 months). Arlinger, Nordqvist, and Öberg (Citation2017) only found a significant effect of the degree of HL when using Factor 1 and Factor 2 scores as outcomes and therefore stated that differences in factor scores should be considered when comparing IOI-HA scores from different studies. Another clinically relevant factor that might affect the level of HA satisfaction is the degree of tinnitus. Using the APHAB and the Tinnitus Handicap Inventory (THI) (Newman, Jacobson, and Spitzer Citation1996) as main outcome measures, Andersson, Keshishi, and Baguley (Citation2011) found that tinnitus was associated with less benefit and more problems with HAs.
To identify patients needing more intensified counselling as part of their HA-treatment, we aimed to investigate the impact of clinical parameters (degree of HL, Word Recognition Scores (WRS), self-reported tinnitus using the THI questionnaire, HA configuration (unilateral or bilateral fitting), motivation for HA treatment, HA usage time, sex, and age) on IOI-HA Factor 1, 2, and total IOI-HA scores. Further, we explored the improvement in IOI-HA scores when renewing HAs in the experienced users. Finally, we aimed to estimate the overall level of satisfaction with HA treatment using IOI-HA and to study differences in IOI-HA Factors 1, 2 and total IOI-HA scores between experienced and first-time HA users.
2. Materials and methods
2.1. Study design and ethics
This study is part of the Danish national Better hEAring Rehabilitation project (BEAR), aiming to improve hearing rehabilitation in Denmark and worldwide. The study was conducted as a prospective observational cohort study. Data were collected from Departments of Audiology at Odense University Hospital (OUH), Region of Southern Denmark and Aalborg University Hospital (AAUH), North Denmark Region from January 2017 to January 2018. The project has been evaluated by The Regional Committee on Health Research Ethics for Southern Denmark (S-20162000-64).
2.2. Population and procedure
Data was collected in a population of 2447 adults (≥18 years of age) with HL and included both first-time and experienced HA users. All experienced users had at least 4 years of HA experience. Private ENT specialists referred all patients to one of the two Departments of Audiology in Denmark; the Department of Audiology, OUH, and the Department of Audiology, AAUH. At OUH, patients were informed about the study and invited to participate by their private ENT, whereas, at AAUH, all first-time HA users were already booked for hearing examination and sent an invitation to participate in the study 2 weeks before their scheduled visit. Acceptance to participate was noted in the referral letter. Prior to the first visit to the clinic, all patients received an e-mail, including information on study details, a consent form, and a letter on the patient’s rights related to study participation. Acceptance to participate was received from 1961 patients.
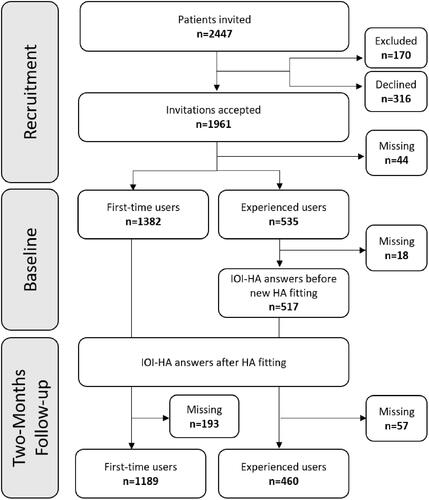
Patients were excluded from the study if they were candidates for cochlear implantation or had known cognitive limitations preventing them from answering or filling out the questionnaires. At any time, patients were free to decline participation. Some patients chose to reject the HA treatment or went to a private vendor instead. A total of 1189 first-time users and 460 experienced users completed the IOI-HA at follow-up and were included in the study ().
Figure 1. Trial Profile. Numbers of completed International Outcome Inventory for Hearing Aids (IOI-HA) answers from baseline and follow-up for first-time and experienced hearing aid (HA) users are shown.
2.3. Measurements
2.3.1. Questionnaires
The questionnaires were sent to all patients 2 weeks prior to the first visit to the clinic. The questionnaires were; a non-standardised health-related questionnaire containing questions on demographic details such as sex, age, HA experience, motivation, and tinnitus. The THI questionnaire was included if patients answered they had experienced “ringing” in the ears, and the IOI-HA questionnaire was sent if patients were experienced HA users at the time of inclusion. The IOI-HA and THI questionnaires were re-sent 2 weeks before the follow-up visit, that was scheduled to take place approximately 2 months following HA fitting. A question from an online motivation tool developed by the Ida Institute (idainstitute.com) was used to assess the patient’s motivation for HA treatment. The question read: “How important is it for you to improve your hearing?” The response scale ranged from 0 to 10, where a higher score indicates a higher motivation (Clark Citation2010).
All questionnaires were compiled and managed using the Research Electronic Data Capture (REDCap) tools developed by Vanderbilt University, Nashville, Tennessee, United States (Harris et al. Citation2009, Citation2019) hosted by Odense Patient Explorative Network in the Region of Southern Denmark. Patients received the questionnaires through an online link generated by REDCap to their private digital mailbox (e-Boks), but a paper-and-pencil version was also available at the clinic if they did not have access to the online version. These responses were then manually entered into the database.
2.3.2. Audiological assessment
As a part of current clinical practice in Denmark, all patients underwent: standard audiometry, which consisted of a pure-tone audiometry measuring air-conduction thresholds at 0.25, 0.50, 1, 2, (3), 4, (6) and 8 kHz; bone-conduction thresholds at 0.25–4 kHz when needed; and a measure of WRS. Air- and bone-conduction thresholds were measured according to ISO8253-1:2010 (International Organisation for Standardization), and TDH39 headphones or ER-3A insert earphones were used during the tests. The WRS was obtained by presenting 25 different monosyllabic words in quiet at the most comfortable listening level from the Dantale-I wordlists developed by Elberling et al. (1989). WRS is expressed in the percentage of correct responses to the words presented. The measurements took place in a soundproof booth in one of the two Audiological Departments and were carried out by experienced audiologists.
2.4. Hearing aid fitting and follow-up visit
Patients were fitted with HAs from one of three participating HA manufacturers (with a basic or a more advanced HA from each manufacturer). According to current clinical practice, the decision on the type of HA was based on patients individual hearing need that was assessed by the audiologists.
All HAs were free of charge as part of the Danish public health care system. A semi-balanced design with an intended representation of approximately 25% for each of the three HA manufacturers was applied to avoid the dominance of a specific HA product and accompanying fitting paradigm. Randomisation was independent of individual factors such as age, sex, and degree of HL. The remaining approximately 25% were fitted with other HAs suitable for the given patient and available in the clinics. All HAs used in the study were representative of the HAs that were available by the public tender in Denmark and therefore also available for the participating clinics.
Patients were fitted with HAs by experienced audiologists according to the proprietary fitting algorithms suggested by the specific HA manufacturer, or on some rare occasions, with standard fitting rationales. If relevant and possible for the given HA, patients were given instructions in volume adjustment, and program options and gain levels were adjusted if the sound was perceived as too loud or too high pitched. First-time HA users were given additional counselling on how to use their HAs. Approximately 2 months after HA fitting, a follow-up appointment was scheduled for all patients where the HA usage time was extracted from the fitting software, and HAs were adjusted depending on the patient’s need and type of problem. Real-ear measurements were performed both before and after any adjustments for the documentation but not used as the basis for adjusting the HAs, which follows current clinical traditions that rarely apply real-ear based adjustments. The follow-up visit was carried out by the same audiologist in Aalborg and two audiologists in Odense, and the mean follow-up time in this study was 73 d (SD = 34).
2.5. Statistical analysis
Average pure-tone hearing thresholds (PTA-4) were calculated as the average of hearing thresholds at 0.5, 1, 2, and 4 kHz for each ear. The degree of HL was defined using the Global Burden of Disease classification (Stevens et al. Citation2013; Shield Citation2006) and includes the categories: Normal (<20 dB HL); mild (20–34 dB HL); moderate (35–49 dB HL); moderate-severe (50–64 dB HL); severe (65–79 dB HL), and; profound (>81 dB HL). Due to a low number of participants within the “severe” and “profound” HL groups, these two groups were merged into one “severe and profound” group.
The different statistical analyses performed in the study are presented in and describes the type of statistical test that was used in the analysis to test the different hypotheses of the study. Significance levels were set at p < 0.05 for the multiple linear regression analyses (command regress in STATA). Due to highly left-skewed data distribution, bootstrapping was applied to the model with 5000 replications, but this did not cause any significant changes in the results; hence the analysis is presented without bootstrapping. Variance inflation factor (VIF) was used to test multi-collinearity between independent variables in all linear regression models and showed no indications for multi-collinearity (VIF < 2.5). The model tested the hypothesis that the outcomes of either total IOI-HA, Factor 1, or Factor 2 scores were affected by the degree of HL with reference to mild HL based on the Global Burden of Disease classification, WRS, motivation, HA usage time, HA configuration, self-reported tinnitus (patients reporting more than slight symptoms (THI score > 16) based on the THI severity scale), asymmetry defined as PTA-4 difference >10 dB HL, sex, and age.
Table 1. Statistical analyses performed in the study and the type of statistical tests used in these analyses.
As it has recently been pointed out (Leijon et al. Citation2020) that IOI-HA does not behave well when handled as a metric scale, we, therefore, applied the item specific category weights suggested in Leijon et al. (Citation2020) as a supplementary analysis and repeated the main analysis on the resulting IOI-HA scores. Moreover, as an additional sensitivity analysis, we applied ordinal logistic regression to the raw IOI-HA scores to investigate if this resulted in consistent estimates. Bonferroni–Holm was used to adjust for multiple comparisons.
Data management and analyses were performed using STATA SE version 16.0 (Stata Corp., College Station, TX).
3. Results
3.1. Response rate
shows the trial profile. Seventy percent of the 1961 included patients were first-time users. At baseline, 97% of the experienced users responded and completed the IOI-HA. At follow-up, 86% of first-time users and 89% of the experienced users responded to the IOI-HA.
3.1.1. Identification of IOI-HA factor 1 and 2 in the study population
Although the PCA analysis presumes interval-scale properties, a principal component analysis PCA was used to extract the two significant factors from the IOI-HA responses recorded at the follow-up to compare results with previous studies. However, PCA based on Polychoric correlation that assumes the variable as ordered measurement of an underlying continuum was also performed. It fetched similar results compared to PCA based on Pearson correlation, justifying the use of standard PCA to compare our results with previous studies. provides the loading of IOI-HA items on each factor after PCA with varimax rotation (n = 1648) along with the factor loadings found by Cox and Alexander (Citation2002) for comparison. Factor 1 was dominated by Items 1, 2, 4 and 7, whereas Factor 2 was dominated by Items 3, 5 and 6.
Table 2. Factor loadings for each of the seven IOI-HA items on each extracted factor after principal component analysis with varimax rotation (n = 1643).
3.2. Demographics and level of IOI-HA total, Factor 1, and Factor 2 scores
shows patient characteristics among first-time and experienced users responding to the IOI-HA questionnaire. For experienced users at baseline, 40% were women with a mean age of 66.3 years (SD13.5), whereas men had a higher mean age of 68.8 years (SD10.6). In first-time users at follow-up, 44% were women with a mean age of 66.1 years (SD12.2), and men had a mean age of 67.0 years (SD10.0). On average, first-time users were 1.8 years younger than experienced users (95%CI: −2.98; −0.57, p < 0.01).
Table 3. Population characteristics.
3.2.1. Differences in the degree of hearing loss, hearing aid usage time, motivation, and degree of tinnitus between first-time and experienced users
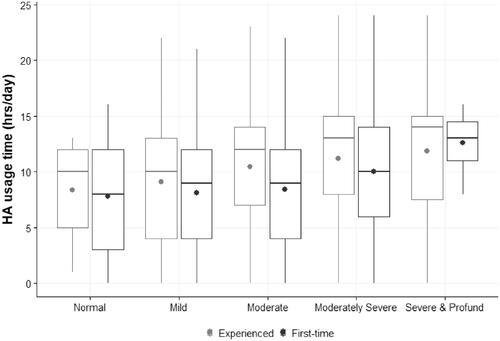
When comparing the degree of HL in terms of Better Ear Average (BEA) and WRS for the better hearing ear between the two groups of HA users, the experienced users had 11.1 dB HL (95%CI: 9.8; 12.4, p < 0.001) higher BEA thresholds and the median WRS was 7% points (z = −9.0, p < 0.001) lower than first-time users. Using BEA, the most frequent type of HL among the experienced users was moderate HL (44% baseline and 45% follow-up), whereas mild HL (46%) was the most frequent type of HL among first-time users. In total, 97% of experienced and 95% of first-time users were bilaterally fitted with HA. Median data (Inter-Quartile Range) logged HA usage time per day was 12 (7.0) h and 9 (8.0) for experienced and first-time users, respectively, hence experienced users used their HAs 3 h (z = 7.4, p < 0.001) more per day. HA usage time was significantly different in the different degrees of HL in first-time users [χ2(4) = 13.8, p < 0.01] and experienced users [χ2(4) = 17.4, p < 0.01]. The correlation between data logged HA usage time, and degree of HL is shown in and shows that HA usage time increases as the degree of HL increases. Comparing group medians showed that experienced users reported 1.4 higher motivation scores than first-time users (z = 11.2, p < 0.001).
Figure 2. Boxplots showing distribution of data logged hearing aid usage time by degree of hearing loss in experienced and first-time users. The thick horizontal lines show medians, dot shows the mean, the lower and upper edges of the boxes show the first and third quartiles, and the whiskers indicate 10th and 90th percentiles.
In total, 46% of experienced and 45% of first-time users responded to the THI questionnaire. No significant difference in median THI score was found at follow-up between the two groups of HA users (z = 0.76, p = 0.45).
3.2.2. Differences in the level of total IOI-HA, Factor 1, and Factor 2 scores between first-time and experienced users
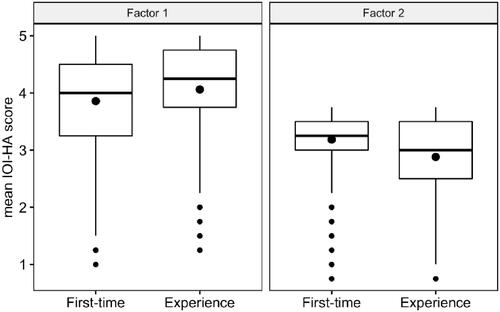
No statistically significant difference in median total IOI-HA score was found at follow-up between experienced and first-time HA users (z = 0.8, p = 0.4). Mean and median scores are presented for each of the seven items at follow-up in . The figure shows that the mean scores of the different items ranged from 3.6 to 4.6 for experienced users with the highest score in Use (Item 1) and the lowest score in RAL (Item 3). In first-time users, the mean scores ranged from 3.6 to 4.4, with the highest score in Ioth (Item 6) and the lowest score in QoL (Item 7). There was a statistically significant difference in group medians of each item between first-time and experienced users (Item1: z = −6.8, p < 0.001; Item2: z = −3.6, p < 0.001; Item3: z = 7.0, p < 0.001; Item4: z = −4.7, p < 0.001; Item5: z = 6.7, p < 0.001; Item6: z = 9.3, p < 0.001), except for item 7 (z = −0.7, p = 0.5). The differences in Factor 1 and Factor 2 scores between the two groups of HA users are shown in . The experienced users reported a median Factor 1 score that was 1.0 (z = 4.3, p < 0.001) higher than first-time users, but they also reported a median Factor 2 score that was 1.0 (z = −8.6, p < 0.001) lower than first-time users. However, the clinical relevance of a difference in the IOI-HA Factor score around 1.0 is low.
Figure 3. Boxplots showing International Outcome Inventory for Hearing Aids (IOI-HA) scores by level of hearing aid experience. The thick horizontal lines show medians, thick dot shows the mean, the lower and upper edges of the boxes show the first and third quartiles, and the whiskers indicate 10th and 90th percentiles. Outliers are marked with a dot. Usage time (Use), Benefit (Ben), Residual Activity Limitation (RAL), Satisfaction (Sat), Residual Participation Restriction (RPR), Impact on others (Ioth), and Quality of Life (QoL).
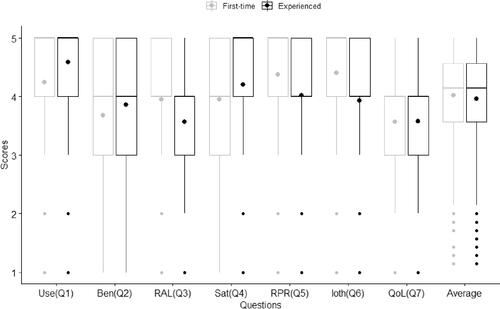
Figure 4. Boxplots showing International Outcome Inventory for Hearing Aids (IOI-HA) Factor 1 (Benefit) and Factor 2 (Residual difficulty) scores at follow-up by level of hearing aid (HA) experience. The thick horizontal lines show medians, thick dot shows the mean, the lower and upper edges of the boxes show the first and third quartiles, and the whiskers indicate 10th and 90th percentiles. Outliers are marked with a dot.
3.3. Factors associated with total IOI-HA, Factor 1, and Factor 2 scores
The results from the regression analyses are presented in . For comparison, results from the corresponding regression models on the IOI-HA with the weights suggested by Leijon et al. (Citation2020) are reported in Supplementary Table 1. This sensitivity analysis and the analysis applying ordinal logistic regression instead (results not shown), resulted in estimates consistent with the main analysis. Bonferroni–Holm corrected p values for original and IRT corrected IOI-HA scores are presented in Supplementary Tables 2A and 2B.
Table 4. Multiple linear regression analysis for International Outcome Inventory for Hearing Aids (IOI-HA) Factor 1, Factor 2, and total IOI-HA follow-up scores in first-time (n = 1090) and experienced (n = 417) users.
3.3.1. Factors significantly affecting Factor 1 scores
Results from the model show that patients with moderate HL reported a mean Factor 1 score that was 0.8 units higher in first-time users (95%CI: 0.4; 1.2, p < 0.001) and 1.0 units higher in the experienced users (95%CI: 0.3; 2.0, p < 0.01) compared to patients with mild HL. Using PTA-4 as a continuous variable instead of the discrete categories, the Factor 1 score increased by 0.04 (95%CI: 0.01; 0.07, p = 0.01) units for every one dB HL increase in PTA-4 in first-time users. No significant association was found in the experienced users. Analysis of the effect of motivation on Factor 1 scores showed that Factor 1 score increased by 0.3 (95%CI: 0.2; 0.4, p < 0.001) units for every one unit increase in motivation score in first-time users only. HA usage time had a significant and positive effect on all IOI-HA scores in both groups of HA users. In first-time and experienced users, the Factor 1 score increased by 0.4 (95%CI: 0.3; 0.4, p < 0.001) and 0.2 (95%CI: 0.1; 0.3, p < 0.001) units, respectively, for every 1-h increase in HA usage time. However, HA usage time is naturally correlated with Factor 1 due to self-reported HA usage time implemented in Factor 1 which needs to be considered when interpreting the results. Female experienced users reported a Factor 1 score that was 0.9 (95%CI: −1.6; −0.3, p < 0.01) units lower than experienced male users, and experienced users with asymmetric HL reported 0.8 (95%CI: 0.02; 1.6, p < 0.05) higher Factor 1 scores than experienced users with symmetric HL.
3.3.2. Factors significantly affecting Factor 2 scores
First-time users with moderate, moderate to severe, and severe & profound HL reported a Factor 2 score that was 0.4 (95%CI: −0.7; −0.1, p < 0.01), 0.7 (95%CI: −1.3; −0.2, p < 0.01) and 2.4 (95%CI: −4.0; −0.8, p < 0.01) units lower, respectively, compared to patients with mild HL. Experienced users with moderate to severe and severe and profound HL reported 0.8 (95%CI: −1.6; −0.01, p < 0.01) and 2.1 (95%CI: −3.4; −0.9, p < 0.001) lower Factor 2 scores, respectively, compared to experienced users with mild HL. Using PTA-4 as a continuous variable, Factor 2 scores decreased by 0.06 (95%CI: −0.09; −0.02, p < 0.01) units for every one dB HL increase in PTA-4 in the experienced users only. Mean Factor 2 score increased by 0.4 (95%CI: 0.2; 0.5, p < 0.001) units for every 10% increase in WRS in first-time users only. Mean Factor 2 scores decreased by 0.1 (95%CI: −0.2; −0.1, p < 0.001) units and 0.3 (95%CI: −0.5; −0.1, p < 0.001) units for every one unit increase in motivation score in first-time and experienced users respectively. This indicates that the HA does not work as intended in the involved social environments despite being highly motivated to use it.
The Factor 2 score increased by 0.1 (95%CI: 0.06; 0.1, p < 0.001) units in first-time users and 0.1 (95%CI: 0.02; 0.1, p < 0.001) units in the experienced users for every 1-h increase in HA usage time. No significant effect of HA configuration was found on either the Factor 1 or Factor 2 scores, but the number of unilaterally fitted patients was low, hence unlikely to cue any significance.
Patients with tinnitus (defined as THI score > 16) reported 0.5 (95%CI: −0.8; −0.2, p < 0.001) lower Factor 2 score than patients without tinnitus. If including tinnitus as THI score at follow-up, a total number of 504 and 193 responses from first-time and experienced users respectively who also have tinnitus and completed the THI questionnaire were analysed. In first-time and experienced users, the Factor 2 score decreased by 0.2 (95%CI: −0.3; −0.1, p < 0.001) and 0.1 (95%CI: −0.6; −0.1, p < 0.05) units respectively if THI score increased by ten. First-time users with asymmetric HL reported 0.3 (95%CI: −0.6; −0.02, p < 0.05) lower Factor 2 score than first-time users with symmetric HL, and experienced female users reported a Factor 2 score that was 0.9 (95%CI: −1.6; −0.3, p < 0.05) lower than men.
3.3.3. Improvement of IOI-HA scores when renewing hearing aids in experienced users
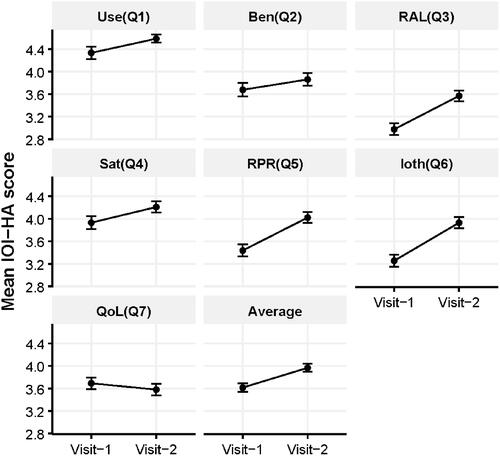
To investigate the improvement in IOI-HA scores when experienced users received new HAs, mean and median IOI-HA scores for all seven items, Factor 1, and Factor 2 scores at baseline, were compared to that at follow-up. shows the change in mean scores for each of the seven items and the average of all seven items from baseline to follow-up in the experienced users (n = 458). Using the non-parametric Wilcoxon signed-rank test, results showed that the IOI-HA rank score for each of the seven items increased significantly (Item1: z = 4.6, p < 0.001; Item2: z = 3.0, p < 0.01; Item3: z = 9.6, p < 0.001; Item4: z = 4.2, p < 0.001; Item5: z = 9.9, p < 0.001; Item6: z = 10.7, p < 0.001) except for Item 7 (z = 1.2, p = 0.3), and the average increase in median IOI-HA item score was 0.4 (z = 8.2, p < 0.001). Factor 1 and Factor 2 rank scores increased significantly (z = 2.8, p < 0.01) and (z = 12.1, p < 0.001) respectively.
Figure 5. Mean score changes with each of the seven International Outcome Inventory for Hearing Aids (IOI-HA) items and the average of all seven items from baseline (visit 1) to follow-up (visit 2) in experienced users (n = 460). Error bars show standard error of the mean. Use time (Use), Benefit (Ben), Residual Activity Limitation (RAL), Satisfaction (Sat), Residual Participation Restriction (RPR), Impact on others (Ioth), Quality of Life (QoL).
4. Discussion
Results from the regression analyses showed that depending on HA experience, the degree of HL, WRS, motivation, HA usage time, self-reported tinnitus, asymmetry, and sex all significantly affected either Factor 1, Factor 2, or total IOI-HA scores.
4.1. Factors significantly affecting Factor 1 scores
The degree of HL (in terms of patients with moderate HL compared to patients with mild HL) positively and most strongly affected Factor 1 scores in both groups of HA users, hence showed to be the most important factor for the perceived HA benefit. This could reflect that patients with a moderate HL are in a higher need of HA than patients with mild HL due to a more severe HL. This result is consistent with Jespersen, Bille, and Legarth (Citation2014), who found a weak positive correlation between PTA-4 and Items 1 and 4. Hickson, Clutterbuck, and Khan (Citation2010) also found that those with higher HL reported overall better outcomes, but this was a considerably smaller effect on the total IOI-HA scores and in patients with severe to profound HL only. HA usage time also showed to be an important factor for reported HA benefit in both groups of HA users and indicates reported HA benefit increases when the HA is used more. The effect is strongest on first-time users and could be explained by the median HA use time of experienced users being higher than first-time users, thus have less scope of improvement. However, the natural mathematical correlation between usage time and Item 1 needs to be considered when discussing the effect of HA usage time on perceived benefit.
The motivation for HA treatment positively affected HA benefits only in first-time users. As experienced users are highly motivated towards HA treatment, the scope of improvement is limited. This finding is consistent with other studies that showed readiness was the strongest predictor for self-reported HA satisfaction and benefit in first-time users (Ferguson, Woolley, and Munro Citation2016).
Experienced users with asymmetrical HL reported higher benefits with their HAs than experienced users with symmetrical HL. This could be because they are experiencing a better benefit from more advanced HA technology, but since the specific signal processing applied to the HAs are unknown, the reason for this effect is unclear.
In contrast to earlier studies that did not show any significant gender differences (Heuermann, Kinkel, and Tchorz Citation2005; Hickson, Clutterbuck, and Khan Citation2010; Liu et al. Citation2011; Jespersen, Bille, and Legarth Citation2014; Arlinger, Nordqvist, and Öberg Citation2017), this study found a strong effect of experienced female users reporting less HA benefit than males. Age had a small significant positive effect on HA benefit in first-time users. Nevertheless, the effect was small and not clinically relevant.
4.2. Factors significantly affecting Factor 2 scores
The degree of HL negatively and most strongly affected the Factor 2 scores in both groups of HA users; hence it was the most important factor for reporting residual difficulties with HAs. This is in accordance with previous studies that also showed a negative correlation between the degree of HL and Factor 2 scores (Kramer et al. Citation2002; Jespersen, Bille, and Legarth Citation2014; Arlinger, Nordqvist, and Öberg Citation2017). It is expected that patients with a more severe HL report more residual difficulties with their HAs and most likely reflects that these patients experience more problems when they communicate despite being fitted with HAs. WRS was another important factor for the perceived residual difficulties but in first-time users only and might indicate that better WRS could result in reporting fewer residual difficulties after HA treatment. This effect is expected because the WRS reflects the discrimination abilities of the patients, which are important when communicating in noisy environments.
Motivation showed to have a negative effect on reporting residual limitations with the strongest effect in the experienced users and suggests that even though a higher motivation increases the perceived benefit for the patient; it also might result in more remaining difficulties following HA treatment. It could be speculated that the HAs do not meet the high expectations of highly motivated patients. However, this effect has not been shown in other studies.
Data logged HA usage time had a small positive effect on Factor 2 scores in first-time and experienced users and indicated that fewer residual limitations are reported when using the HAs more. These findings could be useful to report when counselling patients that the more they use their HAs, the higher the chances of a better HA outcome.
First-time users with asymmetric HL reported significantly more limitations than those with symmetric HL and might indicate that, despite being fitted with HAs, the asymmetric HL yields greater challenges when communicating. However, the effect size was small and hence not clinically relevant.
Tinnitus, defined as reporting more than slight symptoms based on the THI severity scale, was the second most important factor for reporting more residual limitations in first-time users. One could speculate that these patients are especially annoyed by their tinnitus when communicating with others and might be more socially reluctant due to their tinnitus. Including only patients responding to the THI questionnaire in the regression analysis, results showed that also experienced users with tinnitus reported significantly more limitations.
Sex showed to be the second most important factor for reporting more residual problems in the experienced users. Experienced female users reported significantly more difficulties than males, and this indicates that women with HA experience tend to report more residual difficulties of the HAs than men. Kramer et al. (Citation2002) and Arlinger, Nordqvist, and Öberg (Citation2017) found similar results and suggested this difference could be related to women, in general, being more socially active than men. One might also speculate, if women have higher expectations and, thus, being more disappointed after using HAs for a while, but the underlying reasons are not further investigated.
Even though the results suggest that the degree of HL, WRS, motivation, HA usage time, tinnitus, asymmetry, and sex to some extent are significant predictors of IOI-HA as an outcome measure, the IOI-HA should not be used as the only instrument for probing HA effectiveness. Cox and Alexander (Citation2002) underline that the IOI-HA was intended to be used as a supplement to existing outcome measures and not as a substitute. This analysis shows general trends that can be used to identify patients more likely to end up with an unsuccessful HA treatment and therefore need special attention in the clinic. However, it is important to remember that it does not give detailed information for personalised counselling on becoming a successful HA user.
4.3. Improved level of satisfaction when renewing hearing aids in the experienced users
The significant increase in average mean IOI-HA item score of 0.4 from baseline to follow-up in the experienced users indicates that their reported HA effectiveness improved when receiving new HAs. However, a study by Smith, Noe, and Alexander (Citation2009), based on 131 HA users, found a critical difference score to be used when comparing IOI-HA outcomes for individuals between two sessions. Their findings showed a 95% chance that an observed change of one response unit between two test sessions reflects an actual change in outcome for any item on the IOI-HA. Comparing the differences in each item score from baseline to follow-up in our study with the critical values listed in in Smith, Noe, and Alexander (Citation2009), only the increase in Items 3, 5, and 6 (Factor 2) reflects a true outcome change following new HAs. The Factor 2 scores increased by 1.9 (SD 3.0) from baseline to follow-up. Thus, the improved level of HA effectiveness is related to the fact that experienced users report significantly fewer residual difficulties after being fitted with new HAs. Further research is required to establish changes in the IOI-HA outcomes when renewing HAs in the experienced users.
4.4. Hearing aid effectiveness in first-time and experienced hearing aid users
Mean total IOI-HA scores of 27.8 (SD 5.4) and 28.2 (SD 4.8) for experienced and first-time users, respectively, generally indicate a high level of HA effectiveness. A recent Danish study (Jespersen, Bille, and Legarth Citation2014) found a similar IOI-HA total score of 28.0 (SD 4.8) in a population of 281 adults. Two more extensive and recent studies (Liu et al. Citation2011; Arlinger, Nordqvist, and Öberg Citation2017) with 1049 and 106,631 subjects respectively, also found similar, but slightly lower, mean total scores of 26.7 and 26.3 and shows the results from the current study are at a comparable level with previous studies.
4.5. Identification of IOI-HA Factor 1 and Factor 2 in the study population
Results from the PCA showed that the factor loadings for each IOI-HA item were similar to those found by Cox and Alexander (Citation2002) and other previous studies (Kramer et al. Citation2002; Brännström and Wennerström Citation2010; Jespersen, Bille, and Legarth Citation2014). Thus, the identification of Factor 1 and Factor 2 as two separate principal components is consistent across studies.
The mean Factor 1 and Factor 2 scores in this study were at a comparable level with Jespersen, Bille, and Legarth Citation2014. This study found Factor 1 scores of respectively 15.4 and 16.2 for first-time and experienced users compared to 17.0 in Jespersen, Bille, and Legarth (Citation2014). Further, mean Factor 2 scores in this study were respectively 12.7 and 11.5, compared to 11.0 in Jespersen, Bille, and Legarth (Citation2014).
4.6. Comparing first-time and experienced users
Unsurprisingly, results indicated that experienced users suffer from a more severe HL, and also, they are older than first-time HA users; therefore, hearing is affected by aging. The data logged usage time showed that experienced HA users also had a higher HA usage time (2.1 h more per day than first-time users) as well as a higher motivation, which could be explained by experienced users having a more severe HL, thus a higher need for their HAs, and it also might explain that the experienced users were remedied to a greater extent by their HA. Analysis using objective data logged HA use time has found that patients with a more severe HL used their HAs more and relates to a study by Brännström and Wennerström (Citation2010), who found a significant positive correlation between Item 1(Use) and PTA-4. However, Item 1 is based on the subjective reporting of usage time, and since previous studies found that users tend to overreport their daily amount of HA use (Laplante-Lévesque et al. Citation2014), this correlation does not reflect the exact HA use time. Analysing differences in Factor 1 and 2 scores, it was shown that experienced users reported a higher benefit, yet they also reported more residual limitations with their HAs compared to first-time users which are consistent with results from Arlinger, Nordqvist, and Öberg (Citation2017). Differences in Factor 1 scores are probably related to experienced users having a more severe HL and thus benefiting more from their HAs. In contrast, differences in Factor 2 scores indicate that a more severe HL also results in more difficulties when communicating in background noise.
4.7. Strengths and limitations
One of the main advantages of this study was the prospective design and the large study population. However, some limitations may still apply as there might have been a positive selection bias if only patients highly motivated for HA treatment participated. Additionally, it can be speculated whether patients less satisfied with their HAs are less likely to accept the invitation and complete the questionnaires. With response rates of respectively 86% and 89% at follow-up, selection bias cannot be completely ruled out, but these potential problems are almost impossible to avoid in observational studies. In addition, less satisfied patients may have been more reluctant to participate in follow-up, thus limiting the study by the lack of this information. The mean follow-up time in this study was 73 (±34) d. Given that some studies suggest 3 months acclimatisation period, it can be considered a limitation. Another limitation to this study is the lack of reported hearing disability, which was found as a stronger predictor of HA outcome than PTA-4 by Knudsen et al. (Citation2010). However, this study included WRS that also relates to hearing difficulty even though it is not a reported measure, and the WRS was measured in quiet.
5. Conclusions
The degree of HL was an important factor for perceived HA benefit and for reporting more residual limitations with HA. The motivation for HA treatment was also an important factor when it comes to HA benefit in first-time users, but it negatively impacted the reported residual limitations and impact on others in both groups of HA users. HA usage time had a positive impact on overall HA outcomes in both groups of HA users. Another interesting finding was that self-reported tinnitus had a negative impact on the residual problems with HAs in first-time users. In addition, it was shown that women with HA experience report poorer HA outcomes and more residual limitations than men. Therefore, depending on the level of experience with HAs, different clinical factors predict if the patient should have special attention in the clinic to become successful HA users. The experienced users improved their IOI-HA score when receiving new HAs and were related to reporting fewer residual difficulties when fitted with new HAs. Further research is required to establish if changes in IOI-HA scores reflect a clinically relevant change in HA effectiveness.
Altogether, these findings suggest that the solution for a successful HA treatment is multi-dimensional, and several factors should therefore be considered when prescribing HAs for patients with HL. Even though the results from this study do not give detailed information for structuring a personalised rehabilitation plan on how to become a successful HA user, it is evident that the degree of motivation and actual use-time with HAs are important factors for successful HA treatment. On the other hand, special attention should also be given to highly motivated patients with considerable HL, women with HA experience or patients with poor speech recognition or asymmetric hearing as these patients could benefit from additional counselling in the clinic in order to understand the benefits and limitations of the HA treatment. Additionally, patients with tinnitus may also need special attention as tinnitus negatively impacts the perceived HA outcome.
TIJA-2020-08-0439-File009.docx
Download MS Word (38.2 KB)Acknowledgements
Collaboration and support by Innovation Fund Denmark (Grand Solutions 5164-00011B), Oticon, GN Hearing, Widex-Sivantos Audiology, and other partners (Aalborg University Hospital, Odense University Hospital, University of Southern Denmark, Aalborg University, Technical University of Denmark, FORCE Technology and, Copenhagen University Hospital) are sincerely acknowledged. The authors would like to thank the participating patients and the staff of the two Audiological Departments in Aalborg and Odense.
Disclosure statement
No potential conflict of interest was reported by the author(s).
References
- Andersson, G., A. Keshishi, and D. M. Baguley. 2011. “Benefit from Hearing Aids in Users with and without Tinnitus.” Audiological Medicine 9 (2): 73–78. doi:https://doi.org/10.3109/1651386X.2011.570914
- Arlinger, S. 2003. “Negative Consequences of Uncorrected Hearing Loss—a Review.” International Journal of Audiology 42 (2): 17–20. doi:https://doi.org/10.3109/14992020309074639
- Arlinger, S., P. Nordqvist, and M. Öberg. 2017. “International Outcome Inventory for Hearing Aids: Data from a Large Swedish Quality Register Database.” American Journal of Audiology 26 (3S): 443–450. doi:https://doi.org/10.1044/2017_AJA-16-0123
- Brännström, K. J., and I. Wennerström. 2010. “Hearing Aid Fitting Outcome: Clinical Application and Psychometric Properties of a Swedish Translation of the International Outcome Inventory for Hearing Aids (IOI-HA).” Journal of the American Academy of Audiology 21 (8): 512–521.
- Clark, J. G. 2010. “The Geometry of Patient Motivation: Circles, Lines, and Boxes.” Audiology Today : 22, 32–40.
- Cox, R. M., and G. C. Alexander. 1995. “The Abbreviated Profile of Hearing Aid Benefit.” Ear and Hearing 16 (2): 176–186. doi:https://doi.org/10.1097/00003446-199504000-00005
- Cox, R. M., and G. C. Alexander. 2002. “The International Outcome Inventory for Hearing Aids (IOI-HA): Psychometric Properties of the English Version.” International Journal of Audiology 41 (1): 30–35. doi:https://doi.org/10.3109/14992020209101309
- Cox, R. M., M. Hyde, S. Gatehouse, W. Noble, H. Dillon, R. Bentler, D. Stephens, et al. 2000. “Optimal Outcome Measures, Research Priorities, and International Cooperation.” Ear and Hearing 21 (4): 106S–115S. doi:https://doi.org/10.1097/00003446-200008001-00014
- Cox, R. M., D. Stephens, and S. E. Kramer. 2002. “Translations of the International Outcome Inventory for Hearing Aids (IOI-HA) Traducciones Del Inventario Internacional de Resultados Para Auxiliares Auditivos (IOI-HA).” International Journal of Audiology 41: 3–26. doi:https://doi.org/10.3109/14992020209101307
- Cunningham, L. L., and D. L. Tucci. 2017. “Hearing Loss in Adults.” New England Journal of Medicine 377 (25): 2465–2473. doi:https://doi.org/10.1056/NEJMra1616601
- Elberling, C., C. Ludvigsen, and P. E. Lyregaard. 1989. “Dantale: A New Danish Speech Material.” Scandinavian Audiology 18 (3): 169–175. doi:https://doi.org/10.3109/01050398909070742.
- Ferguson, M. A., A. Woolley, and K. J. Munro. 2016. “The Impact of Self-Efficacy, Expectations, and Readiness on Hearing Aid Outcomes.” International Journal of Audiology 55: S34–S41. doi:https://doi.org/10.1080/14992027.2016.1177214
- Gatehouse, S., and W. Noble. 2004. “The Speech, Spatial and Qualities of Hearing Scale (SSQ).” International Journal of Audiology 43 (2): 85–99. doi:https://doi.org/10.1080/14992020400050014
- Granberg, S., J. Dahlström, C. Möller, K. Kähäri, and B. Danermark. 2014. “The ICF Core Sets for Hearing Loss - Researcher Perspective. Part I: Systematic Review of Outcome Measures Identified in Audiological Research.” International Journal of Audiology 53 (2): 65–76. doi:https://doi.org/10.3109/14992027.2013.851799
- Harris, P. A., R. Taylor, B. L. Minor, V. Elliott, M. Fernandez, L. O’Neal, L. McLeod, et al. 2019. “The REDCap Consortium: Building an International Community of Software Platform Partners.” Journal of Biomedical Informatics 95: 103208. doi:https://doi.org/10.1016/j.jbi.2019.103208
- Harris, P. A., R. Taylor, R. Thielke, J. Payne, N. Gonzalez, and J. G. Conde. 2009. “Research Electronic Data Capture (REDCap)-a Metadata-Driven Methodology and Workflow Process for Providing Translational Research Informatics Support.” Journal of Biomedical Informatics 42 (2): 377–381. doi:https://doi.org/10.1016/j.jbi.2008.08.010
- Hartley, D., E. Rochtchina, P. Newall, M. Golding, and P. Mitchell. 2010. “Use of Hearing Aids and Assistive Listening Devices in an Older Australian Population.” Journal of the American Academy of Audiology 21 (10): 642–653.
- Heuermann, H., M. Kinkel, and J. Tchorz. 2005. “Comparison of Psychometric of the International Outcome Inventory for Hearing Aids (IOI-HA) in Various.” International Journal of Audiology 44 (2): 102–109. doi:https://doi.org/10.1080/14992020500031223
- Hickson, L., S. Clutterbuck, and A. Khan. 2010. “Factors Associated with Hearing Aid Fitting Outcomes on the IOI-HA.” International Journal of Audiology 49 (8): 586–595. doi:https://doi.org/10.3109/14992021003777259
- Jespersen, C. T., M. Bille, J. Groth, and T. Hansen. 2005. “Danish Reference Data for the IOI-HA Questionnaire.” In Hearing Aid Fitting. Copenhagen: 21st Danavox Symposium, edited by A. Rasmussen, T. Paulsen, T. Andersen, and C. Larsen, 475–492.
- Jespersen, C. T., M. Bille, and J. V. Legarth. 2014. “Psychometric Properties of a Revised Danish Translation of the International Outcome Inventory for Hearing Aids (IOI-HA).” International Journal of Audiology 53 (5): 302–308. doi:https://doi.org/10.3109/14992027.2013.874049
- Knudsen, L. V., M. Oberg, C. Nielsen, G. Naylor, and S. E. Kramer. 2010. “Factors Influencing Help Seeking, Hearing Aid Uptake, Hearing Aid Use and Satisfaction with Hearing Aids: A Review of the Literature.” Trends in Amplification 14 (3): 127–154. doi:https://doi.org/10.1177/1084713810385712
- Kochkin, S. 2009. “MarkeTrak VIII: 25-Year Trends in the Hearing Health Market.” The Hearing Review 16: 12–13.
- Kramer, S. E., S. T. Goverts, W. A. Dreschler, M. Boymans, and J. M. Festen. 2002. “International Outcome Inventory for Hearing Aids (IOI-HA): Reults from The Netherlands.” International Journal of Audiology 41 (1): 36–41. doi:https://doi.org/10.3109/14992020209101310
- Laplante-Lévesque, A., L. Hickson, and L. Worrall. 2012. “What Makes Adults with Hearing Impairment Take up Hearing Aids or Communication Programs and Achieve Successful Outcomes?” Ear and Hearing 33 (1): 79–93. doi:https://doi.org/10.1097/AUD.0b013e31822c26dc
- Laplante-Lévesque, A., C. Nielsen, L. D. Jensen, and G. Naylor. 2014. “Patterns of Hearing Aid Usage Predict Hearing Aid Use Amount (Data Logged and Self-Reported) and Overreport.” Journal of the American Academy of Audiology 25 (2): 187–198.
- Leijon, A., H. Dillon, L. Hickson, M. Kinkel, S. E. Kramer, and P. Nordqvist. 2020. “Analysis of Data from the International Outcome Inventory for Hearing Aids (IOI-HA) Using Bayesian Item Response Theory.” International Journal of Audiology 60 (2): 81–88.
- Liu, H., H. Zhang, S. Liu, X. Chen, D. Han, and L. Zhang. 2011. “International Outcome Inventory for Hearing Aids (IOI-HA): Results from the Chinese Version.” International Journal of Audiology 50 (10): 673–678. doi:https://doi.org/10.3109/14992027.2011.588966
- McCormack, A., and H. Fortnum. 2013. “Why Do People Fitted with Hearing Aids Not Wear Them?” International Journal of Audiology 52 (5): 360–368. doi:https://doi.org/10.3109/14992027.2013.769066
- Meyer, C., and L. Hickson. 2012. “What Factors Influence Help-Seeking for Hearing Impairment and Hearing Aid Adoption in Older Adults?” International Journal of Audiology 51 (2): 66–74. doi:https://doi.org/10.3109/14992027.2011.611178
- Newman, C. W., G. P. Jacobson, and J. B. Spitzer. 1996. “Development of the Tinnitus Handicap Inventory.” Archives of Otolaryngology - Head and Neck Surgery 122 (2): 143–148. doi:https://doi.org/10.1001/archotol.1996.01890140029007
- Shield, B. 2006. Evaluation of the Social and Economic Costs of Hearing Impairment. Belgium: hear-it AISBL.
- Smith, S. L., C. M. Noe, and G. C. Alexander. 2009. “Evaluation of the International Outcome Inventory for Hearing Aids in a Veteran Sample.” Journal of the American Academy of Audiology 20 (6): 374–380.
- Stevens, G., S. Flaxman, E. Brunskill, M. Mascarenhas, C. D. Mathers, and M. Finucane. 2013. “Global and Regional Hearing Impairment Prevalence: An Analysis of 42 Studies in 29 Countries.” European Journal of Public Health 23 (1): 146–152. doi:https://doi.org/10.1093/eurpub/ckr176
- Thorén, E. S., G. Andersson, and T. Lunner. 2012. “The Use of Research Questionnaires with Hearing Impaired Adults: Online vs. paper-and-Pencil Administration.” BMC Ear, Nose and Throat Disorders 12 (1): 12. doi:https://doi.org/10.1186/1472-6815-12-12
- Williams, V. A., C. E. Johnson, and J. L. Danhauer. 2009. “Hearing Aid Outcomes: Effects of Gender and Experience on Patients’ Use and Satisfaction.” Journal of the American Academy of Audiology 20 (7): 422–432.