
Abstract
Objective
Conventional directional hearing aid microphone technology may obstruct listening intentions when the talker and listener walk side by side. The purpose of the current study was to evaluate hearing aids that use a motion sensor to address listening needs during walking.
Design
Each participant completed two walks in randomised order, one walk with each of two hearing aid programs: (1) conventional beamformer adaptation that activated an adaptive, multiband beamformer in loud environments and (2) motion-based beamformer adaptation that activated a pinna-mimicking microphone setting when walking was detected. Participants walked along a pre-defined track and completed tasks assessing speech understanding and environmental awareness.
Study Sample
Participants were 22 older adults with moderate-to-severe hearing loss and experience using hearing aids.
Results
More participants preferred the motion-based than conventional beamformer adaptation for speech understanding, environmental awareness, overall listening, and sound quality (p < 0.05). Measures of speech understanding (p < 0.01) and localisation of sound stimuli (p < 0.05) were significantly better with motion-based than conventional beamformer adaptation.
Conclusions
The results suggest that hearing aid users can benefit from beamforming that uses motion sensor input to adapt the signal processing according to the user’s activity. The real-world setup of this study had limitations.
1. Introduction
Throughout the day, hearing aid users encounter various situations with changing acoustic environments. Modern hearing aids aim to accommodate these changes by automatically modifying amplification and adaptive features to provide satisfactory sound quality in all situations. Hearing aids have automatic classifiers that guide this accommodation process using acoustic input (Dillon Citation2012). Acoustic scene classification (e.g. based on input spectrum, overall level and signal fluctuations) will further activate specific signal processing options to address various kinds of listening situations. Notably, automatic classifiers can reliably detect and activate signal processing to alleviate difficult listening situations such as speech in noise (Büchler et al. Citation2005; Searchfield et al. Citation2018).
The benefits of hearing aid features designed to ease listening in difficult, stationary situations have been extensively investigated and well documented. However, hearing aid users’ listening requirements may differ for stationary versus mobile activities (Tessendorf Citation2012). Different sound source arrangements in each activity can affect listening. When walking, listeners usually don’t face conversation partners walking beside them, and they may need to attend to something outside of their visual field (e.g. the bell of a bicycle approaching from behind). Hearing aid mechanisms that work well for listening in a stationary position could diminish sound quality for listening while walking. For example, directional microphones are effective at increasing speech understanding in noise when the user is in a stationary position facing the talker (Dillon Citation2012; Hawkins and Yacullo Citation1984; Kühnel, Margolf-Hackl, and Kiessling Citation2001; Lurquin and Rafhay Citation1996; Pumford et al. Citation2000; Valente et al. Citation1995; Wagener et al. Citation2018). However, for noisy scenarios with the sound source coming from the side, one or two omnidirectional microphones work better compared to binaural directional microphones (Hornsby and Ricketts Citation2007; Kuk et al. Citation2005; Wu et al. Citation2013). Some hearing aids now allow for switching to an asymmetric microphone setting when speech is detected to the side or back of the listener (Nyffeler Citation2010; Cord et al. Citation2011). However, asymmetric hearing aid processing can be confusing for hearing aid users for the purposes of localisation (Ibrahim et al. Citation2013), which is essential for safe walking (Campos, Ramkhalawansingh, and Pichora-Fuller Citation2018).
Humans primarily use interaural time differences (ITDs) and interaural level differences (ILDs) to localise sounds in the horizontal plane. Furthermore, the frequency response of sounds originating at different spatial positions relative to the listener is shaped by the structure of the pinna to provide crucial cues for front-back and vertical localisation. Additionally, head movements play an important role in correct front-back localisation (Macpherson and Kerr Citation2008). Some of these acoustic cues are unique because they depend on individual variations in torso, head and pinna shape (Dillon Citation2012; Häusler, Colburn, and Marr Citation1983; Middlebrooks and Green Citation1991). In contrast to people with conductive hearing loss, people with sensorineural hearing loss exhibit reduced localisation abilities (Byrne and Noble Citation1998; Campos, Ramkhalawansingh, and Pichora-Fuller Citation2018). Impaired supra-threshold spectral processing in people with sensorineural hearing loss might be responsible for decreased localisation abilities (Häusler, Colburn, and Marr Citation1983). Hearing aids may enhance or compromise the availability of these cues for those who have sensorineural hearing loss.
The hearing aid model may contribute to the availability of localisation cues. In a binaural hearing aid fitting with synchronised signal processing, the primary cues for lateral localisation, ILDs and ITDs, remain mostly intact (Ibrahim et al. Citation2013). In-the-ear hearing aids typically also preserve the localisation cues provided by the pinna (Denk, Ewert, and Kollmeier Citation2019; Van den Bogaert, Carette, and Wouters Citation2011). Behind-the-ear and receiver-in-the-canal hearing aid models, however, impoverish vertical and front-back localisation. In these models, hearing aid microphones are located on top of the pinna, disrupting the acoustic cues provided by the natural amplification and attenuation of the outer ear (Best et al. Citation2010; Denk, Ewert, and Kollmeier Citation2019; van den Bogaert et al. Citation2006). For these models, other factors may further affect the availability of cues, such as the available bandwidth, processing delays or frequency response (Denk, Ewert, and Kollmeier Citation2019).
The microphone configuration is another key factor that could affect the availability of cues. Researchers reported divergent results when studying the ability of listeners to localise sound sources when using directional and omnidirectional hearing aid microphones. Some studies found a localisation advantage with directional microphones for broadband stimuli or stimuli with high- or mid-frequency components presented in a 360° radius (Carette et al. Citation2014; Keidser et al. Citation2006, Citation2009). In another study, symmetric directionality allowed participants who were hard of hearing to perform similarly in lateral and front-back localisation compared to an unaided control group of participants with normal hearing thresholds (Carette et al. Citation2014). Directional microphones also led to fewer errors in front-back localisation when compared to omnidirectional microphones (Keidser et al. Citation2006, Citation2009). However, another study showed that participants could locate a female talker outside of their visual field faster and with fewer head turns when using omnidirectional microphones (Brimijoin et al. Citation2014). Only when the sound source was visible to the listener could participants orient more quickly when using directional microphones. A study that evaluated the localisation of a female talker in the frontal horizontal plane reported equal performance for both microphone conditions (Picou and Ricketts Citation2017). Similarly, in a study using a high- and low-frequency narrowband noise and a broadband-telephone ring, localisation was better in most conditions when using omnidirectional microphones, although the finding did not reach statistical significance (p = 0.053, van den Bogaert et al. Citation2006). Importantly, localisation when walking requires a hearing aid user to quickly orient towards sound sources that could be inside and/or outside of the visual field while avoiding front-back confusions. Overall, it seems that both directional and omnidirectional microphones may sometimes benefit localisation depending on the particulars of the listening situation or stimulus.
Conventional beamformer adaptation in a hearing aid will activate a directional microphone system for difficult communication situations regardless of listeners’ activities (e.g. sitting, standing still or walking). However, as previously mentioned, listening needs may differ for stationary versus mobile activities. Enhanced beamformer adaptation would need access to information about the user’s activity to improve its decision making. Motion sensors are widely used in everyday applications such as wristbands and mobile phones to collect information about user activity (Martin et al. Citation2012; Shcherbina et al. Citation2017; Storm, Heller, and Mazzà Citation2015). Research has shown that the ear is a reliable location for motion sensors (Kavanagh, Barrett, and Morrison Citation2006; Lindemann et al. Citation2005), and high accuracy (93.7%) has been found for the motion sensor used in the hearing aids in our study (Voss et al. Citation2020). This sensor contains an accelerometer and detects motion based on the impulse provoked by each step.
Froehlich and colleagues reported a benefit for a novel hearing aid feature that utilised a motion sensor to help with speech understanding when a listener was moving in a simulated street scenario (Froehlich, Branda, and Freels Citation2019). In the study, the novel hearing aid feature was compared to conventional hearing aid processing for 13 participants who rated speech understanding and effort when listening to a sound source located at the side. The same publication reports a second study that included a one-week field trial with the novel hearing aid for 35 participants. They reported their experience using a phone app during or immediately after real-world listening experiences. A limitation of the study was that it was not possible to assess how well the hearing aid feature worked depending on the listeners’ activities because the field trial did not allow the researchers to access detailed information about the listening situation or the hearing aids’ signal processing (i.e. sound levels, angle of a sound source, if the sensor was activated during the activity). Hence, it is not clear in which situation the hearing aid feature was helpful and if the study participants based their positive feedback on signal processing resulting from detection of motion.
In the current exploratory study, we set out to compare hearing aid users’ listening experiences in realistic walking activities when using a hearing aid in a speech in noise program with conventional beamformer adaptation or motion-based beamformer adaptation utilising an additional motion sensor that detects walking. Participants walked outdoors at a self-selected pace. This is more realistic compared to experiments involving walking on a treadmill in a laboratory. Responses were collected under real-world conditions while striving to maintain high scientific accuracy by carefully controlling stimuli presentation. Additionally, the hearing aids’ signal processing was monitored to verify the motion sensor’s walking detection and the activated beamformer setting.
In the test device used in this study, when speech in noise is detected, conventional beamformer adaptation will activate a level-dependent, adaptive multiband beamformer combined with a directional noise cancellation that attenuates signals from the back to increase speech understanding for signals from the front. This beamformer setting offers the required directivity and noise suppression to understand a talker in front of the listener wearing the hearing aid, but it provides less audibility for sounds originating at the listener’s side or from the back. Upon detecting walking, motion-based beamformer adaptation will activate a less directional microphone setting that allows for better surround-sound pickup. It is designed to restore the natural directivity pattern of the outer ear by applying directionality only at high frequencies. Such a processing strategy helps reduce front-back confusions caused by omnidirectional microphones positioned on the top of the pinna (Phonak Citation2005). Previous studies demonstrated improved localisation with a pinna-mimicking microphone setting compared to omnidirectional microphones in hearing aids (Kuk et al. Citation2013) and cochlear implants (Fischer et al. Citation2021). Pinna-mimicking signal processing is often used as the default processing strategy in commercially available receiver-in-the channel or behind-the-ear hearing aids for all listening situations, except for speech in noisy environments where directional noise cancellation is used.
Comparing motion sensor-based beamformer adaptation to conventional beamformer adaptation, we expected to observe increased speech understanding and improved environmental awareness (i.e. sound detection, recognition and localisation).
2. Materials and methods
2.1. Design
Study participants were recruited from their hearing aid clinic either in Burlington, Ontario, Canada or nearby Oakville. After giving their consent to participate in the study, participants attended one appointment at a hearing aid clinic and completed a demographic questionnaire and assessment tests. With the consent of participants, the clinics provided the research team with participants’ most recent audiometric test results, which had been measured within the last year with an Interacoustics AD629 audiometer using insert earphones.
The experimental hearing aids were fit, and participants were given instructions about the walking experiment. All participants completed two walks, one walk while wearing hearing aids with motion-based beamformer adaptation (test condition) and one walk while wearing conventional beamformer adaptation (control condition). They completed six tasks per walk, including three speech tasks and three environmental awareness tasks. Outcomes regarding speech understanding and environmental awareness were measured during and following each walk. Comparison and preference measures were conducted after both walks had been completed. Each walk took about 10 minutes to complete. Between the walks, participants answered a questionnaire and the hearing aid program was switched. Breaks were given between walks and whenever a participant requested a rest.
The order in which tasks were conducted was fixed for each walk and differed for the first and second walks. To avoid order effects, the order of the two hearing aid conditions was randomised across participants such that the participants and the researchers (except for the lead researcher) were blind to the condition. Before starting the walking tasks and while still stationary in the clinic, participants were familiarised with all sound stimuli that they would hear in the environmental awareness tasks. Participants also conducted a practice walk with their own hearing aids before switching to the study hearing aids.
2.2. Participants
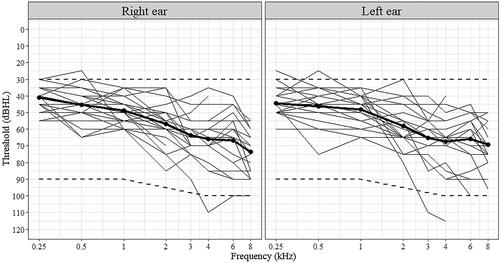
Participants were 22 adults (11 female, 11 male) aged 66–91 years (M = 79 years, SD = 6 years) who were recruited through their hearing aid clinics. All had a binaural, symmetric, sensorineural moderate-to-severe hearing loss (see ) and had been using hearing aids daily for at least 6 months. All had completed high school and were fluent English speakers. Participants were screened in a brief interview, and those who self-reported having good vision, cognition and walking abilities were invited to participate in the study. Risks related to study participation were not greater than when taking a walk under daily, normal circumstances by people who self-report good abilities.
Figure 1. Audiograms for the right and left ears of participants (thin lines). Bold lines show the average hearing thresholds. Dashed lines indicate the fitting range of the test devices.
Although participants self-reported having good vision, cognition and walking abilities, assessment tests were conducted to measure their abilities. The Montreal Cognitive Assessment (MoCA; (Nasreddine et al. Citation2005)) was conducted to assess general cognition; the test requires participants to complete brief tasks in domains including executive function, language and memory. We applied a modified scoring procedure whereby cognition is assessed using only items that do not rely on auditory stimuli (Al-Yawer, Pichora-Fuller, and Phillips Citation2019). Using the modified scoring, a MoCA score ≥16/20 indicates normal cognition. Participants wore their own hearing aids and glasses for the MoCA. The Timed-Up-and-Go (TUG; (Wall et al. Citation2000)) was administered to assess walking speed, which helped the researchers to estimate how long a walk would take for the participant. In the TUG, people get up from a chair, walk 10 feet, turn around, and walk back to the chair to sit down. Those who require more than 12 s to complete the test are considered to be at risk of falls. Visual acuity was assessed with the Early Treatment Diabetic Retinopathy Study (EDTRS) chart (Kaiser Citation2009). The EDTRS assesses the ability of the individual to read letters from a chart in the far-field with corrected vision (i.e. wearing glasses if appropriate). A logMAR score of 0.3 is considered normal. The number of participants who passed and failed the assessment tests are displayed in .
Table 1. Number of participants who passed or failed the assessment tests according to published test score criteria.
The Office of Research Ethics at the University of Toronto approved the study, and participants provided informed consent. Participants attended one appointment for a duration of 90 min and received $30 as compensation for their time.
2.3. Hearing aids and test settings
Participants were fitted binaurally with receiver-in-the-canal hearing aids based on Phonak Audéo M90-R technology, additionally equipped with a motion sensor. Double-layered silicone eartips (“power dome”) were used to limit the amount of unprocessed direct sound in the ear canal. Unprocessed environmental sound that enters the ear canal through vents reduces beamformer efficacy (Bentler, Wu, and Jeon Citation2006). Hearing aids were programmed to the manufacturer’s proprietary fitting rationale targets (Adaptive Phonak Digital; Latzel, von Buol, and Kuehnel Citation2013) as calculated by the fitting software (Phonak Target 6.1). A feedback test (Dillon Citation2012) was conducted with the hearing aid fitting software to limit amplification to the stable region and estimate the vent-out effect. Low-frequency amplification was automatically adjusted to reduce comb-filter effects from interference between amplified sound and direct sound emerging through the vent. Adaptive parameters (feedback cancellation, wind noise reduction, single-channel noise reduction and transient noise cancellation) were set to the recommended defaults. Participants rated the loudness and sound quality of the researcher’s voice and their own voice. Although the quality of the participant’s own voice wasn’t assessed as an outcome measure, it was important that participants were comfortable listening to their own voice while aided during the experiment. A few participants requested a reduction in loudness, which was applied within a range of 3 dB. Further target matching was not conducted.
Hearing aids were set up with two manual speech-in-noise programs. In the control condition, the program used the default directional processing that applied an adaptive multiband beamformer (“UltraZoom”) with directional noise cancellation (“SNR-Boost”) when the environmental noise level exceeded 60dBA. The directional noise cancellation uses spatial information from the beamformer to further reduce signals from behind by calculating frequency-dependent gains. This program did not utilise the motion sensor. In the comparison test condition, by enabling motion-based beamformer adaptation in the speech-in-noise program, a beamformer mode that mimics pinna directivity (“Real Ear Sound”) was activated when the motion sensor detected walking (test condition with motion-based beamformer adaptation). Polar plots for Phonak “Real Ear Sound” and “UltraZoom” are shown in Figure 1 in the Supplementary digital content (SDC).
Hearing aids were connected to a smartphone application to monitor the activation of the anticipated beamformer setting in each condition. Walking detection and corresponding beamformer activity were logged during all participants’ walk with motion-based beamformer adaptation. Wind entering the microphones would have activated wind noise cancellation, reducing the activation strength of the beamformer in the control condition. To mechanically reduce turbulences, the hearing aid microphones were covered with microphone windshields designed for smartphone microphones (Rycote microWindjammer, see Figure 2 in the SDC). A technical measurement with speech and noise stimuli in Verifit 2.0 confirmed acoustical transparency for the microphone covers.
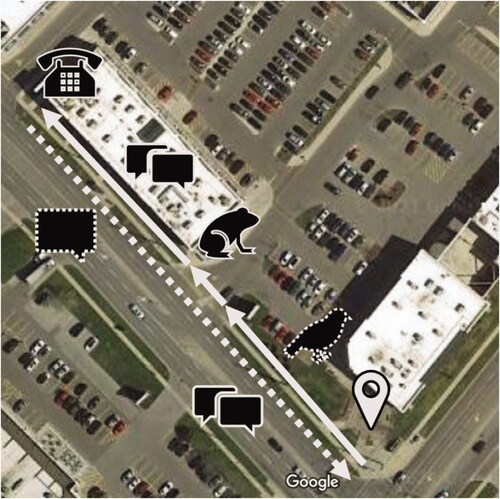
Figure 2. Overview of the walking track showing the task sequence during the first walk in the Burlington location. The participant started the walk at the lower right corner (location pin), walked towards the corner of the plaza (solid arrows and corresponding symbols) and back (dashed arrow and symbols). Double speech marker symbols show where the speech inquiry task was performed, while the single speech marker symbol indicates where the story was heard. The bird, frog, and phone symbols show where these sounds were presented.
2.4. Tasks while walking
A walking track was prepared at each of the two locations near the hearing clinics from which participants were recruited. Each track was prepared so that participants could evaluate their listening experiences for pre-determined stimuli (see ). Each walk consisted of two “inquiry” speech tasks, one “story” speech task, and three environmental awareness tasks, which will be explained in the following section. The walking tracks were both next to a busy street close to an intersection in an area with medium foot traffic. Measurements during all appointments at both locations showed that average environmental noise levels varied between 67 and 71 dBA.
During the walk, the lead researcher (R1) walked beside the participant and instructed him/her about the procedure. Before each task, R1 announced that a task was about to take place. However, the participant was unaware of the type or exact timing of the tasks. Participants were instructed to keep walking and to keep their head straight for the duration of the walk. R1 also administered questionnaires during and following the walks as explained below.
2.4.1. Speech understanding
A second researcher (R2), who most of the time walked behind the participant (see Figure 3 in SDC for a photograph), orally presented the stimuli for the speech tasks (see Figure 4 in the SDC for a detailed task flow). R2 adjusted her voice to be somewhat louder than the environmental noise, just as one would naturally do in a real-world conversation in noise. For the “inquiry” speech tasks, R2 asked the participant a simple question (e.g. “What is your favorite color?”; see for an example questionnaire page and questionnaires “1st walk” and “2nd walk” in the SDC for all questions). If the participant replied with a reasonable answer (e.g. “Yellow.”), the response was scored as correct. If the participant was unable to understand the inquiry, it was repeated up to two times. There was a maximum of four points for the whole inquiry speech task, with three points for understanding the question at the first attempt, and one additional point for a correct answer; for each repetition, the speech understanding score was reduced by one point from the possible maximum of four points. After completing the response section of the task, the participant and researchers stopped, and the participant was asked to rate how easy it had been to understand the question.
Figure 3. Exemplary page of the questionnaire used during the first walk. The page covers all types of tasks (environmental awareness, “story” speech task, and “inquiry” speech task).
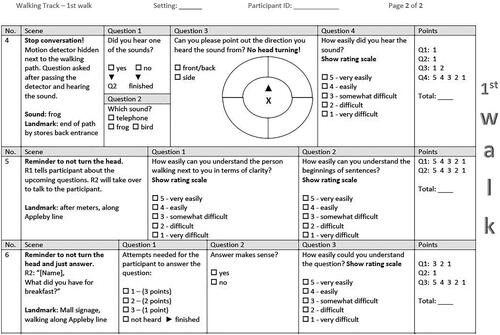
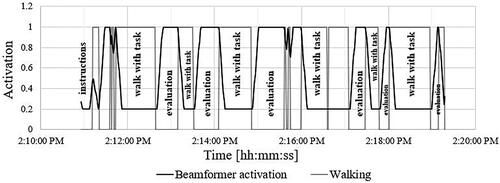
Figure 4. Detection of walking activity (grey line) and beamformer activation (black line) over 9 min. At y = 0, the sensor did not detect walking, and at y = 1, walking was detected. The y-axis value 0.2 corresponds to the activation of “Real Ear Sound”, while y-axis value 1 corresponds to the activation of “UltraZoom”.
For the “story” speech task, R2 walked beside the participant and told a brief pre-determined story. The stories were different for the first and second walk. For the first walk, the stories were taken from the news (e.g. about forest fires in Canada); for the second walk, the stories described a fictitious personal experience (e.g. about a relative’s birthday party; see verbatim materials in the SDC). Thus, some participants listened to the news story in the test condition and some listened to the news story in the control condition. Each story lasted about a minute. Afterwards, the participant and researchers stopped, and R1 asked the participant to rate how easily s/he could understand a) R2 and b) the beginnings of sentences. The beginning of sentences was assessed separately because we wanted to find out if participants were able to detect and understand the sentences right from the onset.
2.4.2 Environmental awareness
Before each walk, a third researcher (R3) was responsible for hiding three small loudspeakers (Waytronic Microsound V16), from which the sound stimuli for environmental awareness tasks were presented. Three royalty-free sounds (a bird’s call (cardinal, centre frequency of 3068 Hz), a croaking frog (centre frequency of 1828 Hz), and a telephone ring (centre frequency of 5484 Hz)) were selected and downloaded from www.soundbible.com. The sounds were chosen because they were not common in the areas where data collection took place and could be distinguished easily from expected environmental sounds. Stimuli varied in spectra and intensities and were played from slightly varied locations in each walking condition. The frog and telephone stimuli were located about 1 m away from the participant and had a sound level of approximately 73 dBA at the participant’s location. The distance between the bird stimulus and the participant was about 3 m, and the sound level at the participant’s location was approximately 83 dBA.
The loudspeakers were hidden at different heights (shoulder, hip, and knee) and were activated by a motion sensor when the participant walked by (see Figure 4 in the SDC for a detailed task flow and Figure 5 in the SDC for a loudspeaker placement example). Each sound playback lasted for about 10–15 s during which the participant had to keep walking. Once the playback of the stimulus was over, the participant was told to stop and was asked if a sound had been heard, which sound, and from which location. The participant could choose one of four quadrants (front left, front right, back right, back left), and as such could make a single kind of lateral error (wrong side) and a single kind of front-back error. Finally, the participant was asked to rate how easily s/he could hear the sound.
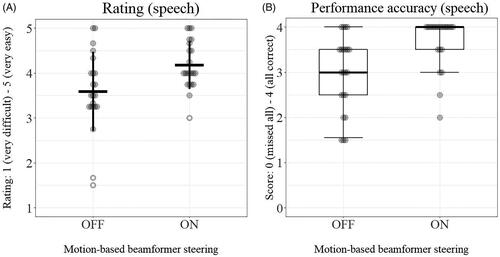
Figure 5. (a and b) Average speech understanding ratings (a) and median speech understanding accuracy scores (b). Bold horizontal lines represent means and medians, with vertical lines showing one standard deviation and 10th percentiles. Boxes in 5b indicate the 1st and 3rd quartiles. Grey dots represent individual data points, with white dotted circles representing data points that are more than two standard deviations away from the mean. Please see Figure 6(a,b) in the SDC for scatterplots of individual results with ON and OFF.
2.5. Development of questionnaires
At the time of the study design (Summer 2019), the development of methods to evaluate hearing aids while the user was walking in the real world was a relatively new research topic. Few questionnaires or methods designed for that purpose were available. Therefore, a new questionnaire was developed to address several aspects of speech understanding and environmental awareness during and after the experimental walk. The questions were inspired by the Speech, Spatial and Qualities of Hearing Scale (Gatehouse and Noble Citation2004), but adapted for clarity and brevity to allow for quick decisions about specific stimuli experienced during the walks.
The first part of the questionnaire was designed for use during a walk (see for an exemplary questionnaire page and the SDC for complete questionnaires “1st walk” and 2nd walk”). The questionnaire assessed two domains: speech understanding and environmental awareness (see Table 1 in the SDC for an overview of the questionnaire). For each domain, the questionnaire used yes-no questions to assess performance accuracy (e.g. “Did you hear a sound?”) and subjective ratings on a 5-point scale to rate difficulty hearing or understanding the stimuli (e.g. “How easily did you hear the sound?”). The scale was limited to 5 points to enable participants to make a quick decision during the walk. For the speech understanding domain, participants responded to two “inquiry” speech tasks using a question/answer format and one “story” speech task. For the environmental awareness domain, participants were asked to detect, recognise and localise three test stimuli. Prior to the experimental walks, a practice version of this questionnaire was administered which used a full set of questions for one inquiry speech and one environmental awareness task as well as an overall rating after the walk (see questionnaire “practice walk” in the SDC).
A second questionnaire (see questionnaire “after both walks” in the SDC) was used after each walk to ask participants to rate their overall listening experience using the 5-point Mean Opinion Score (MOS; ITU-T Recommendation, P.800 Citation1996; see Table 2 in the SDC for an overview of the questionnaire). After completing both walks, participants completed a paired comparison of which walk they preferred in terms of speech clarity, hearing and locating sounds, and overall listening experience. Additionally, sound quality was assessed with the 5-point MOS (ITU-T Recommendation, P.800 Citation1996) to allow for more differentiation of preference compared to the simple AB comparison.
Table 2. Number (percentage) of participants who preferred the walk with the motion-based beamformer adaptation on or off for speech understanding, environmental awareness, and overall listening experience.
2.6. Data analysis
Statistical analysis and plotting were done in R 4.0.2 using packages xlsx, ggplot2, and ggbeeswarm. The alpha level for rejecting the null hypothesis was p = 0.05. With the exception of speech ratings, data obtained through performance assessments and ratings followed non-normal distributions. Speech ratings were normally distributed and tested for significance using a paired t-test. All other results (performance in speech and environmental awareness tasks, rating of environmental awareness and overall listening experience) were tested for significance using the Wilcoxon signed-rank test. Correlations between rating and performance accuracy data were assessed using Pearson’s product-moment correlation.
One-sided exact binomial testing for a 50% probability was used to test the significance of A/B comparison results. Answers of participants who could not decide on a preferred program were removed from the analysis as this was not an available response option. Participants were allowed to remain indecisive when rating sound quality after they completed both walks. A one-sided Sign test was applied to test if sound quality rating results for motion-based beamformer adaptation were deviating from null.
3 Results
3.1. Signal processing and SNR observations
A smartphone application provided real-time information and log files about the walking detection algorithm and corresponding beamformer activity. See for an example of a recorded walking and associated beamformer activity. This pattern was observed for all participants. Post-experimental analysis of the signal-to-noise ratio (SNR) during the story speech task revealed a median SNR in both conditions of 7.5 dB. The SNR mostly fluctuated between 5.5 and 10 dB. Positive SNRs are common in the real world (Wu et al. Citation2018).
3.2. Speech understanding and environmental awareness during the walk
Speech understanding and environmental awareness were assessed with tasks participants had to complete during the walk. Performance accuracy was measured based on successful completion of a task. Ratings were based on the participants’ self-reported experience during the task.
Participants reported significantly easier speech understanding on speech tasks during the walk with motion-based beamformer adaptation (mean = 4.2) compared to the walk with conventional beamformer adaptation (mean = 3.6; t(21) = −3.56, p < 0.05; see ). Speech performance was significantly more accurate with motion-based beamformer adaptation (median = 4) than without (median = 3; Z = −3.11, p < 0.01; see ). Ratings and performance results were not significantly correlated (r(20)ON = 0.01, pON = 0.98; r(20)OFF = 0.15, pOFF = 0.51). Analysis showed that order of conditions did not lead to significant differences between ratings (ZON = 0, pON = 1; ZOFF = −0.27, pOFF = 0.79) or performance scores (ZON = −0.08, pON = 0.94; ZOFF = −0.34, pOFF = 0.74).
Each of the 22 participants performed 3 localisation tasks per walk, which resulted in 66 trials per condition over the whole experiment; however, some participants were unable to hear a stimulus, so there were 61 localisation trials in the condition with motion-based beamformer adaptation and 60 trials in the control condition. Localisation performance was significantly more accurate with motion-based beamformer adaptation (median = 1.7) than without (median = 1.3; Z = −2.52; p < 0.05, see ). Front-back confusions were present in both conditions (21 front-back confusions in 61 trials with motion-based beamformer adaptation, 28 in 60 trials with the conventional beamformer), while lateral localisation was less of a problem when motion-based beamformer adaptation was activated (4 errors in 61 trials with motion-based beamformer adaptation versus 17 errors in 60 trials with the conventional beamformer).
Figure 6. (a and b) Median environmental awareness ratings (a) and median localisation accuracy scores (b). Bold horizontal lines represent medians, with lower vertical lines showing 10th percentiles. Boxes indicate the 1st and 3rd quartiles. Grey dots represent individual data points. Please see Figures 7(a,b) in the SDC for scatterplots of individual results with ON and OFF. One participant was unable to detect any stimuli with conventional beamformer adaptation, which reduced the participant number in this condition (n = 21).

Ratings of difficulty during environmental awareness tasks follow the same pattern as for speech understanding, but the differences between conditions did not reach significance (Z = −0.4; p = 0.68, see ). Test conditions did not influence the accuracy of the detection and recognition of stimuli. Detection of the stimuli was pre-requisite to the subsequent tasks (recognition, localisation, and rating); therefore, stimuli were presented at easily audible levels and detection was near ceiling. However, one participant was unable to detect any stimuli with conventional beamformer adaptation and could not complete any subsequent task, which reduced the participant number in this condition (n = 21). Ratings and performance results were correlated when motion-based beamformer adaptation was activated (r(19)ON = 0.54, p < 0.05), but not for the control condition (r(19)OFF = 0.28, p = 0.21). Analysis showed that order of conditions did not lead to significant differences between ratings (ZON = −0.07, pON = 0.94; ZOFF = 0, pOFF = 1) or performance scores (ZON = −0.07, pON = 0.94; ZOFF = −0.76, pOFF = 0.45).
3.2. Overall preference
A/B comparisons were designed as forced-choice questions with only two options after conducting both walks, hence participants’ responses were excluded if they didn’t decide on one program (3 for environmental awareness, 1 for overall experience). 16 out of 22 participants chose the motion-based beamformer adaptation in the A/B comparison of speech, 14 out of 18 preferred motion-based beamformer adaptation for environmental awareness, and 15 out of 21 for overall listening experience (p < 0.05, see ).
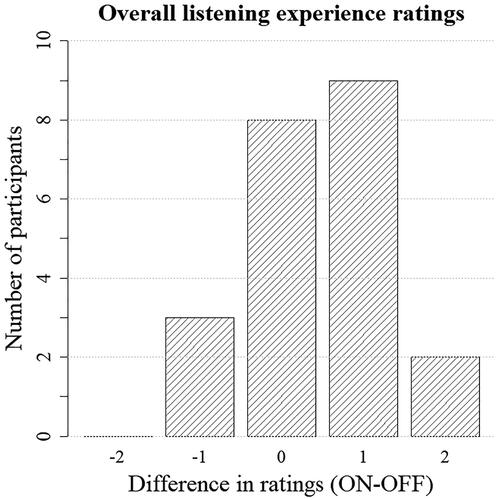
Sound quality rating responses of different categories (“slightly better” and “significantly better”) were combined for analysis (see ). Out of 15 participants with a preference, 12 participants reported that sound quality was slightly or significantly better in the walk with the motion-based beamformer adaptation compared to the walk with conventional beamformer adaptation (S = 12; p < 0.05). Overall listening experience was rated immediately after each walk with the 5-point Mean Opinion Score. Ratings were similar across conditions, but the motion-based beamformer adaptation received more ratings indicating good experience than did conventional beamformer adaptation (Z = −2.2; p < 0.05, see ). Statistical analysis suggested the absence of an order effect for A/B comparisons of speech (Z = −1.77; p = 0.08), environmental awareness (Z = −0.59, p = 0.55), and overall listening experience (Z = −1.48; p = 0.14). Absence of an order effect was also suggested for sound quality ratings (S = 10; p = 0.31), and overall listening experience (t(19.32)ON = 0.22, pON = 0.83; t(19.76)OFF = −1.29, pOFF = 0.21).
Figure 7. Number of participants who preferred the condition with the motion-based beamformer adaptation on or off (conventional adaptation) or did not perceive a difference.
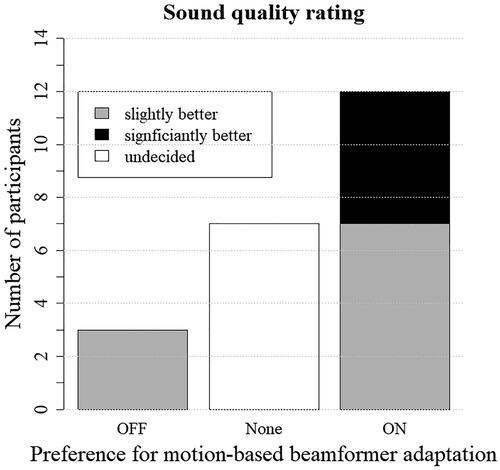
Figure 8. Histogram of the difference in ratings for motion-based beamformer adaptation on and off (conventional adaptation), with a positive value showing higher rating for motion-based beamformer adaptation.
4. Discussion
This study was the first evaluation of hearing aids with a motion-based algorithm in a real-world setup. For all three A/B ratings (speech understanding, environmental awareness, and overall listening) during a walking activity, more participants preferred the hearing aids that automatically adapted beamformer settings based on walking detection than the comparison condition with conventional beamformer adaptation. Speech understanding and localisation performance were significantly better when motion-based beamformer adaptation was activated compared to when it was not. Real-time observation of the environment and feature activation provided insights into performance in a real-world context.
Due to the novel method, few publications were available to which the results of the present study could be compared. Motion-based beamformer adaptation activates a microphone configuration that mimics the directivity of the human pinna when the hearing aid’s motion sensor detects walking while listening to speech in noise. In the existing literature, an omnidirectional microphone setting is closest to our novel configuration, and differences between those two microphone settings are marginal when compared to a directional setting. The discussion will thus focus on comparisons in the literature between omnidirectional and directional microphone settings. With few studies available that compare directional microphones and microphone settings that mimic the pinna, our study helps to fill this gap. The discussion addresses our findings as well as our initial experience with a method that represents a more valid use case but lacks the scientific accuracy of traditional test methods.
4.1. Speech understanding
When motion-based beamformer adaptation was activated, participants needed fewer attempts to understand questions asked from behind. This finding aligns with the results of several other publications that reported a better understanding of speech in noise from the side with omnidirectional compared to directional microphones (Brons, Houben, and Dreschler Citation2014; Ricketts and Hornsby Citation2005). Unlike directional microphones, omnidirectional microphones pick up sounds from all directions, enhancing the audibility of sounds from the side or from behind the listener. The current results indicated improved speech understanding in both subjective rating and accuracy measures (shown in ) when motion-based beamformer adaptation was activated. Perceptually, the improvement in this condition might suggest that participants were able to make sense of the conversational content with less effort. Future studies could further investigate this aspect by observing communication behaviour, such as the head movements or the facial expression of participants.
Participants’ ratings indicate that speech was easier to understand when the motion-based beamformer adaptation was activated. This outcome aligns with a report of higher subjective benefit with omnidirectional compared to directional microphones when desired signals are beside or behind the listener (Brimijoin et al. Citation2014). However, an omnidirectional microphone setting also picks up environmental noise from all directions. Some participants complained about the loudness of noise in both of our test conditions. In our realistic walking situation, it was not possible to control environmental noise, but we paused data collection whenever an unusually loud noise occurred (e.g. a bus idling at a bus stop near the walking path).
4.1.1 Methodological issues
We controlled experimenter bias insofar as the researcher who delivered the speech stimuli was blinded to the conditions of each walk. This researcher used her own judgement to maintain speaking with the same voice pitch, level and rate across conditions and tasks. We decided against delivering recorded speech using a loudspeaker because any type of playback is less natural than live speech from a companion, especially given that the participants were walking. However, a sound level meter or more speaking training for the researcher may have helped to further increase the repeatability of stimuli presentation across conditions.
The stories we chose to use for the storytelling task had different content for each walk. Some participants mentioned that they found it easier to relate to and thus understand the personal story. In addition to counterbalancing the order of conditions, selecting stories from the same categories (either news stories or personal experiences) for the whole experiment could have simplified comparisons between walks.
4.2. Environmental awareness
Participants detected, recognised and localised the sounds of a bird, a telephone ring and a frog presented from loudspeakers hidden along the walking track. Analysis of the participants’ ability to locate stimuli revealed a higher rate of correct localisation with motion-based beamformer adaptation.
4.2.1 Detection and recognition
Detection and recognition of stimuli was similar across walks. Stimuli were played at levels above the environmental background noise, and the results suggest that sounds were audible in both conditions. The bird was detected and correctly recognised most often, possibly because it was presented at a higher sound level. A few participants had difficulties detecting the frog, possibly because its relatively lower frequency spectrum was masked more by the environmental noise. Participants with severe high-frequency loss tended to miss or incorrectly identify the telephone ring, which was not as loud or high pitched as the bird. In general, confusions were rare (see Table 3 in the SDC), but they happened in both conditions, suggesting that the sounds were equally perceptible with both beamformer settings. Greater differences between the frequency spectra of the stimuli and environmental sounds may help to reduce confusions.
4.2.2. Localisation
Sound sources were located outside of the participants’ visual field (beside or behind them) and they had to identify the direction of the sound source without turning their head. Under these conditions, hearing aid users can typically estimate the location of sound sources better with omnidirectional microphones than with directional ones (Brimijoin et al. Citation2014). These findings are consistent with the accuracy of localisation performance found in our study.
With less attenuation of sounds from the sides and behind the walking listener, the test condition with motion-based beamformer adaptation possibly contributed to an increased sense of awareness and safety. A higher sense of safety might have allowed listeners to implicitly allocate more cognitive resources and direct attention to a relatively difficult task like localisation, resulting in better performance in this condition.
Regarding stimulus type, the frog was located with the fewest front-back and lateral confusions, closely followed by the telephone. The bird was played from a greater distance at an increased sound level that may have caused reflections from objects and buildings, making localisation more difficult. Nevertheless, participants rated tasks related to the bird as less difficult than those involving the other two stimuli, suggesting that the loudness of the stimuli likely dominated their ratings.
4.2.3. Methodological issues
The absence of oral feedback during testing environmental awareness possibly led to less differentiation between conditions when participants had to rate the difficulty or chose their preferred condition in the retrospective A/B comparison. In speech understanding tasks, participants had a good idea of how well they understood because they had to request repetitions or only understood parts of a story. In contrast, for environmental tasks, unless participants felt very insecure about their responses, they had to assume they were giving correct answers. Individual self-efficacy possibly biased participants to rate both conditions rather high. A positive correlation suggests that the higher subjective judgements were more aligned with a higher performance in the motion-based beamformer condition, but not in the control condition.
For the environmental tasks, we relied on timely activation of the motion-activated loudspeakers, which did not always work as anticipated. In rare cases, when it failed to activate on the first attempt, we had to return to pass the loudspeaker a second time. Sometimes, when pedestrians or cars activated a loudspeaker too early, we had to slow down and engage in a conversation to prevent the participant from hearing the stimulus before reaching the defined evaluation area.
For each loudspeaker location, we had determined a corresponding evaluation area where the participant stopped to complete tasks (detection, recognition, localisation). At pre-determined test spots, the lead researcher quickly instructed the participant to stop and then scored the participant’s responses. The localisation response was scored using a basic quadrant scheme which only allowed for front/back and left/right options rather than more exact information about the relative angle of the sound source. The localisation response also depended on the participant continuing to look straight ahead. Furthermore, to control for false positives on the detection task, it would have been helpful to include trials in which no sound had been presented.
4.3. Sound quality and overall listening experience
Overall listening experience was rated with a 5-point Mean Opinion Score immediately after each walk. After both walks had been completed, sound quality was rated and participants also determined their preferred condition in terms of overall listening experience.
Results for sound quality ratings suggest that, although roughly one-third of the participants remained undecided, more preferred the sound quality with motion-based beamformer adaptation on. Under free-field conditions, a fully activated beamformer suppresses sounds from behind up to 20 dB (cf. Figure 1 in the SDC). Due to individual variability in the acoustic coupling properties with the power domes used in this study, the efficacy of low-frequency suppression varied among participants. Hence, the suppression effect may have been unnoticed by some, while it was apparent for others. A few participants registered a strong reaction to the signal processing conditions. For example, after completing the walk with conventional beamformer adaptation, one participant acknowledged in amazement that he had not heard any of the environmental stimuli, and his ratings were in general lower for this condition than the other condition.
In general, ratings collected after both walks were more distinctive than the ones collected during or after each walk. Many participants who noticed a difference were more emphatic about their responses when they had to decide which condition they preferred rather than when rating each walk independently. For example, in the A/B comparison after both walks, more participants preferred overall listening with motion-based beamformer adaptation on; however, when they were asked to rate their experience immediately after each walk, they rated overall listening experience similarly in both conditions. It is possible that collecting rating responses during the walk helped participants to make their decisions for the A/B comparisons and ratings conducted after both walks.
4.4. Participants
The sampling method for this study is similar to that used in most studies that include older participants with hearing loss who are representative for a typical clinical population. Inclusion was based on self-reported good walking, vision and cognitive abilities, but participants’ abilities were assessed to provide better insight into possible individual differences.
The participants included slow and fast walkers, including five whose times on the TUG test were so slow that the results suggest that they could have increased risk for falls. Slow walking is more difficult to detect for motion sensors than walking at a regular or fast pace (Martin et al. Citation2012; Shcherbina et al. Citation2017; Storm, Heller, and Mazzà Citation2015). Nevertheless, application logs showed that the sensor in our hearing aid detected motion and activated the corresponding setting for all participants, thus proving its sensitivity over a range of walking speeds in older adults.
Of the five participants who failed TUG, one had MoCA scores below the normal range, and three did not complete all MoCA items. The overall pattern of findings did not change after removing these five participants from the analysis; however, measures taken after both walks were rendered statistically insignificant when they were removed, and the sample size was reduced.
To further examine the possibility that participants who performed more poorly on the TUG, MoCA or EDTRS tests could have responded differently to the motion-based beamformer adaptation being on or off, we considered those whose results on the speech understanding and environmental awareness measures were outlying data points (i.e. below the 10th percentile; see Table 4 in the SDC). Notably, outliers in the conventional beamformer adaptation condition were mostly participants who failed the TUG, as well as the two who failed the MoCA. Outliers in the motion-based beamformer condition were mostly participants passing the TUG, ETDRS and MoCA. Overall, four different participants were outliers in both experimental conditions, with all four participants failing the TUG and one also failing MoCA. Notably, even for those who failed the TUG, the motion sensor still detected movement.
We conducted a correlation analysis to examine the possible effects of cognition on speech understanding performance in the two conditions. Based on previous research showing that cognitive abilities may contribute to individual differences in benefit from advanced hearing aid processing (Lunner Citation2003; Souza, Arehart, and Neher Citation2015; Yumba Citation2017), we expected to find a correlation between MoCA scores and speech performance scores in the control condition, but not in the motion-based beamformer condition. Motion-based beamformer adaptation activates less aggressive signal processing, which could help people with lower cognitive abilities to understand speech. However, Pearson’s product-moment correlations between MoCA scores and speech performance results were not significant in the motion-based beamformer adaptation condition performance scores (r(17) = −0.24; p = 0.33) nor in the control condition (r(17) = 0.12; p = 0.63). Thus, in the present study, speech understanding was not associated with cognitive ability in either condition.
4.5. General methodological issues
Replication of the study is limited due to the natural but uncontrolled speech stimuli and background noise. Nevertheless, by logging and describing the environmental conditions and test stimuli, we are able to describe the conditions under which the reported benefits were observed. Furthermore, when comparing both study locations in terms of environmental conditions and study results, we did not find significant differences between the two sites, indicating that the setup can be reliably transferred between similar locations and will yield the same overall results.
The chosen acoustic coupling (“power dome”) was in line with the acoustic coupling recommended by the fitting software for most participants. For two participants, the software recommended a more open coupling. However, in order to control the differences between test conditions, all participants received a closed fitting. If hearing aid users have a more open fitting, they can still benefit from the motion-based beamformer adaptation, but such benefits might be less apparent when compared to benefit from a hearing aid without this feature. Direct sound reaching the ear through the vent can deliver ITD cues and increase awareness for low-frequency sounds from all directions.
Wind noise reduction will affect beamformer settings to reduce noise disturbance and reduce hearing aid amplification in the low frequencies. This change in processing would have affected the control condition and unbalanced comparisons between the two beamformer settings. We applied a patch of fur to the hearing aid microphone openings to prevent wind from entering the microphones. Because wind noise cancellation and motion-based beamformer adaptation activate the same beamformer setting, the observed benefit of motion-based beamformer adaptation can be expected when walking in environments with or without wind.
5. Conclusion
The results suggest that hearing aid users can benefit from signal processing adapted by motion sensor input when walking in a real-world situation with traffic noise. Using the novel algorithm led to significantly better speech understanding and sound source localisation than using the conventional one. More participants expressed a preference for the novel than for the conventional algorithm in terms of speech understanding, environmental awareness, overall listening experience and sound quality. The pattern of results is mixed for those who reported having good walking, vision and cognition, but who obtained low scores on the assessment tests for these abilities. The benefits for people with mobility disabilities, such as users of canes or walkers, and benefits in other environments need to be investigated. It is the first time that a motion-based hearing aid algorithm was evaluated in a real-world situation in which the environment and feature activation were observed. The real-world setup of this study had limitations but also high use case value.
Geolocation information
This study was conducted in the Town of Oakville and the City of Burlington, Ontario, Canada.
Supplemental Material
Download MS Word (21.3 KB)Supplemental Material
Download MS Word (21.7 KB)Supplemental Material
Download MS Word (20.2 KB)Supplemental Material
Download MS Word (20.1 KB)Supplemental Material
Download MS Word (25.4 KB)Supplemental Material
Download MS Word (40.5 KB)Supplemental Material
Download MS Word (62.2 KB)Supplemental Material
Download MS Word (62.1 KB)Supplemental Material
Download MS Word (28.2 KB)Supplemental Material
Download JPEG Image (247.4 KB)
Supplemental Material
Download JPEG Image (222.7 KB)
Supplemental Material
Download JPEG Image (1.2 MB)
Supplemental Material
Download MS Word (367.5 KB)Supplemental Material
Download JPEG Image (542.8 KB)
Supplemental Material
Download JPEG Image (52.3 KB)
Supplemental Material
Download JPEG Image (3.8 MB)
TIJA-2020-08-0409-File012.docx
Download MS Word (2 MB)Acknowledgements
We thank our participants for their time and dedication during the data collection. Special thanks go to the Hearing Excellence hearing clinics for their support of this research project and to Connect Hearing for support in earlier phases of this project. We thank Jan Brunner for providing the polar plots in the SDC.
Disclosure statement
No potential conflict of interest was reported by the author(s).
Correction Statement
This article has been republished with minor changes. These changes do not impact the academic content of the article.
Additional information
Funding
References
- Al-Yawer, F., M. K. Pichora-Fuller, and N. Phillips. 2019. “The Montreal Cognitive Assessment After Omission of Hearing-Dependent Subtests: Psychometrics and Clinical Recommendations.” Journal of the American Geriatrics Society 67 (8): 1689–1694. doi:https://doi.org/10.1111/jgs.15940.
- Bentler, R. A., Y.-H. Wu, and J. Jeon. 2006. “Effectiveness of Directional Technology in Open-Canal Hearing Instruments.” The Hearing Journal 59 (11): 40, 44, 40–47. doi:https://doi.org/10.1097/01.HJ.0000286217.69092.39.
- Best, V., S. Kalluri, S. McLachlan, S. Valentine, B. Edwards, and S. Carlile. 2010. “A Comparison of CIC and BTE Hearing Aids for Three-Dimensional Localization of Speech.” International Journal of Audiology 49 (10): 723–732. doi:https://doi.org/10.3109/14992027.2010.484827.
- Brimijoin, W. O., W. M. Whitmer, D. McShefferty, and M. A. Akeroyd. 2014. “The Effect of Hearing Aid Microphone Mode on Performance in an Auditory Orienting Task.” Ear and Hearing 35 (5): 204–212. doi:https://doi.org/10.1097/AUD.0000000000000053.
- Brons, I., R. Houben, and W. A. Dreschler. 2014. “Effects of Noise Reduction on Speech Intelligibility, Perceived Listening Effort, and Personal Preference in Hearing-Impaired Listeners.” Trends in Hearing 18 (May): 233121651455392. doi:https://doi.org/10.1177/2331216514553924.
- Büchler, M., S. Allegro, S. Launer, and N. Dillier. 2005. “Sound Classification in Hearing Aids Inspired by Auditory Scene Analysis.” Eurasip Journal on Applied Signal Processing 2005 (18): 2991–3002. doi:https://doi.org/10.1155/ASP.2005.2991.
- Byrne, D., and W. Noble. 1998. “Optimizing Sound Localization with Hearing Aids.” Trends in Amplification 3 (2): 51–73. doi:https://doi.org/10.1177/108471389800300202.
- Campos, J., R. Ramkhalawansingh, and M. K. Pichora-Fuller. 2018. “Hearing, Self-Motion Perception, Mobility, and Aging.” Hearing Research 369 (October): 42–55. doi:https://doi.org/10.1016/j.heares.2018.03.025.
- Carette, E., T. van den Bogaert, M. Laureyns, and J. Wouters. 2014. “Left-Right and Front-Back Spatial Hearing with Multiple Directional Microphone Configurations in Modern Hearing Aids.” Journal of the American Academy of Audiology 25 (9): 791–803. doi:https://doi.org/10.3766/jaaa.25.9.2.
- Cord, M. T., R. K. Surr, B. E. Walden, and A. B. Dittberner. 2011. “Ear Asymmetries and Asymmetric Directional Microphone Hearing Aid Fittings.” American Journal of Audiology 20 (2): 111–122. doi:https://doi.org/10.1044/1059-0889(2011/10-0035).
- Denk, F., S. D. Ewert, and B. Kollmeier. 2019. “On the Limitations of Sound Localization with Hearing Devices.” The Journal of the Acoustical Society of America 146 (3): 1732–1744. doi:https://doi.org/10.1121/1.5126521.
- Dillon, H. 2012. Hearing Aids (2nd ed.). Sydney; New York: Boomerang Press; Thieme.
- Fischer, Tim, Christoph Schmid, Martin Kompis, Georgios Mantokoudis, Marco Caversaccio, and Wilhelm Wimmer. 2021. “Pinna-Imitating Microphone Directionality Improves Sound Localization and Discrimination in Bilateral Cochlear Implant Users.” Ear & Hearing 42 (1): 214–222. doi:https://doi.org/10.1097/AUD.0000000000000912.
- Froehlich, M., E. Branda, and K. Freels. 2019. “New Dimensions in Automatic Steering for Hearing Aids: Clinical and Real-World Findings.” Hearing Review 26 (11): 32–36.
- Gatehouse, S., and W. Noble. 2004. “Europe PMC Funders Group the Speech, Spatial and Qualities of Hearing Scale (SSQ).” International Journal of Audiology 43 (2): 85–99. doi:https://doi.org/10.1080/14992020400050014.
- Häusler, R., S. Colburn, and E. Marr. 1983. “Sound Localization in Subjects with Impaired Hearing. Spatial-Discrimination and Interaural-Discrimination Tests.” Acta oto-laryngologica. Supplementum 400: 1–62. doi:https://doi.org/10.3109/00016488309105590.
- Hawkins, D. B., and W. S. Yacullo. 1984. “Signal-to-Noise Ratio Advantage of Binaural Hearing Aids and Directional Microphones under Different Levels of Reverberation.” The Journal of Speech and Hearing Disorders 49 (3): 278–286. doi:https://doi.org/10.1044/jshd.4903.278.
- Hornsby, B. W. Y., and T. A. Ricketts. 2007. “Effects of Noise Source Configuration on Directional Benefit Using Symmetric and Asymmetric Directional Hearing Aid Fittings.” Ear and Hearing 28 (2): 177–186. doi:https://doi.org/10.1097/AUD.0b013e3180312639.
- Ibrahim, I.,. V. Parsa, E. Macpherson, and M. Cheesman. 2013. “Evaluation of Speech Intelligibility and Sound Localization Abilities with Hearing Aids Using Binaural Wireless Technology.” Audiology Research 3 (1): e1. doi:https://doi.org/10.4081/audiores.2013.e1.
- ITU-T Recommendation, P.800. 1996. “Methods for Subjective Determination of Transmission Quality.” International Telecommunication Union). Geneva, Switzerland.
- Kaiser, P. K. 2009. “Prospective Evaluation of Visual Acuity Assessment: A Comparison of Snellen versus ETDRS Charts in Clinical Practice.” Transactions of the American Ophthalmological Society 107: 311–324.
- Kavanagh, J., R. S. Barrett, and S. Morrison. 2006. “The Role of the Neck and Trunk in Facilitating Head Stability During Walking.” Experimental Brain Research 172 (4): 454–463. doi:https://doi.org/10.1007/s00221-006-0353-6.
- Keidser, Gitte, Anna O'Brien, Jens-Uwe Hain, Margot McLelland, and Ingrid Yeend. 2009. “The Effect of Frequency-Dependent Microphone Directionality on Horizontal Localization Performance in Hearing-Aid Users.” International Journal of Audiology 48 (11): 789–803. doi:https://doi.org/10.3109/14992020903036357.
- Keidser, G., K. Rohrseitz, H. Dillon, V. Hamacher, L. Carter, U. Rass, and E. Convery. 2006. “The Effect of Multi-Channel Wide Dynamic Range Compression, Noise Reduction, and the Directional Microphone on Horizontal Localization Performance in Hearing Aid Wearers.” International Journal of Audiology 45 (10): 563–579. doi:https://doi.org/10.1080/14992020600920804.
- Kühnel, V., S. Margolf-Hackl, and J. Kiessling. 2001. “Multi-Microphone Technology for Severe-to-Profound Hearing Loss.” Scandinavian Audiology 30 (1): 65–68. doi:https://doi.org/10.1080/010503901300007092.
- Kuk, F., D. Keenan, C. C. Lau, and C. Ludvigsen. 2005. “Performance of a Fully Adaptive Directional Microphone to Signals Presented from Various Azimuths.” Journal of the American Academy of Audiology 16 (6): 333–347. doi:https://doi.org/10.3766/jaaa.16.6.2.
- Kuk, F., P. Korhonen, C. Lau, D. Keenan, and M. Norgaard. 2013. “Evaluation of a Pinna Compensation Algorithm for Sound Localization and Speech Perception in Noise.” American Journal of Audiology 22 (1): 84–93. doi:https://doi.org/10.1044/1059-0889(2012/12-0043).
- Latzel, M., A. von Buol, and V. Kuehnel. 2013. Adaptive Phonak Digital (APD): Audiological Background. White Paper.
- Lindemann, U., A. Hock, M. Stuber, W. Keck, and C. Becker. 2005. “Evaluation of a Fall Detector Based on Accelerometers: A Pilot Study.” Medical & Biological Engineering & Computing 43 (5): 548–551. doi:https://doi.org/10.1007/BF02351026.
- Lunner, T. 2003. “Cognitive Function in Relation to Hearing Aid Use.” International Journal of Audiology 42 (sup1): 49–58. doi:https://doi.org/10.3109/14992020309074624.
- Lurquin, P., and S. Rafhay. 1996. “Intelligibility in Noise Using Multimicrophone Hearing Aids.” Acta Otorhinolaryngol (Belgium) 50 (2): 103–109.
- Macpherson, E. A., and D. M. Kerr. 2008. “Minimum Head Movements Required to Localize Narrowband Sounds.” The Annual Scientific and Technology Conference of the American Auditory Society (Scottsdale, Arizona).
- Martin, J. B., K. M. Krč, E. A. Mitchell, J. J. Eng, and J. W. Noble. 2012. “Pedometer Accuracy in Slow Walking Older Adults.” International Journal of Therapy and Rehabilitation 19 (7): 387–393. doi:https://doi.org/10.12968/ijtr.2012.19.7.387.
- Middlebrooks, J., and D. Green. 1991. “Sound Localization by Human Listeners.” Annual Review of Psychology 42 (1): 135–159. doi:https://doi.org/10.1146/annurev.psych.42.1.135.
- Nasreddine, Z. S., N. A. Phillips, V. Bédirian, S. Charbonneau, V. Whitehead, I. Collin, J. L. Cummings, and H. Chertkow. 2005. “The Montreal Cognitive Assessment, MoCA: A Brief Screening Tool for Mild Cognitive Impairment.” Journal of the American Geriatrics Society 53 (4): 659–695. doi:https://doi.org/10.1111/j.1532-5415.2005.53221.x.
- Nyffeler, M. 2010. “Auto ZoomControl: Automatic Change of Focus to Speech Signals of Interest.” Phonak Field Study News, September.
- Phonak 2005. “Real Ear Sound: A Simulation of the Pinna Effect Optimizes Sound Localization Also with Open Fittings.” Phonak Field Study News, 1–2. https://www.phonakpro.com/content/dam/phonakpro/gc_hq/en/resources/evidence/field_studies/documents/fsn_microsavia_realearsound_dez_05.pdf
- Picou, E. M., and T. A. Ricketts. 2017. “How Directional Microphones Affect Speech Recognition, Listening Effort and Localisation for Listeners with Moderate-to-Severe Hearing Loss.” International Journal of Audiology 56 (12): 909–918. doi:https://doi.org/10.1080/14992027.2017.1355074.
- Pumford, J. M., R. C. Seewald, S. D. Scollie, and L. M. Jenstad. 2000. “Speech Recognition with in-the-Ear and behind-the-Ear Dual-Microphone Hearing Instruments.” Journal of the American Academy of Audiology 11 (1): 23–35. http://www.scopus.com/inward/record.url?eid=2-s2.0-0034087635&partnerID=40&md5=a4a6ed02b0a68964385df313b39f8789.
- Ricketts, T. A., and B. W. Y. Hornsby. 2005. “Sound Quality Measures for Speech in Noise through a Commercial Hearing Aid Implementing “Digital Noise Reduction.” Journal of the American Academy of Audiology 16 (5): 270–277. doi:https://doi.org/10.3766/jaaa.16.5.2.
- Searchfield, G. D., T. Linford, K. Kobayashi, D. Crowhen, and M. Latzel. 2018. “The Performance of an Automatic Acoustic-Based Program Classifier Compared to Hearing Aid Users’ Manual Selection of Listening Programs.” International Journal of Audiology 27 (3): 201–212.
- Shcherbina, Anna, C. Mattsson, Daryl Waggott, Heidi Salisbury, Jeffrey Christle, Trevor Hastie, Matthew Wheeler, and Euan Ashley. 2017. “Accuracy in Wrist-Worn, Sensor-Based Measurements of Heart Rate and Energy Expenditure in a Diverse Cohort.” Journal of Personalized Medicine 7 (2): 3–12. doi:https://doi.org/10.3390/jpm7020003.
- Souza, P., K. Arehart, and T. Neher. 2015. “Working Memory and Hearing Aid Processing: Literature Findings, Future Directions, and Clinical Applications.” Frontiers in Psychology 6 (DEC): 1812–1894. doi:https://doi.org/10.3389/fpsyg.2015.01894.
- Storm, F. A., B. W. Heller, and C. Mazzà. 2015. “Step Detection and Activity Recognition Accuracy of Seven Physical Activity Monitors.” PLoS ONE 10 (3): e0118723. doi:https://doi.org/10.1371/journal.pone.0118723.
- Tessendorf, B. 2012. Multimodal Sensor and Actuator System for Hearing Instruments. Ph.D. thesis. Eidgenössische Technische Hochschule ETH Zürich, Switzerland. doi:https://doi.org/10.3929/ethz-a-007608264.
- Valente, M., D. Fabry, L. G. Potts, and D. A. Fabryt. 1995. “Recognition of Speech in Noise with Hearing Aids Using Dual Microphones.” Journal of the American Academy of Audiology 6 (6): 440–449.
- Van den Bogaert, Tim, Evelyne Carette, and Jan Wouters. 2011. “Sound Source Localization Using Hearing Aids with Microphones Placed behind-the-Ear, in-the-Canal, and in-the-Pinna.” International Journal of Audiology 50 (3): 164–176. doi:https://doi.org/10.3109/14992027.2010.537376.
- van den Bogaert, T., T. J. Klasen, M. Moonen, L. van Deun, and J. Wouters. 2006. “Horizontal Localization with Bilateral Hearing Aids: Without is Better than with.” The Journal of the Acoustical Society of America 119 (1): 515–526. doi:https://doi.org/10.1121/1.2139653.
- Voss, S. C., K. Pichora-Fuller, A. Pereira, J. Seiter, N. ElGuindi, and J. Qian. 2020. “Evaluating the Accuracy of Motion Detection Using a behind-the-Ear Sensor.” The Annual Scientific and Technology Conference of the American Auditory Society (Scottsdale, Arizona).
- Wagener, Kirsten C., Matthias Vormann, Matthias Latzel, and Hans E. Mülder. 2018. “Effect of Hearing Aid Directionality and Remote Microphone on Speech Intelligibility in Complex Listening Situations.” Trends in Hearing 22: 233121651880412–233121651880494. doi:https://doi.org/10.1177/2331216518804945.
- Wall, J. C., C. Bell, S. Campbell, and J. Davis. 2000. “The Timed Get-Up-and-Go Test Revisited: Measurement of the Component Tasks.” Journal of Rehabilitation Research and Development 37 (1): 109–114.
- Wu, Y.-H., E. Stangl, R. A. Bentler, and R. W. Stanziola. 2013. “The Effect of Hearing Aid Technologies on Listening in an Automobile.” Journal of the American Academy of Audiology 24 (6): 474–485. doi:https://doi.org/10.3766/jaaa.24.6.4.
- Wu, Y.-H., E. Stangl, O. Chipara, S. S. Hasan, A. Welhaven, and J. Oleson. 2018. “Characteristics of Real-World Signal-to-Noise Ratios and Speech Listening Situations of Older Adults with Mild-to-Moderate Hearing Loss.” Ear and Hearing 39 (2): 293–304. doi:https://doi.org/10.1097/AUD.0000000000000486.
- Yumba, W. K. 2017. “Cognitive Processing Speed, Working Memory, and the Intelligibility of Hearing Aid-Processed Speech in Persons with Hearing Impairment.” Frontiers in Psychology 8 (AUG): 1308–1313. doi:https://doi.org/10.3389/fpsyg.2017.01308.