
Abstract
Objective: Consistent symptom reporting for conditions like tinnitus that do not have an associated sign is critical for evaluating severity and intervention effectiveness, and for interpreting research findings. There is little research examining reporting of tinnitus and hearing difficulty over time. We address this here by comparing reported hearing difficulty and tinnitus at two time-points.
Design: A cross-sectional study comparing symptom reporting in March 2019 and August/September 2021 using data from two online surveys of the same cohort. Although each survey was designed to address a different question, both asked about symptoms of tinnitus and hearing difficulties and enabled this exploratory analysis.
Study sample: 6881 members of the UK general public aged 18+ years.
Results: Inconsistent reporting was evident - many participants who reported experiencing tinnitus and/or hearing difficulties in 2019, said in 2021 that they had never had such symptoms before. Additionally, reports of new tinnitus/hearing difficulties in 2021 were unexpectedly high, equating to 18-month incidence rates of 13.6% and 11.7%, respectively.
Conclusions: Psychosocial factors, expectations and context impact symptom reporting. This should be considered when treating patients and interpreting research findings. Using real-time data collection methods could thus provide a better understanding of experiences of tinnitus and hearing.
Introduction
Signs and symptoms are abnormalities that can indicate a potential medical condition. Whereas a symptom is subjective, that is, apparent only to the patient (for example back pain or fatigue), a sign is any objective evidence of a disease that can be observed by others (for example a skin rash or lump). (Nature portfolio; https://www.nature.com/subjects/signs-and-symptoms)
Consistent and reliable reporting of symptoms, particularly for conditions like tinnitus that do not have an associated sign (Jackson, Vijendren, and Phillips Citation2019) is the only basis on which a clinician can make a judgement as to the severity of a condition, the appropriateness and effectiveness of an intervention and evaluate medico-legal cases of a condition. Reliable reporting is also critical for longitudinal research studies and clinical trials.
There is little research examining the reliability of reports of tinnitus and hearing difficulty. Dawes et al. (Citation2020a) examined reported tinnitus at baseline and four years later among individuals registered in the UK biobank. Among the 3997 individuals not reporting tinnitus at baseline, the four-year incidence of tinnitus was found to be 8.7%, with tinnitus no longer being present in 18.3% (n = 150) of individuals. While the presence of tinnitus often fluctuates, what was unexpected was the finding that at the second time point, 42% of these individuals (n = 63) said they had never had tinnitus – despite reporting it at baseline. In a related manner, Weilnhammer et al. (Citation2022) examined reported hearing ability of 1028 school children (age 13–19 years) at four time points over a period of 7.5 years and found that the proportion of individuals rating their hearing as 'good' increased over time. Since it is unlikely that the hearing improved with time, other factors are likely at play.
Indeed, it is well established that the perception and reporting of symptoms are influenced by factors not directly related to the underlying pathology, such as patient expectations and psychological/mental state, how questions about symptoms are framed, the type of symptom(s) being reported and the reporting period itself. More specifically, individuals report more symptoms when:
they are told to expect them following a (sham) exposure to an irritant (Witthöft and Rubin Citation2013; Lorber, Mazzoni, and Kirsch Citation2007);
they expect them as side effects of medications (Webster, Weinman, and Rubin Citation2018), vaccinations (Petrie et al Citation2004) and public health situations (Jones et al. Citation2000; Rozenkrantz et al. Citation2022; Saunders et al. Citation2022; the nocebo effect, Häuser, Hansen, and Enck Citation2012);
they are depressed, anxious and/or emotionally distressed at the time of reporting or when the symptoms are experienced (Goldman, Kraemer, and Salovey Citation1996; Everts et al. Citation1999; Bekelman et al Citation2007; Howren and Suls Citation2011; Funch Citation1988);
they are given a checklist of symptoms to complete as opposed to being interviewed (Villemure, Nolin, and Le Sage Citation2011);
the reporting period is longer (i.e. reporting on symptoms experienced in the last month vs. those in the last day or week) (Broderick et al. Citation2008; Walentynowicz et al. Citation2015).
Hearing- and tinnitus-related symptoms have shown some of these same associations. For instance, Simões et al. (Citation2019, Citation2021) reported that neuroticism and extraversion were predictors of tinnitus distress over time. Dode et al. (Citation2021) found that symptom recall differed depending on whether symptoms were reported in real time using an app or via an end-of-day questionnaire, and Saunders et al. (Citation2022) reported that emotional distress, as reflected in the number of reported psychosocial challenges encountered was positively and significantly associated with reported auditory symptoms (tinnitus and hearing difficulty).
The aim of this current study was to investigate the consistency of self-reported hearing difficulty and tinnitus at two time points using data from large-scale online surveys of members of the general public. A Wave 1 survey was distributed in 2019, with a follow-up Wave 2 survey being distributed in August/September 2021 during the COVID-19 pandemic. In previous analyses of these data (Saunders et al. Citation2022) we examined the association between the reporting of an array of symptoms, including tinnitus and hearing difficulty, and whether or not the participant reported having been ill with COVID-19. These analyses showed that symptom reporting was influenced by the respondent’s expectations around symptoms - indicating that factors other than the underlying pathology influenced symptom reporting. We were thus interested in further examining this as regards consistency of reports about tinnitus and hearing difficulty at the two time points. We had the following expectations:
Individuals who reported tinnitus and/or hearing difficulty in Wave 1 would report tinnitus and/or hearing difficulty at Wave 2 since the Wave 2 question asked about current and/or past symptoms.
Individuals who reported never having had tinnitus and/or hearing difficulties at Wave 2 would not have reported tinnitus and/or hearing difficulties in Wave 1.
The 18-month incidence of each condition would be the proportion of individuals reporting new tinnitus and/or new hearing difficulty in Wave 2 (i.e. the time between the Wave 1 and Wave surveys, specifically March 2019 and August 2020), while the 12-month incidence would be the proportion of individuals who reported new hearing difficulty/tinnitus in Wave 2 that they said had begun before March 2020.
Methods
Study design
A cross-sectional study comparing symptom reporting at two time points was undertaken. The data were collected from two large-scale online surveys using the same cohort – a Wave 1 survey that was completed in March 2019 (Armitage et al. Citation2021), and a Wave 2 survey completed in August-September 2021 (Saunders et al. Citation2022). The purpose of the Wave 1 survey was to investigate people’s perceptions of their personal risk regarding cancer, heart disease and hearing loss, while the purpose of the Wave 2 survey was to examine the extent to which self-reported hearing difficulty, tinnitus and other symptoms were associated with COVID-19. Only the questions directly asking about tinnitus and hearing difficulty were analysed here.
The study was approved by the University of Manchester Research Ethics Committee (Ref: 2020-10483-16733). Informed consent was obtained online as a condition for beginning the survey. The study was preregistered on the Open Science Framework (https://osf.io/35p6t/).
Participants and recruitment
The inclusion criteria for Wave 1 were participants aged 18 years or over who lived in the UK (Armitage et al. Citation2021). The inclusion criterion for Wave 2 was having completed the Wave 1 survey.
The study was conducted via YouGov, an internet-based market research company that conducts online surveys using active sampling in which participants invited to complete a survey are selected because they meet specified criteria. The 10,401 participants that had completed the Wave 1 survey were invited by email to complete the Wave 2 survey. Any that had not responded within two weeks were sent a follow-up reminder to do so. Participants who complete a YouGov survey are reimbursed in the form of points that accumulate across surveys and can then be exchanged for rewards.
Among other questions, both surveys asked
“Do you have any difficulty with your hearing?”
“Do you have tinnitus (noises in the head or ears) lasting more than 5 min?”
The Wave 1 response options were “yes” and “no”.
The Wave 2 questions were prefaced by the statement “We want to know a bit about your health and some symptoms you may have had. Put a tick in the box that describes whether you have each symptom and approximately when each began”. Response options were:
Not had this symptom/Symptom began before March 2020 (i.e. before the pandemic)
Symptom began when I got ill with COVID
Symptom began a few weeks after I had COVID
Symptom began a few months after I had COVID
Symptom began during the pandemic but not because I had COVID
I don’t know/am unsure when the symptom began.
Response options indicating symptom onset after March 2020 (i.e. during the COVID-19 pandemic) were combined for the analyses here.
Wave 2 participants who reported tinnitus were asked “Which best describes your tinnitus?” (It is there most of the time/It is there some of the time/I don’t notice it very often) and How bothersome, if at all, is your tinnitus? (Extremely/Very/Moderately/Mildly/Not at all). Those reporting hearing difficulties were asked “My hearing is: (Poor/Fair/Good/Very good/Excellent), and How much difficulty do you have following a conversation if there is background noise? (Great difficulty/Moderate difficulty/Slight difficulty)”.
Analyses
A fully anonymised data set was sent via email as an SPSS data file (.SAV) to researchers at the University of Manchester. Descriptive statistics were carried out using IBM SPSS Statistics 25 from IBM Corp 2017. The data reported here were exploratory analyses arising following completion of the pre-registered confirmatory analyses already published (Saunders et al. Citation2022). The data were analysed with a view to examining whether participants were consistent in their reporting of auditory symptoms.
Results
Complete surveys were obtained from 66.2% (n = 6881) of the 10,401 individuals who completed the Wave 1 survey (Saunders et al. (Citation2022); it is these data that are presented here. There were no missing data because the questionnaire platform required a response for all items in order to proceed. Response options of “Prefer not to say” and/or “I don’t know/can’t” were provided. Less than 1% of participants gave these responses for the demographic questions. The data are presented below for all other questions.
Participants ranged in age from 18 to 91 years (mean= 52.7 years; SD = 16.1), 53% were female, 95.4% were white, 10% lived in Scotland, 5% in Wales and 1.7% in Northern Ireland. The remainder lived in England, 33.8% of whom lived in London or the South East.
shows the percentage and numbers of individuals who answered “yes” in Wave 1 to the question “Do you have tinnitus (noises in the head or ears lasting more than 5 min)?” and/or “Do you have difficulty hearing?” and who selected response options b to g in Wave 2.
Table 1. Reported tinnitus and hearing difficulty by Wave.
For the group as a whole, 355 more individuals reported tinnitus in Wave 2 than in Wave 1, while 222 fewer individuals reported hearing difficulty in Wave 2 than Wave 1. These findings are further examined below.
shows the proportions of reported tinnitus and hearing difficulty at each wave separately. While 83.7% and 79.5% of individuals respectively, gave the same responses to the presence of tinnitus and/or hearing difficulty at both waves, the remaining respondents gave different answers on each occasion. Specifically, 10.7% of respondents who said they did not have tinnitus in Wave 1 reported tinnitus at Wave 2, as did 11.8% reporting hearing difficulties at Wave 2. These individuals reflect cases with new reports of tinnitus and hearing difficulties. There were 5.6% of respondents who reported tinnitus in Wave 1 who said at Wave 2 that they had never experienced tinnitus before, and 8.6% of respondents who reported hearing difficulty in Wave 1 who said at Wave 2 that they had not experienced hearing difficulty before. This translates to almost 30% of people who had tinnitus in Wave 1 (383 of 1446 respondents), and 47.4% of people who had hearing difficulty in Wave 1 (816 of 1814 respondents), not recalling ever had those symptoms by Wave 2.
Table 2. Relationship between reported symptoms at Wave 1 and Wave 2 for tinnitus (upper section) and hearing difficulties (lower section) separately.
show these data relative to the reported onset of each condition. and show reported tinnitus and hearing difficulty respectively based on Wave 1 responses, while and show reported tinnitus and hearing difficulty respectively based on Wave 2 responses. The solid grey circles indicate responses that are logically impossible, while the dashed grey circles indicate responses that, while not logically impossible, are implausible.
Figure 1. Number and proportion of individuals reporting tinnitus in Wave 2 relative to their reports of tinnitus at Wave 1, along with reported time of onset. Solid grey circles indicate responses that are logically impossible; dashed grey circles indicate responses that are implausible (see text for more explanation). The number and proportion of individuals who reported tinnitus in Wave 1 but who in Wave 2 said they had never had tinnitus is shown in italic font. The nominal 18-month incidence of tinnitus is shown in underlined text.
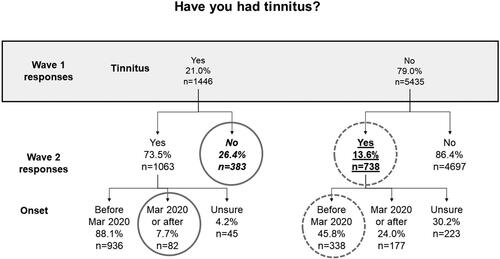
Figure 2. Number and proportion of individuals reporting hearing difficulty in Wave 2 relative to their reports of hearing difficulty at Wave 1, along with time of onset. Solid grey circles indicate responses that are logically impossible; dashed grey circles indicate responses that are implausible (see text for more explanation). The number and proportion of individuals who reported hearing difficulty in Wave 1 but who in Wave 2 said they had never had hearing difficulty is shown in italic font. The nominal 18-month incidence of hearing difficulty is shown in underlined text.
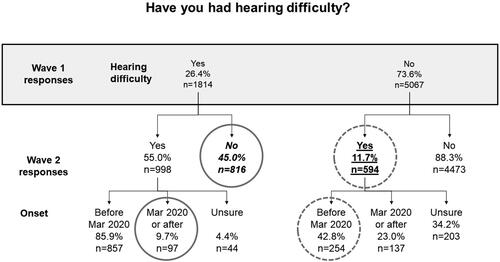
Figure 3. Number and proportion of individuals reporting tinnitus in Wave 1 relative to their reports of tinnitus at Wave 2. Solid grey circles indicate responses that are logically impossible; dashed grey circles indicate responses that are implausible (see text for more explanation). The number and proportion of individuals who reported never having had tinnitus in Wave 2 but who in Wave 1 said they had tinnitus is shown in italic font. The nominal 12-month incidence of tinnitus is shown in underlined text.
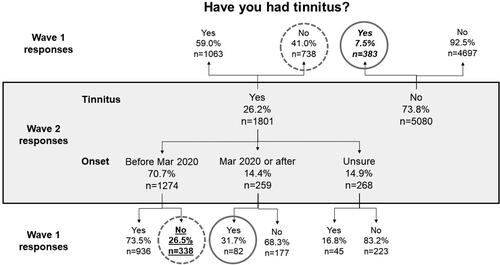
Figure 4. Number and proportion of individuals reporting hearing difficulty in Wave 1 relative to their reports of hearing difficulty at Wave 2. Solid grey circles indicate responses that are logically impossible; dashed grey circles indicate responses that are implausible (see text for more explanation). The number and proportion of individuals who reported never having had hearing difficulty in Wave 2 but who in Wave 1 said they experienced hearing difficulty is shown in italic font. The nominal 12-month incidence of hearing difficulty is shown in underlined text.
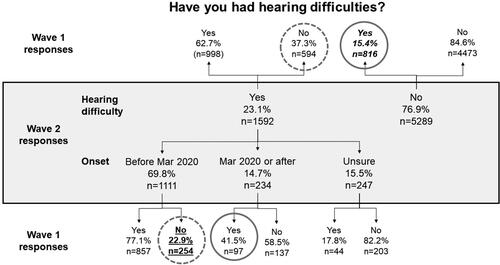
The responses that are logically impossible are (i) Wave 1 reports of tinnitus/hearing difficulty coupled with Wave 2 reports of never having had tinnitus/hearing difficulty and (ii) Wave 1 reports of tinnitus/hearing difficulty coupled with Wave 2 reports of tinnitus/hearing difficulty that began after March 2020.
The responses that are implausible are (i) Wave 1 reports of no tinnitus/hearing difficulty coupled with Wave 2 reports of tinnitus/hearing difficulty that began before March 2020. This is because the time interval between Waves 1 and 2 was just 18 months and the one-year incidence of new tinnitus is low (Nondahl et al. Citation2010; Martinez et al. Citation2015; Dawes et al. Citation2020b), while for hearing loss it is not established.
show there were many logically impossible and implausible reports of both hearing difficulty and tinnitus. For instance, in , it is seen that 82 individuals who reported tinnitus in Wave 1 said in Wave 2 that their tinnitus began after March 2020.
Examining these figures relative to the expectations outlined above, we see none of the expectations were met. Specifically:
26.4% of individuals reporting tinnitus in Wave 1 and 45.0% of individuals reporting hearing difficulties in Wave 1, reported in Wave 2 never having experienced these symptoms before (italic font in and ).
7.5% and 15.4% of individuals who reported tinnitus and/or hearing difficulties respectively in Wave 1, said at Wave 2 that they had never before experienced such symptoms (italic font in and ).
The nominal 18-month incidence of tinnitus and hearing difficulty respectively was 13.6% and 11.7% respectively (underlined text in and ), while the nominal 12-month incidence was 26.5% and 22.9% respectively (underlined text in and ). These figures are considerably higher than would be expected from prior studies (Martinez et al. Citation2015; Dawes et al. Citation2020b).
Symptom severity
On the assumption that milder symptoms could go unnoticed, and thus unreported under some circumstances, it seems conceivable that reported symptom severity could underlie some of the impossible and implausible symptom reports above. To this end, we explored reported symptom severity and its relationship to reporting consistency. shows the associations between reported symptom severity for those reporting each symptom at Wave 2, and whether or not the symptom was reported at Wave 1.
Table 3. Associations between Wave 1 tinnitus and hearing difficulty and Wave 2 severity ratings.
It is seen that 83.6% of respondents who reported noticing their tinnitus “most of the time” (top row of ) reported tinnitus in Wave 1, as compared with just 26.8% of respondents who reported “not noticing their tinnitus often” (3rd row of ). This suggests that either new tinnitus is milder than longer-term tinnitus, or that people who do not notice their tinnitus often are less consistent in reporting about it. Similarly, 94.3% of people of the individuals who rated their hearing as “poor” reported hearing difficulties in both waves, as compared to just 30.5% of individuals who rated their hearing as “good”, “very good” or “excellent”. Similar associations exist for the questions about tinnitus bothersomeness and speech understanding in noise. Chi-squared analyses showed these associations to be statistically significant (p < 0.001), indicating an association between consistency of symptom reporting and symptom severity.
Discussion
The aim of this paper was to examine the consistency of reporting about tinnitus and hearing difficulty. This was achieved by comparing survey responses at two time points: March 2019 and August/September 2021. If respondents had been consistent in their reporting, then (a) all individuals who reported tinnitus or hearing difficulties in Wave 1 would have also reported them in Wave 2 - since the question asked whether these symptoms had ever been experienced; and (b) reports of new symptoms would be low since the annual incidence rate of tinnitus is less than 5.5% (Nondahl et al. Citation2010; Martinez et al. Citation2015; Dawes et al. Citation2020b). By these metrics, our data show inconsistent reporting. Specifically, 7.5% of individuals who reported tinnitus and 15.4% of individuals who reported hearing difficulties in Wave 1 said in Wave 2 that they had never had such symptoms before; and reports of new tinnitus and hearing difficulties suggest 18-month incidence rates of 13.6% and 11.7% respectively. As discussed below, there are several possible explanations for these findings.
The first possibility is that symptoms of tinnitus and hearing difficulty did in fact fluctuate over time and that the inconsistencies here are due to real changes in tinnitus and hearing difficulties. Indeed, tinnitus is exacerbated by stress, diet, medications and sleep patterns (Mazurek, Boecking, and Brueggemann Citation2019; Dawes et al. Citation2020a; Curhan et al. Citation2022), hearing is temporarily affected by upper respiratory infection, and the acoustic environment affects perceived (and thus reported) tinnitus and hearing difficulties. Wave 2 data were collected during the COVID-19 pandemic during which time stress levels were high (Manchia et al. Citation2022), masks were being worn ubiquitously which affected communication (Oosthuizen et al Citation2022), lifestyles were generally quieter (Knickerbocker et al. Citation2021; Smith et al. Citation2020, Citation2021), and many people had more time to engage in activities such as relaxation, mindfulness and exercise which are known to help with tinnitus management (Beukes et al. Citation2021). Any of all of these factors could have impacted symptom reporting. Further, some of the study participants reported having been ill with COVID-19 which some, but not all, studies conclude causes tinnitus and hearing loss (see systematic reviews of Almufarrij and Munro Citation2021; Jafari, Kolb, and Mohajerani Citation2022; Lough et al. Citation2022). Nonetheless, although the timing of the Wave 2 survey could in part explain the implausibly high incidence of tinnitus and hearing difficulty, it cannot explain why individuals who reported tinnitus and/or hearing difficulty in Wave 1 said in Wave 2 that they had never experienced these symptoms.
The unexpectedly high rates of new tinnitus and hearing difficulty in Wave 2 could also have been due to the context in which the surveys took place. The Wave 1 survey was conducted in 2019 as was described as a survey about perception of personal risk of health conditions, while the Wave 2 survey was conducted in the summer of 2021 during the COVID-19 pandemic, and was described as looking at symptoms experienced during the COVID-19 pandemic. The Wave 2 survey could have led to increased reporting of symptoms relative to Wave 1 because of the nocebo effect associated with COVID-19 (Saunders et al. Citation2022). Rozenkrantz et al. (Citation2022) reported such findings in a study in which they examined whether beliefs about COVID-19 influenced the experience of unexplained symptoms over time. Their participants completed questionnaires to assess symptoms, recent diagnoses, anxiety, resilience, health locus of control, beliefs about COVID-19, including actual and perceived risk of illness, in May 2020 and then one-month and six-months later. They found that participants who thought they would have more severe symptoms if they were to contract COVID-19 experienced more of those symptoms several weeks later. They also found that expected symptom severity and reporting was higher in individuals with lower perceived immunity and resilience. They concluded that beliefs about hypothetical symptoms predict symptoms experienced at a later time. Other findings from the data here published by Saunders et al. (Citation2022) suggest similar factors are at play. Specifically, more than 60% of the participants here who had COVID-19, said it had affected their toothache - despite a lack of evidence linking the two, and participants with confirmed COVID-19 or who not had COVID-19 reported fewer auditory and tooth-related symptoms than did participants who thought they had probably had COVID-19. These both suggest beliefs about COVID-19 impacted reported symptoms.
Symptom severity could in part explain why some individuals who reported tinnitus and/or hearing difficulty in Wave 1 said in Wave 2 that they had never experienced these symptoms. Our data showed that individuals with more severe symptoms at Wave 2 were more likely to have reported those symptoms at Wave 1 than those with less severe symptoms. This applied to both tinnitus and hearing difficulties. Others have reported similar for cardiovascular (Wells and Horwood Citation2004) and depression (Lindsay et al. Citation2009) symptoms. We acknowledge that the most appropriate way to explore this relationship here would be to have examined how reported severity at Wave 1 affected reporting at Wave 2. Unfortunately, severity ratings were not available from the Wave 1 survey, thus we had to examine the reverse pathway (severity at Wave 2 relative to reporting at Wave 1). We do of course recognise that our findings could simply indicate that new symptoms are less severe than longer-term symptoms, rather than that reporting is more consistent when symptoms are more severe.
A final factor to consider is attentiveness during survey completion. We cannot know the extent to which careless or inattentive survey completion impacted our findings however, as noted by Ternovski and Orr (Citation2020) there is empirical evidence that since 2020 inattentive survey completion has increased – perhaps because surveys have become so ubiquitous. This issue has been highlighted by many (e.g. Alvarez et al. Citation2019; Berry et al. Citation2019; Roberts et al. Citation2019) and should raise concerns about the validity of data from surveys conducted using convenience sampling via online platforms such as Lucid, MTurk, or YouGov – the platform used in this study. However, online survey completion is now widespread presumably because it is efficient, effective and inexpensive relative to paper and pen completion, so rather than dismissing the findings as unreliable, we should embed questions to assess inattentiveness and omit data accordingly.
This study of course has its limitations primarily because it was not specifically designed to examined reporting consistency. As a result, the questions asked about symptoms were framed slightly differently on each occasion, severity data were unavailable from Wave 1, and the recall timeframe in Wave 2 could have been misinterpreted. Nonetheless, the data provided a forum for examining reporting consistency even if there still remains a need to disentangle the impact of the pandemic on symptom reporting. To this end, now that pre-COVID-19 lifestyles have returned for most, a Wave 3 survey would seem to be of value.
Conclusions
Not all of our findings can be attributed to the confounding factor of the COVID-19 pandemic. The bottom line is that the impact of psychosocial factors, expectations and context on the reporting of symptoms during both clinical practice and research should be considered. Our data suggest that broader use of real-time data collection methods such as ecological momentary assessment, both clinically as well as in research, could result in a better understanding of patient’s experiences of tinnitus and hearing. Further, the findings highlight the importance of considering the reporting timeframe, and wording used in self-report questionnaires especially when comparing data from different questionnaires, time-points and/or studies. Finally, the data raise the issue of how best to assess symptoms in a clinical setting, and when designing research protocols.
Author contributions
GHS, EWB, KU, CJA and KJM contributed to conception and design of the study. GHS performed the statistical analysis. GHS wrote the first draft of the manuscript. All authors contributed to manuscript revision, read and approved the submitted version.
Disclosure statement
The authors declare that the research was conducted in the absence of any commercial or financial relationships that could be construed as a potential conflict of interest.
Additional information
Funding
References
- Almufarrij, I., and K. J. Munro. 2021. “One Year on: An Updated Systematic Review of SARS-CoV-2, COVID-19 and Audio-vestibular Symptoms.” International Journal of Audiology 60 (12): 935–945. doi:10.1080/14992027.2021.1896793.
- Alvarez, R. M., L. R. Atkeson, I. Levin, and Y. Li. 2019. “Paying Attention to Inattentive Survey Respondents.” Political Analysis 27 (2): 145–162. doi:10.1017/pan.2018.57.
- Armitage, C. J., K. J. Munro, R. Mandavia, and A. G. M. Schilder. 2021. “What Health Policy Makers Need to Know about Mismatches between Public Perceptions of Disease Risk, Prevalence and Severity: A National Survey.” International Journal of Audiology 60 (12): 979–984. doi:10.1080/14992027.2021.1881175.
- Bekelman, D. B., E. P. Havranek, D. M. Becker, J. S. Kutner, P. N. Peterson, I. S. Wittstein, S. H. Gottlieb, T. E. Yamashita, D. L. Fairclough, and S. M. Dy. 2007. “Symptoms, Depression, and Quality of Life in Patients with Heart Failure.” Journal of Cardiac Failure 13 (8): 643–648. doi:10.1016/j.cardfail.2007.05.005.
- Berry, K., R. Rana, A. Lockwood, L. Fletcher, and D. Pratt. 2019. “Factors Associated with Inattentive Responding in Online Survey Research.” Personality and Individual Differences 149: 157–159. doi:10.1016/j.paid.2019.05.043.
- Beukes, E. W., J. Onozuka, T. P. Brazell, and V. Manchaiah. 2021. “Coping With Tinnitus During the COVID-19 Pandemic.” American Journal of Audiology 30 (2): 385–393. doi:10.1044/2021_AJA-20-00188.
- Broderick, J. E., J. E. Schwartz, G. Vikingstad, M. Pribbernow, S. Grossman, and A. A. Stone. 2008. “The Accuracy of Pain and Fatigue Items across Different Reporting Periods.” Pain 139 (1): 146–157. doi:10.1016/j.pain.2008.03.024.
- Curhan, S. G., J. Glicksman, M. Wang, R. D. Eavey, and G. C. Curhan. 2022. “Longitudinal Study of Analgesic Use and Risk of Incident Persistent Tinnitus.” Journal of General Internal Medicine 37 (14): 3653–3662. doi:10.1007/s11606-021-07349-5.
- Dawes, P., K. J. Cruickshanks, A. Marsden, D. R. Moore, and K. J. Munro. 2020a. “Relationship Between Diet, Tinnitus, and Hearing Difficulties.” Ear and Hearing 41 (2): 289–299. doi:10.1097/AUD.0000000000000765.
- Dawes, P., J. Newall, D. Stockdale, and D. M. Baguley. 2020b. “Natural History of Tinnitus in Adults: A Cross-sectional and Longitudinal Analysis.” BMJ Open 10 (12):e041290. doi:10.1136/bmjopen-2020-041290.
- Dode, A., M. Mehdi, R. Pryss, W. Schlee, T. Probst, M. Reichert, F. Hauck, and M. Winter. 2021. “Using a Visual Analog Scale (VAS) to Measure Tinnitus-related Distress and Loudness: Investigating Correlations Using the Mini-TQ Results of Participants from the TrackYourTinnitus Platform.” Progress in Brain Research 263: 171–190. doi:10.1016/bs.pbr.2020.08.008.
- Everts, B., B. Karlson, P. Währborg, N. Abdon, J. Herlitz, and T. Hedner. 1999. “Pain Recollection after Chest Pain of Cardiac Origin.” Cardiology 92 (2): 115–120. doi:10.1159/000006958.
- Funch, D. P. 1988. “Predictors and Consequences of Symptom Reporting Behaviors in Colorectal Cancer Patients.” Medical Care 26 (10): 1000–1008. doi:10.1097/00005650-198810000-00008.
- Goldman, S. L., D. T. Kraemer, and P. Salovey. 1996. “Beliefs about Mood Moderate the Relationship of Stress to Illness and Symptom Reporting.” Journal of Psychosomatic Research 41 (2): 115–128. doi:10.1016/0022-3999(96)00119-5.
- Häuser, W., E. Hansen, and P. Enck. 2012. “Nocebo Phenomena in Medicine: Their Relevance in Everyday Clinical Practice.” Deutsches Arzteblatt International 109 (26): 459–465. doi:10.3238/arztebl.2012.0459.
- Howren, M. B., and J. Suls. 2011. “The Symptom Perception Hypothesis Revised: Depression and Anxiety Play Different Roles in Concurrent and Retrospective Physical Symptom Reporting.” Journal of Personality and Social Psychology 100 (1): 182–195. doi:10.1037/a0021715.
- Jackson, R., A. Vijendren, and J. Phillips. 2019. “Objective Measures of Tinnitus: A Systematic Review.” Otology & Neurotology 40 (2): 154–163. doi:10.1097/MAO.0000000000002116.
- Jafari, Z., B. E. Kolb, and M. H. Mohajerani. 2022. “Hearing Loss, Tinnitus, and Dizziness in COVID-19: A Systematic Review and Meta-analysis.” The Canadian Journal of Neurological Sciences. Le Journal Canadien Des Sciences Neurologiques 49 (2): 184–195. doi:10.1017/cjn.2021.63.
- Jones, T. F., A. S. Craig, D. Hoy, E. W. Gunter, D. L. Ashley, D. B. Barr, J. W. Brock, and W. Schaffner. 2000. “Mass Psychogenic Illness Attributed to Toxic Exposure at a High School.” The New England Journal of Medicine 342 (2): 96–100. doi:10.1056/NEJM200001133420206.
- Knickerbocker, A., S. Bourn, M. R. Goldstein, and A. Jacob. 2021. “Cochlear Implant Outcomes in Elderly Recipients during the COVID-19 Pandemic.” Otology & Neurotology 42 (9): e1256–e1262. doi:10.1097/MAO.0000000000003291.
- Lindsay, G. M., K. A. Niven, E. E. Brodie, A. Gaw, and P. R. Belcher. 2009. “Accuracy of Patient Recall of Preoperative Symptom Severity (Angina and Breathlessness) at One Year Following Aorta-coronary Artery Bypass Grafting.” Journal of Clinical Nursing 18 (3): 418–425. doi:10.1111/j.1365-2702.2008.02559.x.
- Lorber, W., G. Mazzoni, and I. Kirsch. 2007. “Illness by Suggestion: Expectancy, Modeling, and Gender in the Production of Psychosomatic Symptoms.” Annals of Behavioral Medicine: A Publication of the Society of Behavioral Medicine 33 (1): 112–116. doi:10.1207/s15324796abm3301_13.
- Lough, M., I. Almufarrij, H. Whiston, and K. J. Munro. 2022. “Revised Meta-analysis and Pooled Estimate of Audio-vestibular Symptoms Associated with COVID-19.” International Journal of Audiology 61 (8): 705–709. doi:10.1080/14992027.2021.1962552.
- Manchia, M., A. W. Gathier, H. Yapici-Eser, M. V. Schmidt, D. de Quervain, T. van Amelsvoort, J. I. Bisson, et al. 2022. “The Impact of the Prolonged COVID-19 Pandemic on Stress Resilience and Mental Health: A Critical Review across Waves.” European Neuropsychopharmacology: The Journal of the European College of Neuropsychopharmacology 55: 22–83. doi:10.1016/j.euroneuro.2021.10.864.
- Martinez, C., C. Wallenhorst, D. McFerran, and D. A. Hall. 2015. “Incidence Rates of Clinically Significant Tinnitus: 10-Year Trend from a Cohort Study in England.” Ear and Hearing 36 (3): e69–e75. doi:10.1097/AUD.0000000000000121.
- Mazurek, B., B. Boecking, and P. Brueggemann. 2019. “Association between Stress and Tinnitus-new Aspects.” Otology & Neurotology 40 (4): e467–e473. doi:10.1097/MAO.0000000000002180.
- Nondahl, D. M., K. J. Cruickshanks, T. L. Wiley, B. E. Klein, R. Klein, R. Chappell, and T. S. Tweed. 2010. “The Ten-year Incidence of Tinnitus among Older Adults.” International Journal of Audiology 49 (8): 580–585. doi:10.3109/14992021003753508.
- Oosthuizen, I., G. H. Saunders, V. Manchaiah, and W. Swanepoel. 2022. “Impact of SARS-CoV-2 Virus (COVID-19) Preventative Measures on Communication: A Scoping Review.” Frontiers in Public Health 10: 815259. doi:10.3389/fpubh.2022.815259.
- Petrie, K. J., R. Moss-Morris, C. Grey, and M. Shaw. 2004. “The Relationship of Negative Affect and Perceived Sensitivity to Symptom Reporting Following Vaccination.” British Journal of Health Psychology 9 (Pt 1): 101–111. doi:10.1348/135910704322778759.
- Roberts, C., E. Gilbert, N. Allum, and L. Eisner. 2019. “Research Synthesis: Satisficing in Surveys: A Systematic Review of the Literature.” Public Opinion Quarterly 83 (3): 598–626. doi:10.1093/poq/nfz035.
- Rozenkrantz, L., T. Kube, M. H. Bernstein, and J. D. E. Gabrieli. 2022. “How Beliefs about Coronavirus Disease (COVID) Influence COVID-like Symptoms? - A Longitudinal Study.” Health Psychology 41 (8): 519–526. doi:10.1037/hea0001219.
- Saunders, G. H., E. Beukes, K. Uus, C. J. Armitage, J. Kelly, and K. J. Munro. 2022. “Shedding Light on SARS-CoV-2, COVID-19, COVID-19 Vaccination, and Auditory Symptoms: Causality or Spurious Conjunction?” Frontiers in Public Health 10: 837513. doi:10.3389/fpubh.2022.837513.
- Simões, J. P., P. K. A. Neff, B. Langguth, W. Schlee, and M. Schecklmann. 2021. “The Progression of Chronic Tinnitus over the Years.” Scientific Reports 11 (1): 4162. doi:10.1038/s41598-021-83068-5.
- Simões, J., W. Schlee, M. Schecklmann, B. Langguth, D. Farahmand, and P. Neff. 2019. “Big Five Personality Traits Are Associated with Tinnitus Improvement over Time.” Scientific Reports 9 (1): 18234. doi:10.1038/s41598-019-53845-4.
- Smith, L. M., L. Wang, K. Mazur, M. Carchia, G. DePalma, R. Azimi, S. Mravca, and R. L. Neitzel. 2020. “Impacts of COVID-19-related Social Distancing Measures on Personal Environmental Sound Exposure.” Environmental Research Letters 15 (10): 104094. doi:10.1088/1748-9326/abb494.
- Smith, L., L. Wang, K. Mazur, M. Carchia, G. DePalma, R. Azimi, S. Mravca, and R. L. Neitzel. 2021. “Erratum: Impacts of COVID-19-related Social Distancing Measures on Personal Environmental Sound Exposures.” Environmental Research Letters. 16: 104094. doi:10.1088/1748-9326/abdbee.
- Ternovski, J., and L. Orr. 2020. “A Note on Increases in Inattentive Online Survey-takers Since.” J Quantitative Description: Digital Media 2: 1–35. doi:10.51685/jqd.2022.002.
- Villemure, R., P. Nolin, and N. Le Sage. 2011. “Self-reported Symptoms during Post-mild Traumatic Brain Injury in Acute Phase: Influence of Interviewing Method.” Brain Injury 25 (1): 53–64. doi:10.3109/02699052.2010.531881.
- Walentynowicz, M., K. Bogaerts, I. Van Diest, F. Raes, and O. Van den Bergh. 2015. “Was It so Bad? The Role of Retrospective Memory in Symptom Reporting.” Health Psychology 34 (12): 1166–1174. doi:10.1037/hea0000222. Erratum in: Health Psychology 2015; 34(12): 1184.
- Webster, R. K., J. Weinman, and G. J. Rubin. 2018. “Medicine-related Beliefs Predict Attribution of Symptoms to a Sham Medicine: A Prospective Study.” British Journal of Health Psychology 23 (2): 436–454. doi:10.1111/bjhp.12298.
- Weilnhammer, V., D. Gerstner, J. Huß, F. Schreiber, C. Alvarez, T. Steffens, C. Herr, and S. Heinze. 2022. “Exposure to Leisure Noise and Intermittent Tinnitus among Young Adults in Bavaria: Longitudinal Data from a Prospective Cohort Study.” International Journal of Audiology 61 (2): 89–96. doi:10.1080/14992027.2021.1899312.
- Wells, J. E., and L. J. Horwood. 2004. “How Accurate Is Recall of Key Symptoms of Depression? A Comparison of Recall and Longitudinal Reports.” Psychological Medicine 34 (6): 1001–1011. doi:10.1017/s0033291703001843.
- Witthöft, M., and G. J. Rubin. 2013. “Are Media Warnings about the Adverse Health Effects of Modern Life Self-fulfilling? An Experimental Study on Idiopathic Environmental Intolerance Attributed to Electromagnetic Fields (IEI-EMF).” Journal of Psychosomatic Research 74 (3): 206–212. doi:10.1016/j.jpsychores.2012.12.002.