
Abstract
Objective
The EUSCREEN project concerns the study of European vision and hearing screening programmes. Part of the project was the development of a cost-effectiveness model to analyse such programmes. We describe the development and usability of an online tool to enable stakeholders to design, analyse or modify a newborn hearing screening (NHS) programme.
Design
Data from literature, from existing NHS programmes, and observations by users were used to develop and refine the tool. Required inputs include prevalence of the hearing impairment, test sequence and its timing, attendance, sensitivity, and specificity of each screening step. Outputs include the number of cases detected and the costs of screening and diagnostics.
Study sample
Eleven NHS programmes with reliable data.
Results
Three analyses are presented, exploring the effect of low attendance, number of screening steps, testing in the maternity ward, or screening at a later age, on the benefits and costs of the programme. Knowledge of the epidemiology of a staged screening programme is crucial when using the tool.
Conclusions
This study presents a tool intended to aid stakeholders to design a new or analyse an existing hearing screening programme in terms of benefits and costs.
Introduction
The World Health Organisation recommends the adoption of universal newborn hearing screening (UNHS) in all communities with available rehabilitation services (WHO Citation2017). UNHS is considered beneficial and cost-effective as it results in a lower age of identification and intervention, improved language development and lower societal costs (Yoshinaga-Itano Citation2021).
Hearing screening in children was studied as part of the EUSCREEN project. This extensive project involved an inventory of existing hearing screening provisions for newborns and children in 47 European and some additional countries or regions. For this purpose, a consortium of country representatives was formed (Bussé Citation2021).
The results of the inventory showed that most European countries have firmly established nationwide universal NHS programmes. However, the screening protocols differ considerably in the number of screening steps, timing of the steps in terms of the infant’s age and the interval between steps (Bussé Citation2021; Mackey Citation2021). The rationale for these choices appears to be based more on expert opinion and local circumstances than on scientific evidence. Calculating the cost-effectiveness of hearing screening programmes may provide a more objective method to determine the most optimal screening protocol, tailored to relevant circumstances.
Earlier reported evaluations of costs and effectiveness of hearing screening programmes concerned issues as screening versus no screening, selective versus universal screening, or hospital versus community screening, but no detailed screening protocols were compared (Keren Citation2002; Grill Citation2006; Huang Citation2012).
The EUSCREEN project also included the implementation of a newborn hearing screening (NHS) programme in Albania (Bussé Citation2020a). Based on the results in Albania, a model to analyse the cost-effectiveness of hearing screening programmes was developed (Verkleij et al. Citation2021). The model enables comparison of various screening protocols for the Albanian situation.
In this article, we describe the development of a web tool to calculate the cost-effectiveness of various newborn hearing screening programmes and how the web tool can be of benefit to health care officials when designing or analysing a newborn hearing screening programme. We illustrate this by analysing and interpreting the outcomes of some common NHS protocols.
Methods
From MISCAN model to web tool
The web tool is derived from the microsimulation model developed to simulate various NHS protocols in Albania. The model is based on the Microsimulation Screening Analysis (MISCAN), used to evaluate cancer screening programmes (Heijnsdijk Citation2015; van Hees Citation2015; Sankatsing Citation2015). In this microsimulation model, individuals are followed from birth to death. Infants may have permanent hearing impairment at birth or acquire it later. When present at birth, it can be detected by screening using otoacoustic emissions (OAE) or automated auditory brainstem response (aABR). A screening protocol usually includes several screening steps. Infants who do not pass the initial screen, return for one or, if necessary, more repeat steps. The number of steps before referral for diagnostic assessment, and the timing of the steps, are variable.
Undetected hearing loss will become manifest later in life. The outcomes from the model are the number of screening tests, referrals and children detected with hearing loss by age and severity of hearing loss (unilateral or bilateral and mild, moderate, or severe) and costs of screening, diagnosis and treatment, in situations with and without screening. By simulating various screening programmes, the cost-effectiveness of the programmes can be compared, as has been done for Albania (Verkleij et al. Citation2021).
To allow stakeholders to adjust the model to their own country-, region- or local-specific situation and to simulate their own screening programme, we developed a web-based version of the model, in which a number of parameters are adjustable. The web tool is available at https://miscan.EUSCREEN.org/.
Structure of the web tool
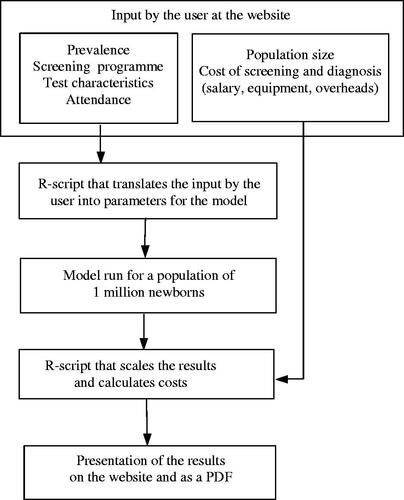
The structure of the web tool is described in . In respect of a newborn hearing screening programme, the user is asked to enter data on the size of the population, the prevalence of the defined target HI (both uni- and bilateral) and characteristics of the screening programme, the number of screening steps, timing of the steps, type of hearing test (OAE or aABR), attendances, sensitivity and specificity or referral rate of each step, attendance at diagnostic assessment, and costs of test devices, salaries and diagnostic assessment. Attendance is defined as the percentage of infants tested out of the number eligible. An R-script translates the input to usable parameters in the model and the model is run with a sample size of one million individuals. A second R-script multiplies the model output with the costs and calculates the output: the number of tests performed, number of referrals to diagnostic assessment, cases detected versus missed, costs of screening, costs of diagnostic assessment, and cost per case detected. The results are presented in tables and graphs on the website and are stored in a downloadable pdf file together with the input data of the specific run.
Figure 1. Structure of the web tool.
Further developing the web tool: pilot testing, shortcomings and modifications
Country representatives from the EUSCREEN consortium and experts from the EUSCREEN project contributed to the development of the web tool through monthly discussions on the choice of the parameters to be adjusted, the clarity of the descriptions and the layout of the tool. Representatives from Albania, Belgium Fl., Israel, Netherlands, Spain, Sweden and the United Kingdom pilot-tested their NHS programmes (national or regional) in the web tool.
It appeared that entering realistic values for sensitivity, specificity and attendance was not always self-evident. This was particularly true for specificity values in the consecutive screening steps.
Relevant knowledge was gleaned from the literature and epidemiology of diagnostic testing, including a systematic review on referral rates of NHS programmes, along with data from the EUSCREEN inventory regarding NHS (Mackey Citation2022).
The test specificity appeared to vary considerably per screening step in a single programme and also between programmes (). Possible reasons for these variations and how they may affect outcomes were explored (see Discussion section).
Table 1. Referral rates and specificities per screening step in well baby NHS of several European and other countries.
To support the user of the tool in this respect modifications were made: offering a choice between specificity or referral rate, and use of the guidance mode (see Final web tool).
The calculations made by the web tool were verified as much as possible. However, a full validation could not be performed as this would require a full dataset also including long term data, which unfortunately is not available. A limited validation using Dutch NHS data showed that the tool produced satisfactory outcome data (see Appendix, ).
Final web tool
The tool is built with three types of hearing screening programmes in mind: NHS for well babies, NHS for infants treated in a neonatal intensive care unit (NICU) or with other risk factors, and childhood hearing screening (CHS). The tool has been developed with two modes: the expert mode which aims to help healthcare officials to use the tool, and the guidance mode, intended to expand the usability of the tool to those less familiar with the detail of screening. In the guidance mode, as opposed to the expert mode, the user is not required to enter values for the sensitivity and specificity of each screening step. Instead, the tool asks for a value of “programme quality” (low, medium, high) to be entered. Programme quality encompasses test circumstances, training, experience, supervision of the screeners, equipment, administration, and degree of organisation. The tool then provides the corresponding values for sensitivity and specificity, depending on the programme quality, alongside the other input: age of the infant, type of test and time elapsed since the preceding test ( in appendix; http://tandfonline.com/doi/suppl). The guidance mode is based on epidemiologic considerations and should be regarded as an auxiliary to using the tool. The proposed sensitivity and specificity values are intended to guide the user and prevent seriously unrealistic outcome.
As regards Well baby NHS, the tool presents the following pages to be filled out: “Geography and demography”, “Guidance”, “Screening programme”, “Costs”, and “Treatment”. A user may bypass the guidance mode by choosing expert mode on the “Screening programme” page. Pages of the NICU/risk NHS and CHS programmes are: “Geography and demography”, “Screening programme”, and “Costs”. No guidance mode is offered for these programmes.
Some relevant issues for which the tool may be of use include: how to deal with low attendance, the effects of more or fewer screening steps, and the possible consequences of screening in the maternity ward compared to screening in the home. The outcomes of tool runs, based on various NHS programmes will be presented in Results. It is important to realise that these runs are merely demonstrations. Under other circumstances or in other countries or regions the outcomes may be different.
Results
Low attendance
When implementing NHS in Albania an OAE-OAE-aABR protocol was chosen, mostly based on expert opinion. The data entered in this run were based on Albanian implementation reports (). The attendance for the first screening step, with mother and baby still in maternity, was high (97%). As the attendances (after discharge from maternity) for the subsequent steps (66% and 60%) and diagnostic assessment (70%) were low, many HI cases remained undetected. As alternatives to the three-step protocol, various two-step protocols were modelled. All two-step protocols raised the detection from 4 to 8 of the 12 HI cases. Compared to the three-step protocol, the costs of screening and diagnostics of the OAE-OAE and OAE-aABR protocols were lower. The aABR-aABR protocol was equally effective, but the most expensive alternative.
Table 2. Modelling an Albanian NHS programme.
Number of screening steps
The second demonstration compares protocols that differed in the number of screening steps (). Data were obtained from the EUSCREEN NHS inventory of three mature NHS programmes Belgium Flanders, Netherlands and Sweden Stockholm (). Adding a screening step to a test protocol increases the programme specificity and decreases the programme sensitivity. The two-step protocol resulted in many more referrals to diagnostics and a higher detection rate, compared to the three-step protocol. This aABR-aABR protocol was the most expensive (71% more than the three-step protocol), due to the high costs of diagnostic assessment and the choice for the more expensive aABR.
Table 3. Three NHS protocols with different numbers of steps analysed by the web tool, and two alternatives for the OAE-OAE-OAE-aABR protocol.
Unexpectedly, the extra step in the four-step protocol did not reduce the number of referrals to diagnostics. Given the high referral rates of the third (73%) and fourth step (60%), some three-step protocols were modelled. The OAE-OAE-aABR protocol with a (not uncommon) 25% referral rate of the third step was cheaper and more sensitive.
Maternity versus screening after discharge
The third demonstration compared screening in the maternity ward with screening after discharge in a health centre or at a home visit (). Completing the screening within the first days after birth in the maternity ward facilitates high attendance but at the expense of a lower specificity caused by the presence of middle ear effusion. The protocol OAE-OAE-aABR with the first two steps within a few days in the maternity ward was compared to two protocols with a timing of the screening steps that allowed for higher specificity. One protocol had lower attendance (health centre) and the other had high attendance (home visits). The maternity protocol was effective, but the referral rate to diagnostics was high, resulting in high costs. Screening after discharge and lower attendance saved costs, which could be spent on home visits to raise attendance.
Table 4. Maternity or screening after discharge with low and high attendances.
Discussion
During the development of the web tool relevant epidemiologic knowledge was gathered regarding input parameters, which factors determine these, and what their effect is on the costs and effectiveness of the screening programme. An overview of this knowledge is presented here, with the aim of providing further assistance to health care officials when using the tool or design a new programme.
Input parameters, their determinants and effect on outcome
Sensitivity and prevalence
In an NHS programme, the test sensitivity and prevalence values are interdependent. The sensitivity of a hearing test is a subject of study in many articles on NHS (Lutman Citation1997; Mason Citation1998; Vohr Citation1998; Kezirian Citation2001; Davis Citation2001; Rissman et al. Citation2018). The HI prevalence rate at birth is crucial in these studies to determine the number of missed cases. As the prevalence of HI at birth is in fact an approximation, the reported sensitivity values vary between wide ranges. A cautious conclusion from these studies is that the test sensitivity in a mature NHS programme is better than 90%.
Prevalence rates of HI (uni- and bilateral, >35 or 40 dB HL) in newborns are reported to vary in well babies between 0.1 and 0.3% and in NICU infants between 1.5 and 2.5% (Van Dommelen Citation2010; Van der Ploeg Citation2012; Van Kerschaver Citation2013; Bussé Citation2020b). The prevalence rates in these studies are determined retrospectively using necessarily imperfect methods and should be interpreted with some caution. Considerable differences likely exist across various regions and socio-economic circumstances (Bussé Citation2020b).
The parameter sensitivity must be estimated, taking into account the programme quality: test circumstances, equipment and experience of the screeners. Programme quality may also be presumed to be related to socio-economic circumstances and maturity of a programme.
Specificity
The specificity of a first screening step can quite accurately be derived from the referral rate in an existing NHS programme, because the prevalence of hearing impairment is low. The referral rate and specificity of the first step add up to 100% in a general population of newborns. Inventoried NHS programmes show fairly similar specificities of the first screening step, mostly between 90 and 95%. Specificity will be lower during the first few days after birth due to the presence of amniotic fluid in the middle ear or vernix in the outer ear canal (Doyle Citation2000; Hergils Citation2007; Berninger and Westling Citation2011). The specificities of subsequent steps are rather variable and usually lower than in the first step (). This counterintuitive finding is not explained by the changing prevalence per screening step, as the specificity of a test is independent of prevalence. Possible explanations may be varying test circumstances or presence of middle ear effusion (MEE) and, in relation to this the choice of test, OAE or aABR. Test circumstances relate for example to ambient noise, equipment (probe fitting), screener experience, and handling of the newborn (Maxon Citation1997). These circumstances may contribute to a “refer” test result at a rather unknown and varying frequency. Test circumstances are likely related to programme quality, which may also vary within a screening programme.
The target condition of NHS usually is sensorineural HI, not temporary conductive HI. OAE and aABR detect a HI regardless of these types. They will show a “refer” result not only in the presence of a sensorineural HI (true positive), but frequently also if middle ear effusion is present (false positive). Middle ear effusion may be present during the first days after birth as amniotic fluid, but also during the months after birth in relation to otitis media. Otitis media may have a prevalence of 3-10%, and thus determine to a great extent the number of (false) positive test results and specificity (Teele Citation1989; Casselbrant and Mandel Citation2003).
These considerations relating to middle ear effusion may have consequences for the design of an NHS test protocol. For example, specificity may be optimised by scheduling the first screening step soon after day 4 or 5 and the second step one or two weeks later, to avoid MEE as much as possible. If testing during the first days after birth is preferred, an aABR test could be more appropriate than an OAE, which is more sensitive to MEE (Lutman Citation1997; Mason Citation1998; Kezirian Citation2001; Mackey Citation2022). Furthermore, planning a subsequent test seven days or more after the previous one allows MEE to disappear, and change the test result from “refer” to “pass”.
Number of screening steps
The programme sensitivity is inversely proportional to the number of screening steps. A test sensitivity of 95% will result in a programme sensitivity of 86% in a three-step NHS programme.
Contrary to programme sensitivity, the programme specificity benefits from more screening steps in the protocol.
Attendance
The attendance of a screening step is better when mother and baby are still in the maternity ward or a programme with home visits. The attendance at a health care visit depends on the motivation of the parents, organisation and administration of the NHS programme, and the socio-economic situation.
Outcome
Relevant outcome measures of an NHS programme are the detection rate (effectiveness), and the total costs of screening and diagnostics. The programme sensitivity drives the effectiveness, while specificity determines the costs of a programme. High attendance rates are associated with better effectiveness (higher detection rate), but also higher costs (more tests).
Another commonly used outcome measure is the referral rate to diagnostic assessment. A low referral rate, which is recommended, may be attained by high specificity, but it should be realised that also low attendance decreases the number of referred infants.
Present and future of the web tool
The web tool is particularly suitable for analysing an existing or a newly designed screening programme, for instance by varying single input data and studying the effect on an outcome.
Further development of the tool may include analysis of the benefit and costs of long-term treatment, in addition to ongoing refinements of the tool based on the users experiences. A full validation of the web tool remains necessary.
The tool also contains options to evaluate NICU and childhood hearing screening, which were not the focus of this article. Further study of the epidemiology and inventory data of NICU and childhood hearing screening, together with further consideration of user experience with these options would be both obvious and desirable extensions to this work.
Conclusions
The web tool enables policymakers and programme coordinators to adjust or design their country-, region- or locally-specific hearing screening programme. Entering realistic values for attendance, sensitivity and specificity and interpreting the outcome of an analysis by the web tool, requires insight into what determines these parameters and what effect they have on the benefits and costs of an NHS programme.
Acknowledgement
We thank Dennis van Aken for the development of the IT infrastructure and the design of the webtool, and Bert van Zanten for sharing his extensive knowledge of newborn hearing screening with us.
Disclosure statement
The authors have no conflicts of interest relevant to this article to disclose.
Additional information
Funding
References
- Berninger, E., and B. Westling. 2011. “Outcome of a Universal Newborn Hearing-Screening Programme Based on Multiple Transient-Evoked Otoacoustic Emissions and Clinical Brainstem Response Audiometry.” Acta Oto-Laryngologica 131 (7): 728–739. doi:10.3109/00016489.2011.554440.
- Bussé, A. M. L., A. R. Mackey, H. L. J. Hoeve, A. Goedegebure, G. Carr, I. M. Uhlén, and H. J. Simonsz, EUS€REEN Foundation. 2021. “Assessment of Hearing Screening Programmes across 47 Countries Or Regions I: Provision of Newborn Hearing Screening.” International Journal of Audiology 60 (11): 821–830. doi:10.1080/14992027.2021.1886350.
- Bussé, A. M. L., B. Qirjazi, A. Goedegebure, M. Toll, H. L. J. Hoeve, E. Toçi, E. Roshi, G. Carr, and H. J. Simonsz. 2020a. “Implementation of a Neonatal Hearing Screening Programme in Three Provinces in Albania.” International Journal of Pediatric Otorhinolaryngology 134: 110039. doi:10.1016/j.ijporl.2020.110039.
- Bussé, A. M. L., H. L. J. Hoeve, K. Nasserinejad, A. R. Mackey, H. J. Simonsz, and A. Goedegebure. 2020b. “Prevalence of Permanent Neonatal Hearing Impairment: Systematic Review and Bayesian Meta-Analysis.” International Journal of Audiology 59 (6): 475–485. doi:10.1080/14992027.2020.1716087.
- Casselbrant, M. L., and E. M. Mandel. 2003. Epidemiology, Ch 10 in Rosenfeld RM and Bluestone CD, Evidence-based Otitis Media, 2nd ed. Hamilton, Ontario: BC Decker Inc.
- Davis, A., J. Bamford, and J. Stevens. 2001. “Performance of Neonatal and Infant Hearing Screens: Sensitivity and Specificity.” British Journal of Audiology 35 (1): 3–15. doi:10.1080/03005364.2001.11742727.
- Doyle, K. J., P. Rodgers, S. Fujikawa, and E. Newman. 2000. “External and Middle Ear Effects on Infant Hearing Screening Test Results.” Otolaryngology-Head and Neck Surgery : official Journal of American Academy of Otolaryngology-Head and Neck Surgery 122 (4): 477–481. doi:10.1067/mhn.2000.102573.
- Grill, E., K. Uus, F. Hessel, L. Davies, R. S. Taylor, J. Wasem, and J. Bamford. 2006. “Neonatal Hearing Screening: Modelling Cost and Effectiveness of Hospital- And Community-Based Screening.” BMC Health Services Research 6 (1): 14. doi:10.1186/1472-6963-6-14.
- Heijnsdijk, E. A., T. M. de Carvalho, A. Auvinen, M. Zappa, V. Nelen, M. Kwiatkowski, A. Villers, A. Páez, S. M. Moss, T. L. Tammela, F. Recker, L. Denis, S. V. Carlsson, E. M. Wever, C. H. Bangma, F. H. Schröder, M. J. Roobol, J. Hugosson, H. J. de Koning. 2014. "Cost-Effectiveness of Prostate Cancer Screening: A Simulation Study Based on ERSPC Data. Journal of the National Cancer Institute 107 (1): 366. doi:10.1093/jnci/dju366.
- Hergils, L. 2007. “Analysis of Measurements from the First Swedish Universal Neonatal Hearing Screening Program.” International Journal of Audiology 46 (11): 680–685. doi:10.1080/14992020701459868.
- Huang, L. H., L. Zhang, R. Y. Tobe, F. H. Qi, L. Sun, Y. Teng, Q. L. Ke, F. Mai, X. F. Zhang, M. Zhang, et al. 2012. “Cost-Effectiveness Analysis of Neonatal Hearing Screening Program in China: Should Universal Screening Be Prioritized?” BMC Health Services Research 12: 97. doi:10.1186/1472-6963-12-97.
- Keren, R., M. Helfand, C. Homer, H. McPhillips, and T. A. Lieu. 2002. “Projected Cost-Effectiveness of Statewide Universal Newborn Hearing Screening.” Pediatrics 110 (5): 855–864. doi:10.1542/peds.110.5.855.
- Kezirian, E. J., K. R. White, B. Yueh, and S. D. Sullivan. 2001. “Cost and Cost-Effectiveness of Universal Screening for Hearing Loss in Newborns.” Otolaryngology-Head and Neck Surgery: Official Journal of American Academy of Otolaryngology-Head and Neck Surgery 124 (4): 359–367. doi:10.1067/mhn.2001.113945.
- Lutman, M. E., A. C. Davis, H. M. Fortnum, and S. Wood. 1997. “Field Sensitivity of Targeted Neonatal Hearing Screening by Transient-Evoked Otoacoustic Emissions.” Ear and Hearing 18 (4): 265–276. doi:10.1097/00003446-199708000-00001.
- Mackey, A. R., A. M. L. Bussé, H. L. J. Hoeve, A. Goedegebure, G. Carr, H. J. Simonsz, and I. M. Uhlén, for the EUS€REEN Foundation. 2021. “Assessment of Hearing Screening Programmes Across 47 Countries Or Regions II: Coverage, Referral, Follow-Up and Detection Rates from Newborn Hearing Screening.” International Journal of Audiology 60 (11): 831–840. doi:10.1080/14992027.2021.1886351.
- Mackey, A. R., A. M. L. Bussé, V. Del Vecchio, E. Mäki-Torkko, and I. M. Uhlén. 2022. “Protocol and Programme Factors Associated With Referral And Loss To Follow-Up from Newborn Hearing Screening: A Systematic Review.” BMC Pediatrics 22 (1): 473. doi:10.1186/s12887-022-03218-0.
- Mason, S., A. Davis, S. Wood, and A. Farnsworth. 1998. “Field Sensitivity of Targeted Neonatal Hearing Screening Using The Nottingham ABR Screener.” Ear and Hearing 19 (2): 91–102. doi:10.1097/00003446-199804000-00001.
- Maxon, A. B., K. R. White, B. Culpepper, and B. R. Vohr. 1997. “Maintaining Acceptably Low Referral Rates in TEOAE-Based Newborn Hearing Screening Programs.” Journal of Communication Disorders 30 (6): 457–475. doi:10.1016/s0021-9924(97)00030-0.
- Rissmann, A., A. Koehn, M. Loderstedt, C. Schwemmle, G. Goetze, S. Bartel, S. K. Plontke, J. Langer, K. Begall, P. Matulat, et al. 2018. “Population-Based Cross-Sectional Study to Assess Newborn Hearing Screening Program in Central Germany.” International Journal of Pediatric Otorhinolaryngology 107: 110–120. doi:10.1016/j.ijporl.2018.01.035.
- Sankatsing, V. D., E. A. Heijnsdijk, P. A. van Luijt, N. T. van Ravesteyn, J. Fracheboud, and H. J. de Koning. 2015. “Cost-Effectiveness of Digital Mammography Screening Before the Age of 50 in The Netherlands.” International Journal of Cancer 15137 (8): 1990–1999. doi:10.1002/ijc.29572.
- Teele, D. W., J. O. Klein, and B. Rosner. 1989. “Epidemiology of Otitis Media During the First Seven Years of Life in Children in Greater Boston: A Prospective, Cohort Study.” The Journal of Infectious Diseases 160 (1): 83–94. doi:10.1093/infdis/160.1.83.
- Van der Ploeg, C. P. B., Uilenburg, N. N., Kauffman-De Boer, M. A. Oudesluys-Murphy, A. M., and Verkerk P. H. 2012. “Newborn Hearing Screening in Youth Health Care in The Netherlands: National Results of Implementation and Follow-up.” International Journal of Audiology 51 (8): 584–590. doi:10.3109/14992027.2012.684402.
- Van Dommelen, P., A. D. Mohangoo, P. H. Verkerk, C. P. Van der Ploeg, and H. L. Van Straaten 2010. “Dutch NICU Neonatal Hearing Screening Working Group. Risk indicators for hearing loss in infants treated in different neonatal intensive care units.” Acta Paediatrica 99 (3): 344–349. doi:10.1111/j.1651-2227.2009.01614.x.
- van Hees, F., A. G. Zauber, H. van Veldhuizen, M. L. Heijnen, C. Penning, H. J. de Koning, M. van Ballegooijen, and I. Lansdorp-Vogelaar. 2015. “The Value of Models in Informing Resource Allocation in Colorectal Cancer Screening: The Case of The Netherlands.” Gut 64 (12): 1985–1997. doi:10.1136/gutjnl-2015-309316.
- Van Kerschaver, E., A. N. Boudewyns, F. Declau, P. H. Van de Heyning, and F. L. Wuyts. 2013. “Socio-Demographic Determinants of Hearing Impairment Studied in 103,835 Term Babies.” European Journal of Public Health 23 (1): 55–60. doi:10.1093/eurpub/cks010.
- Verkleij, M. L., E. A. M. Heijnsdijk, A. M. L. Bussé, G. Carr, A. Goedegebure, A. R. Mackey, B. Qirjazi, I. M. Uhlén, F. Sloot, H. L. J. Hoeve, et al. 2021. “Cost-Effectiveness of Neonatal Hearing Screening Programs: A Micro-Simulation Modeling Analysis.” Ear and Hearing Jul-Aug 0142 (4): 909–916. doi:10.1097/AUD.0000000000000981.
- Vohr, B. R., L. M. Carty, P. E. Moore, and K. Letourneau. 1998. “The Rhode Island Hearing Assessment Program: Experience with Statewide Hearing Screening (1993–1996).” The Journal of Pediatrics 133 (3): 353–357. doi:10.1016/S0022-3476(98)70268-9.
- WHO. 2017. WHO Global costs of unaddressed hearing loss and cost-effectiveness of interventions: a WHO report, 2017. Geneva: World Health Organization; Licence: CC BY-NC-SA 3.0 IGO. https://apps.who.int/iris/bitstream/handle/10665/254659/9789241512046-eng.pdf. Accessed 17-2-2022
- Yoshinaga-Itano, C., V. Manchaiah, and C. Hunnicutt. 2021. “Outcomes of Universal Newborn Screening Programs: Systematic Review.” Journal of Clinical Medicine 10 (13): 2784. doi:10.3390/jcm10132784..
Appendix
Validation
We used data of the Dutch NHS programme of 2019 as input for the tool and compared the number of infants detected with HI, the number of tests performed and the number of infants referred to DA (). The test sequence used in the Dutch programme for well babies is OOA, alternative sequences (AA, OAA) were used in a minority of infants. The programme report does not provide data of the costs of screening and diagnostic assessment, but the number of performed tests and number of infants referred to DA give a fair indication.
Table A1. Validation of the model using Dutch NHS data.
Data are derived from Monitor NGS 2019 (https://www.pns.nl/sites/default/files/2021-01/Monitor%20NGS%202019_definitief.pdf).
Data used as input into the model: N infants screened (all), refers and attendances of each screening step (only OOA), attendance DA (all), sensitivity and prevalence HI (estimated by the user).
The model calculates N tests, N refers to DA, N detected HI. A user may calculate the expected number of HI cases in the screened population (P x N infants), and compare that number with the number detected.
A total of 606 infants were referred to DA in the Dutch NHS programme, 488 through the regular OOA sequence, 7 through OAA, and 3 through AA. The other infants (108) were referred to DA before completing the whole test sequence.
The number of infants referred to DA predicted by the model is 459, considerably less than the number in the Dutch NHS programme.
This is partly because the model only accepts rounded numbers (no decimals) as input for refer percentages (and attendance). Replacing the rounded model percentages by the Dutch programme percentages would result in a model prediction of approximately 45 more infants referred to DA.
Secondly, the model calculates the outcome of the OOA sequence. The AA and OAA sequences used in the programme (with 10 infants referred to DA) were not part of the input. Thirdly, the referral of infants before completing the test sequence is not addressed by the model. The reason for early referral is probably in several cases the presence of external symptoms related to hearing impairment, but the reasons for referral or numbers are not reported. These early referrals will increase the numbers referred to DA in a programme to varying degrees.
These considerations may lead to the conclusion that the model outcome “N refers to DA” is better related and compared to the programme “OO” refers (plus the refers from other test sequences) than to the “all infants” refers to DA of the programme.
Another significant observation concerns the difference in numbers “detected HI” in the model and in the programme. This number is determined, next to attendance, by prevalence and sensitivity which have to be estimated by the user of the model. A small reduction of the sensitivity (or prevalence) will suffice to eliminate the difference.
In conclusion: the main measure of effectiveness of a hearing screening programme, the number of infants detected with HI, as calculated by the model, compares reasonably well with the Dutch data, just like the number of tests and the number of infants referred to DA which, to a limited extent, indicate costs.
Table A2. Guidance mode.