
Abstract
Objective
The study’s objective was to identify consonant and vowel confusions in cochlear implant (CI) users, using a nonsense syllable repetition test.
Design
In this cross-sectional study, participants repeated recorded mono- and bisyllabic nonsense words and real-word monosyllables in an open-set design.
Study sample
Twenty-eight Norwegian-speaking, well-performing adult CI users (13 unilateral and 15 bilateral), using implants from Cochlear, Med-El and Advanced Bionics, and a reference group of 20 listeners with normal hearing participated.
Results
For the CI users, consonants were confused more often than vowels (58% versus 71% correct). Voiced consonants were confused more often than unvoiced (54% versus 64% correct). Voiced stops were often repeated as unvoiced, whereas unvoiced stops were never repeated as voiced. The nasals were repeated correctly in one third of the cases and confused with other nasals in one third of the cases. The real-word monosyllable score was significantly higher than the nonsense syllable score (76% versus 63% correct).
Conclusions
The study revealed a general devoicing bias for the stops and a high confusion rate of nasals with other nasals, which suggests that the low-frequency coding in CIs is insufficient. Furthermore, the nonsense syllable test exposed more perception errors than the real word test.
Introduction
The benefit of cochlear implants (CIs) for the perception of speech is routinely assessed through real-word monosyllable repetition tests and tests presenting sentences in quiet and in noise. Such tests provide a score of correctly repeated words and sentences but not detailed information regarding confusions of consonants and vowels when meaning cannot be inferred. Another widely used assessment is the Ling’s 6-sound-test (Ling Citation1976), which checks the perception and production of three consonants and three vowels but does not represent any real challenge for a majority of today’s CI users.
Precise information regarding the perception and confusion of consonants and vowels in adult CI users is very valuable for therapists when planning discrimination exercises. This information is also useful for professionals working with CI programming and may serve as a baseline for technological advancement of the CIs.
Postlingually cochlear implanted adults have to adapt their primary cognitive sound inventory to the new CI-impulses. It is not given that they will have the same perception challenges as the prelingually implanted children. Hence, they must be seen as a separate group. Apart from a pilot study by Rødvik (Citation2008), there has been no previous study of speech sound confusions in Norwegian adult CI users. The present study is designed to fill this gap in the literature.
Since the early 1980s, vowel and consonant confusions in CI users have commonly been measured by real-word monosyllables with the structure consonant-vowel nucleus-consonant (CNC) as stimuli (e.g. Skinner et al. Citation2002; Gantz et al. Citation2016). In other studies, consonant and vowel perceptions and misperceptions have been measured by nonsense syllables. The latter type of studies have been conducted in different languages, such as English (Kirk, Tye-Murray, and Hurtig Citation1992; Bhattacharya and Zeng Citation2007), Finnish (Välimaa, Sorri, and Lopponen Citation2001, Välimaa et al. Citation2002, Välimaa et al. Citation2011), Flemish (van Wieringen and Wouters Citation1999; Wouters and van den Berghe Citation2001), French (Guevara et al. Citation2016), German (Wesker et al. Citation2005; Rahne et al. Citation2010), Japanese (Ito, Tsuji, and Sakakihara Citation1994) and Norwegian (Rødvik Citation2008; Rødvik et al. Citation2019). A few cross-linguistic investigations have also been performed (e.g. Tyler and Moore Citation1992; Pelizzone, Cosendai, and Tinembart Citation1999).
A systematic review and meta-analysis covering 50 studies with 647 participants speaking different languages (Rødvik et al. Citation2018), found that the mean performance on consonant identification tasks for the postlingually hearing impaired CI users was 58%; study n = 44 and for the prelingually hearing impaired CI users 47%; study n = 6. Another main finding in this review was that the most common consonant confusions occurred between those with the same manner of articulation (e.g. /k/ as /t/, /m/ as /n/ and /p/ as /t/).
Vowel and consonant identification tests have traditionally been performed in closed-set conditions, in which participants respond by choosing between specifically presented pre-determined alternatives. This is the case for most of the abovementioned studies. However, some studies have employed open-set designs. In these, the participant is not limited to choosing between presented alternatives: In a study with 19 Finnish-speaking CI users with a postlingual hearing-impairment, Välimaa et al. (Citation2002) found that manner of articulation was more easily identified than place of articulation, and the consonants with alveolar, palatal, or velar transitions (high second formant; F2), /s, r, k, n, j, l/, were more easily identified than consonants with labial transitions (low F2; /p, m, ʋ/). A tendency to confuse consonants with the closest consonant of a higher F2 transition was also noted. In a study with 39 adult CI users, Välimaa et al. (Citation2011) found that in most cases of erroneous vowel repetitions, the participant would produce a vowel with F1 and/or F2 frequencies higher than the target vowel. The authors suggest that a basalward shift of the CI stimulation in the cochlea may have been the reason for this type of confusions.
A study with 36 mostly prelingually hearing impaired children and adolescents with CIs (Rødvik et al. Citation2019) found that unvoiced consonants were significantly less confused than voiced consonants. Moreover, a devoicing bias was found for the stops; unvoiced stops were sometimes perceived as other unvoiced stops and never as a voiced version of the same stop, and voiced stops were perceived both as an unvoiced version of the same stop and as other voiced stops. An [i:]-[y:] perception bias was also revealed; [y:] was significantly more frequently repeated as [i:] (67%) than as [y:] (31%).
Cochlear implants
CIs consist of a speech processor on the ear and a surgically implanted electrode array in the cochlea, which encompasses up to 22 electrical contacts, depending on the CI model. The electrode array is located in the scala tympani, with some distance to the neural elements. A speech signal is received by the built-in speech processor microphone and transmitted to electrical pulses in the implant according to a stimulation strategy. Every stimulation strategy uses electrical stimulation patterns in the electrode array to set up an electrical signal in the hearing nerve that mimics the signal in a normal ear. These patterns vary somewhat between stimulation strategies, but they all attempt to convey at least spectral information of the original signal to the implant. The signal conveyed to the hearing nerve is limited compared to the signal that is created in a normally hearing ear. Still, in most cases, the human brain is capable of using this limited information to perceive speech.
Among the main implant manufacturers (in terms of market share) Advanced Bionics (Stäfa, Switzerland), Cochlear® (Sydney, Australia) and MED-EL (Innsbruck, Austria), MED-EL offers the only stimulation strategies that have the possibility of delivering both temporal and spectral information to the implant, the temporal fine structure (TFS) strategies (FSP, FS4 and FS4-p; MED-EL, 2007). The strategies stimulate with a pace that is supposed to match the oscillations of the vocal cords and thus follow the characteristics of the fundamental frequency (F0) and the lower harmonics in the speech signal. According to Caldwell, Jiam, and Limb (Citation2017), the TFS strategies may improve the coding of complex stimuli heavily dependent on pitch, such as music, compared with spectral information strategies, such as the continued interleaved sampling (CIS) strategy. Music signals are often regarded as more complex than speech signals due to their dependence on correct rendering of fundamental frequencies and harmonic components.
Speech sounds and phonetic features investigated in the present study
The present study will examine the confusions more closely, grouping the results according to the phonetic features voicing, nasality, stopping, frication and laterality, which all are important features of Norwegian (Kristoffersen Citation2000, 22).
Speech sounds can be classified as either voiced or unvoiced. Voiced consonants have more acoustic energy than their unvoiced counterparts, and each voiced consonant differs acoustically from its unvoiced version by the presence of the fundamental frequency (F0) and the formants. F0 is related to pitch and will vary around 125 Hz for a typical male voice and around 200 Hz for a typical female voice (e.g. Titze Citation1994, 186).
Nasals, usually voiced, are produced with the air flowing through the nose and the oral cavity blocked in different places. These sounds can be characterised in terms of their formant frequencies, but their formants have less energy than those of vowels. The main energy bands of nasals lie between 200 and 2000 Hz. The low frequencies around 250 Hz are prominent in the nasals’ spectrum and are called the nasal murmur, or the nasal formant (F1). Nasals are also characterised by the so-called antiformant, which is a frequency band around 1000 Hz in which the harmonics have low energy. Perceptual experiments with listeners with normal hearing (NH) have shown that nasal murmur and the formant transitions are both important for providing information on place of articulation (e.g. Kurowski and Blumstein Citation1984). In the present study, the three nasal consonants, [m, n, ŋ], were contrasted with nonnasals in the analyses.
The lateral [l] is produced by an airstream proceeding along the sides of the tongue and blocked by the tip of the tongue from the middle of the mouth. Acoustically, [l] and the nasals are quite similar and thus may be difficult to distinguish for an implant user, due to the coding of the low frequency sounds in the implants (e.g. Caldwell, Jiam, and Limb Citation2017). The F1s of [l] and [n] are identical, close to 250 Hz. The F2s, however, differ. [n] has an F2 close to 2500 Hz and [l] has an F2 around 1200 Hz, and less energy in the low frequencies than the nasals. In this study, the lateral [l] was contrasted with the nasals in the analyses.
Stops and fricatives can be voiced or unvoiced, and the effect of voicing was examined in the analyses. Stops are produced by blocking the vocal tract to make all airflow cease, and their acoustic output is the sudden release of the blocking. For the fricatives, the blocking is partial and the airflow in the vocal tract is constricted. Norwegian unvoiced stops, as unvoiced stops in most Germanic languages, are strongly aspirated. As the stops themselves are very short, CI users usually rely considerably on the spectral properties of the surrounding vowels to identify them, such as locus and length of the formant transitions, spectral height and steepness, and voice onset time (Välimaa et al. Citation2002).
Vowels, usually voiced, normally constitute the core of the syllable in most spoken languages (Kristoffersen Citation2000, 114). Due to high intensity, they are known to be more easily perceived than consonants. The vowels in our study also have long duration. In Norwegian, the vowels are distinguishable by the formants F1 and F2, which are part of the temporal envelope of the speech signal. A prevalence of many rounded front vowels is a distinct feature of the Norwegian language.
Aims
The aim of the study was to identify the most common vowel and consonant confusions in a sample of well-performing, predominantly postlingually hearing impaired, adult CI users. The study employed a Norwegian nonsense syllable repetition test (NSRT) in an open-set design (i.e. no visually or auditorily presented alternatives to choose among). A reference group of 20 listeners with NH was included to check if they reached ceiling on the test.
Materials and methods
See for an overview of the acronyms and abbreviations used in this article.
Table 1. Acronyms and abbreviations.
Participants
Informed written consent was obtained from all participants according to the guidelines of the Helsinki declaration (World Medical Association [WMA] Citation2021). The Regional Ethical Committee, Dep. South East, and the data protection officer at Oslo university hospital approved the project. Approval no. 2013/1580 and 2013/12632, respectively.
Cochlear implant users
Twenty-eight adult CI users (17 women/11 men) with Norwegian as their native language participated in the study. Their mean age was 46.9 years (SD = 21.4 years; range: 17.0–82.8 years). All had oral language as their main communication mode. Their demographics are presented in Supplement A, Table 6. The study sample included five participants with a prelingual hearing-impairment (defined as congenital, profound hearing-impairment [pure-tone average for the four frequencies 500, 1000, 2000 and 4000 Hz (PTA4) per ear > 80 dB HL], or onset of severe to profound hearing-impairment before the age of 12 months [Myhrum et al. Citation2017]). The remaining 23 participants had a postlingual hearing-impairment (defined as progressive hearing loss and onset of severe to profound hearing-impairment after the age of 3 [Myhrum et al. Citation2017]). The latter group had benefitted from HAs and acquired oral language before the onset of hearing-impairment.
Fifteen of the participants used two CIs and 13 used one CI and had an unaided profound hearing-loss (PTA4 > 80 dB HL) on their contralateral ear. Unaided pure tone audiometry was performed to check for residual hearing when the results were not present in the participant’s medical record. In case of substantial residual hearing on the non-operated ear, the participant was excluded. If middle-ear problems were suspected, otomicroscopy was performed by an ear, nose and throat (ENT) specialist.
All included CI users had a minimum of six months of implant use, had used their second CI for more than three months after activation (if bilaterally implanted), and had used the CI with the current speech processor settings for more than two months. They were required to obtain a score of more than 50% on the Høgskulen i Sør-Trøndelag (HIST) monosyllable test in free-field (Øygarden Citation2009), since monosyllable scores below 50% normally imply low consonant scores and often response perseveration.
A shortened version of Norsk fonemtest (The Norwegian Phoneme Test; Tingleff Citation2007) was used (28 of 104 pictures) to check whether the participants were capable of spontaneously pronouncing all the target speech sounds of the NSRT correctly. The selected test items presented the target speech sound in the medial position, to match the NSRT. Only those who obtained a 100% correct pronunciation score were included in the study.
The CI users were enrolled in the CI program at Oslo university hospital and recruited for the present study through the clinic. All testing was performed as part of their ordinary follow-up appointments.
Reference group with normal hearing
A reference group of 20 adult listeners with NH (15 women/5 men) was included to confirm that NH persons generally do obtain scores at or near the ceiling on the NSRT. Their mean age was 27.6 years (SD = 6.9 years; range: 21.6–49.5 years). NH was confirmed by pure-tone audiometry showing thresholds equal to or better than 25 dB HL on frequencies from 125 to 8000 Hz on both ears.
The middle-ear status of the reference group was checked by tympanometry and via otomicroscopy by an ENT specialist, before audiometry.
Test description
Nonsense syllable repetition test
The NSRT comprises 16 consonants that are common for all Norwegian dialects, [p, t, k, b, d, ɡ, l, m, n, ŋ, f, v, ʝ, s, ʃ, h], and the nine Norwegian long vowels [ɑː, eː, iː, uː, ʉː, yː, æː, øː, ɔː] (see Supplement B, Table 8, for a complete list of nonsense syllables in the NSRT).
Each consonant was placed in three different vowel-consonant-vowel (VCV) contexts using the three cardinal vowels, /ɑː, iː, uː/ (e.g. /′iːdi/). Norwegian has two lexical tones, tone 1 and tone 2, which are related to a distinctive melody and stress in two-syllabic words (Kristoffersen Citation2000, 233). The present 2-syllable consonant test uses Standard East Norwegian tone 2 throughout the test. This test design also collects information about how formant transitions influence perception in different vowel contexts.
In Norwegian, the phonemes /v/ and /j/ are normally realised as the voiced approximants [ʋ] and [j] in casual speech and as the fricatives [v] and [ʝ] when the speaker wants to emphasise a statement. The latter realisation was presented in the NSRT to make the sounds in the test more salient for the participants.
The nine long vowels were presented in a /b/-vowel-/b/ (bVb) context. This consonant context has been used in several previous studies (e.g. von Wallenberg and Battmer Citation1991; Kirk, Tye-Murray, and Hurtig Citation1992; Rødvik et al. Citation2019). The narrow, anterior vowel [yː] is in Norwegian pronounced with an extremely protruded and wide rounding of the lips. None of the consonant-vowel-consonant (CVC) or VCV combinations in the NSRT represents a real Norwegian word.
Real-word monosyllable test
Real-word speech perception, measured in an open-set manner with the HIST monosyllable test, was included in the study to assess whether there are differences between speech perception with real words versus nonsense words. The participants were asked to repeat single words taken from a 50-word list. Each repetition was scored as either correct or incorrect. The HIST is comprised of nine different 50-word lists containing phonetically balanced, Norwegian monosyllables.
Procedure
All participants were tested by the same person (the first author) in an anechoic chamber, and their word repetitions were recorded with a Zoom H4n hard disc recorder (Hauppauge, New York, USA). The sound was presented in front at 0° azimuth from a 4.5ʺ Seas 11 F-LGWD loudspeaker (Moss, Norway). The distance between the loudspeaker and the participant was 1.5 m, and the equivalent sound level in the listening position was 65 dB(A).
Testing of participants with cochlear implants
The NSRT (Supplement C, Table 8) was conducted by playing the recorded CVC and VCV nonsense syllables to the participants and recording their oral repetitions. All the CI users were tested with both ears simultaneously, irrespective of whether they had one or two CIs, and were exposed to auditory stimuli only. Participants were informed that they would be introduced to words with no meaning, but they were unaware of which or how many speech sounds would be presented to them and in which consonant or vowel context the speech sounds would be presented. They were not allowed to practise before being tested, to make sure that the responses were produced spontaneously, and they were not provided with feedback during the testing.
Participants were instructed to repeat what they heard and to guess if they were unsure so that a 100% response rate was achieved. Each nonsense word, representing one speech sound, was presented once to the participants. The test lasted around 5 minutes for most participants. The test leader waited for a response to each test unit before playing the next one.
The participants used the everyday settings of the speech processors and did not switch off front-end sound processing. The speech processors were quality checked before testing, but new CI programming was not performed prior to the testing.
Testing of participants with normal hearing
The test setup for the participants with NH corresponded to the setup for the participants using CI, except that the HIST monosyllable test was not conducted, since listeners with NH typically perform at the ceiling level on this test.
Phonetic transcription and scoring
The recordings of the participants’ repetitions on the NSRT were transcribed by two independent, trained phoneticians. They were blind to the purpose of the study and to what kind of participant groups they transcribed. The transcriptions included vowel length and primary and secondary stress, but not suprasegmentals.
The two transcriptions were compared; for disagreements, the first author listened to the recordings and chose the transcription that he judged to be most correct. The point-by-point agreement, which is a proportion defined by: percentage agreement/(percentage agreement + percentage disagreement), was 88.2% (SD = 4.0%; range: 71.9%–100%).
The participants’ repetition of each target speech sound was scored as either correct (1) or incorrect (0).
Presentation of data in confusion matrices
The speech sound confusions were organised into confusion matrices (CMs), in which the consonants were grouped primarily as voiced and unvoiced, and secondarily according to the manner of articulation.
Analysis
All statistical analyses were carried out using SPSS v. 27.0 (SPSS Inc., Chicago, Ill., USA). Eight variables were constructed to score the performance on the NSRT (see #19–26 in ). The nonsense syllable repetition score (NSRS) was constructed by calculating a weighted mean of the nonsense syllable repetition score for vowels (NSRS-V) and for consonants (NSRS-C), in which the weights were determined by the number of different vowels (9) and consonants (16) in the test [NSRS = (NSRS-V × 9 + NSRS-C × 16)/25].
Assumptions of normal distribution were violated according to the Shapiro-Wilk test, possibly due to a ceiling effect for some of the variables. Spearman’s correlation test and the nonparametric Wilcoxon signed-rank z test for related samples were therefore used to compare scores from the participants with CIs for the following variables:
The HIST real-word monosyllable score and the NSRS.
The consonant and vowel scores (NSRS-C and NSRS-V).
Voiced and unvoiced consonant scores (NSRS-Cvoi and NSRS-Cunvoi).
Consonant scores in different vowel contexts (NSRS-CaCa, NSRS-CiCi and NSRS-CuCu).
To determine statistical significance, we chose α = 0.05 for all tests. Corresponding comparisons of NSRS-C, NSRS-V, NSRS-Cvoi, NSRS-Cunvoi, NSRS-CaCa, NSRS-CiCi and NSRS-CuCu for the listeners with NH were also performed. A Holm-Bonferroni correction was used to correct for multiple comparisons in all the statistical tests.
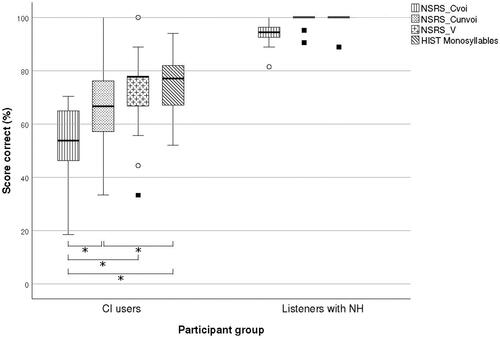
The score distribution for HIST monosyllables, NSRS-Cvoi, NSRS-Cunvoi and NSRS-V for the two participant groups is shown with a box-and-whiskers plot (see ).
Figure 1. Box-and-whiskers plot of nonsense syllable repetition score for voiced consonants (NSRS-Cvoi), nonsense syllable repetition score for unvoiced consonants (NSRS-Cunvoi), nonsense syllable repetition score for vowels (NSRS-V) and HIST (real-word) monosyllable score, for CI users (N = 28), and listeners with NH (N = 20). The length of the whiskers represents the first and fourth quartile of the data, except for the outliers, which are represented by circles if the data lie between 1.5 and 3.0 times the whiskers from the median and squares if the data lie more than 3.0 times the whiskers from the median. HIST monosyllable score was not obtained from the listeners with NH due to expected ceiling effect.
Results
Consonant confusions
Altogether, 184 (13.7%) of the consonant stimuli were repeated as consonant clusters or as other consonants foreign to the NSRT. These were excluded from the analysis and put in the unclassified category.
shows the CM obtained for the 16 consonants in aCa, iCi and uCu contexts for the 28 participants with CIs. shows the percentages of correct repetitions and five types of confusions: consonants with the same manner and same voicing, consonants with the same manner and opposite voicing, consonants with a different manner and opposite voicing, consonants with a different manner and the same voicing, and unclassified confusions. The mean percentage of correct repetitions was close to 60% for all categories, except for the nasals, which had a score close to 40% and the lateral [l], which had a score of 70%. On average, the most common confusions were between consonants with the same manner and the same voicing. The least common confusions were between consonants with the same manner and opposite voicing, except for the plosives.
Figure 2. Percentages of correct consonant repetitions and five types of consonant confusions for the CI users (N = 28).
The upper bar describes the complete material of consonant confusions, and the eight bars below the horizontal line describe subsets of the material. The units on the horizontal axis are the percentage scores of correct and incorrect repetitions.
The bars with a horizontal pattern visualise correct repetitions.
Type 1 is confusion between consonants with the same manner and the same voicing.
Type 2 is confusion between consonants with the same manner and opposite voicing.
Type 3 is confusion between consonants with a different manner and opposite voicing.
Type 4 is confusion between consonants with a different manner and the same voicing.
Type 5 is unclassified confusions (a collective category encompassing consonant clusters and speech sound responses not included in the tests).
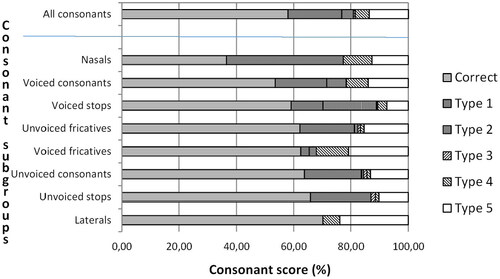
Table 2. Confusion matrix for participants with CIs (N = 28); consonants in the aCa, iCi and uCu contexts added together.
Supplement D, Table 12, presents the consonant CM for the listeners with NH.
Vowel confusions
The CM obtained for the nine long vowels in a bVb context for the 28 participants with CIs is shown in . [yː] was repeated as [iː] in 82.1% of the cases and repeated correctly in only 14.3% of the cases. [iː] was not confused with other vowels. Supplement D, Table 13, presents the vowel CM for the listeners with NH.
Table 3. Confusion matrix of vowel repetitions in the bVb context for participants with CIs (N = 28).
Study characteristics
A summary of the scores on the study variables with means (M), standard deviations (SDs), medians (Mds) and ranges is displayed in and in Supplement C, Table 9. A list of individual test results is shown in Supplement A, Table 7. Comparisons of the participants with CIs and the listeners with NH are displayed in Supplement C, Table 10. The results show, as expected, that the listeners with NH had significantly higher scores than the participants with CIs on all variables.
Table 4. M, Md and SD of the study variables for the participants with CIs (N = 28).
and Supplement C, Table 11, show comparisons of the medians of NSRS, NSRS-C, NSRS-Cvoi, NSRS-Cunvoi, NSRS-CaCa, NSRS-CiCi, NSRS-CuCu and NSRS-V, for the CI users and the listeners with NH with Wilcoxon’s signed-rank test and Spearman’s correlations between the HIST score and NSRS-Cvoi, NSRS-Cunvoi and NSRS-V. For the CI users, statistically significant differences were found for all the comparisons, except NSRS-CiCi versus NSRS-CuCu, HIST versus NSRS-V and HIST versus NSRS-Cunvoi.
Table 5. Comparisons of the medians for the participants with CIs (N = 28).
shows a box-and-whisker plot of NSRS-Cvoi, NSRS-Cunvoi, NSRS-V and HIST (real-word) monosyllable score, for the CI users (N = 28). For the listeners with NH (N = 20), the same variables except the HIST monosyllable score are shown in the figure. The plot shows that the median of NSRS-Cvoi is the lowest for both the CI users and the listeners with NH. For the CI users, the median of NSRS-Cunvoi is the second lowest and the medians of NSRS-V and HIST monosyllable score are about equally large. Moreover, the variability is the largest for NSRS-Cunvoi. There is a prominent ceiling-effect for the listeners with NH on all variables.
Discussion
Speech sound confusions
The CI users most often confused consonants with other consonants of the same voicing and same manner of articulation (e.g. the unvoiced stops, [p, t, k]). This is in accordance with previous research, which has shown that CI users most frequently confuse consonants that are pronounced in the same manner and with the same voicing, but with different place of articulation (the tongue blade touching different places in the mouth cavity; e.g. Dorman, Loizou, and Rainey Citation1997).
Although the tendencies of the results of the present study of adults were similar to those with children in Rødvik et al. (Citation2019), the scores were consequently lower on all parameters; especially with regard to voiced consonants, vowels and real-word monosyllables. Since the inclusion criteria in both studies are similar, the reason is probably that the participants in the present study are mainly postlingually hearing impaired and the participants in the study with children and adolescents are mainly prelingually hearing impaired.
Furthermore, the results of the present study compare very well with the mean vowel and consonant repetition scores in the systematic review by Rødvik et al. (Citation2018), in which the mean consonant and vowel repetition scores (56% and 72%, respectively) were practically identical to those of the present study (58% versus 71% correct).
Another finding was a devoicing confusion bias; confusion of the voiced stops, [b, d, ɡ] with the unvoiced stops, [p, t, k]. This may be due to the poor rendering of the low frequencies in speech by the implants.
The most prevalent vowel confusion was [yː] perceived as [iː]. The main reason for this confusion is probably that F1 and F2 of the two vowels are close in frequency. Previous studies have shown that CI users discriminate formant-frequencies in vowels more poorly than listeners with NH due to a more compressed vowel space and a basalward shift of the lower frequencies (Löfqvist, Sahlen, and Ibertsson Citation2010; Neumeyer, Harrington, and Draxler Citation2010). Another possible reason is that [iː] in Norwegian is about 10 times more prevalent than [yː] (Øygarden Citation2009, 108), and when in doubt, the participants would likely choose the most common of the two speech sounds.
A discussion of the results for the listeners with NH can be found in Supplement E.
Impact of vowel and consonant context on recognition
The vowel context of the consonant test was significant for consonant recognition. The aCa context gave the highest score and the iCi and uCu contexts gave the lowest. The use of different vowel contexts on the consonant repetition test seems to be a strength with this test setup, as the importance of formant transitions becomes evident and the influence of formant transitions on the consonant scores could be averaged.
These results are partly in accordance with Donaldson and Kreft (Citation2006), who found that the average consonant recognition scores of adult CI users were slightly but significantly higher (6.5%) for consonants presented in an aCa or uCu context than for consonants presented in an iCi context. The vocal tract is more open for [ɑː] than for [iː] and [uː], making the formant transition more pronounced and the consonants thereby more easily perceptible. The Norwegian [uː] is much more retracted than the English [uː], and Donaldson and Kreft’s findings may therefore not directly compare with our results.
The consonant context of the vowel test is of little importance, since vowel perception is based on steady-state formants. The bVb context was chosen to present the vowels as part of a nonsense syllable instead of alone, thus matching the consonant test.
Limitations and strengths
In this study, CI users who obtained scores below 50% on the HIST monosyllable test were excluded. If this exclusion criterion had not been applied, the size of the “unclassified” category in the CMs would have been considerably larger, which would have added more noise to the results and consequently less systematic information regarding the confusions.
In a closed-set test, there will be no unclassified speech sounds, which can be regarded as both a limitation and a strength, as it excludes lucky guessing and exposes the factual perception difficulty. Our choice of an open-set test design provided more information regarding speech sound confusions than a closed-set test would have. The information that is given by the size and contents of the unclassified category is useful, and not present in a closed-set test.
We regard the choice of nonsense syllables for measuring consonant and vowel perception as a strength in the study, as the stimuli in the NSRT are without lexical meaning and listeners can thus rely neither on their vocabulary nor on the linguistic context. Ceiling effects are more likely to be avoided with nonsense syllable stimuli than with real words, and the NSRT reveals the factual minute sound perception problems. This is supported by a study on individuals with NH by Findlen and Roup (Citation2011), who investigated dichotic speech recognition performance for nonsense- and real-word CVC syllables, and found that performance with nonsense CVC syllables was significantly poorer than performance with real-word CVC syllables. Another advantage of using NSRTs is that they, unlike real-word tests, can be used to compare the outcomes of participants speaking different languages (e.g. Tyler and Moore Citation1992; Pelizzone, Cosendai, and Tinembart Citation1999), as long as they are modified to only include speech sounds existing in each respective language.
Fatigue and diverted attention of the participants may have influenced the scores of the NSRT, and the participants’ response accuracy may have decreased towards the end of the test session. However, since the test lists were randomised, this probably did not influence the overall repetition of specific speech sounds, only the total scores.
Clinical implications
The study showed that the NSRT captured more speech sound confusions in CI users than the HIST real-word monosyllable test. Hence, clinics would benefit from adopting nonsense syllable tests covering the relevant speech sounds in the CI user’s language. The NSRT scores provide a detailed picture of speech-sound confusions in individual CI users, which can be used to plan targeted listening exercises.
The NSRT can also be used to adjust the programming of the CIs. The goal of the programming is to provide access to all speech sounds and to ensure that the sounds are easily perceived at normal stimulation levels and are never uncomfortably loud. The intervention can for instance be to adjust the level of electrical stimulation in individual electrodes or to broaden or narrow the frequency bands of the electrodes. By measuring the speech sound perception prior to and after the CI programming, a basis for the desired CI settings can be achieved.
The results of this study can be used as a baseline of what NSRS to expect from the CI users. In a clinical setting, the test should be conducted flexibly, to adapt it to CI users of different performance levels. A tablet app with an abbreviated NSRT for clinical use is currently being used in our clinic in a pilot project with newly cochlear implanted patients, as pre- and posttest before and after auditory training and CI programming. Schumann et al. (Citation2015) have found such training to improve perception not only at phoneme level, but also in moderate noise. This pilot project also aims to explore effective syllable listening excercises and produce an auditory training protocol.
Summary
The participants achieved the highest scores for vowel repetitions, the second highest for unvoiced consonant repetitions, and the lowest for voiced consonant repetitions. A devoicing bias was found for the stops and a confusion bias for [yː] and [iː]. The consonant and vowel repetition scores were substantially lower in the adult participants group than in the children’s, as documented in Rødvik et al. (Citation2019). The NSRT exposed more perception errors than the real-word monosyllable test.
For the participant group, which mainly consisted of postlingually hearing impaired CI users, the low-frequency transmission of the implants appears to function more poorly than the high-frequency transmission.
Supplemental Material
Download MS Word (17.4 KB)Supplemental Material
Download MS Word (14.2 KB)Supplemental Material
Download MS Word (14.3 KB)Supplemental Material
Download MS Word (13.9 KB)Supplemental Material
Download MS Word (13.2 KB)Supplemental Material
Download MS Word (12.8 KB)Supplemental Material
Download MS Word (15.6 KB)Supplemental Material
Download MS Word (13.2 KB)Supplemental Material
Download MS Word (14.2 KB)Acknowledgements
The authors are grateful to the Department of Special Needs Education, University of Oslo, Norway, which provided funds to pay the salary for two phoneticians who transcribed the voice recordings.
Disclosure statement
No potential conflict of interest was reported by the author(s).
Correction Statement
This article has been corrected with minor changes. These changes do not impact the academic content of the article.
References
- Bhattacharya, A., and F. G. Zeng. 2007. “Companding to Improve Cochlear-Implant Speech Recognition in Speech-Shaped Noise.” The Journal of the Acoustical Society of America 122 (2):1079–1089. doi:10.1121/1.2749710
- Caldwell, M. T., N. T. Jiam, and C. J. Limb. 2017. “Assessment and Improvement of Sound Quality in Cochlear Implant Users.” Laryngoscope Investigative Otolaryngology 2 (3):119–124. doi:10.1002/lio2.71.
- Donaldson, G. S., and H. A. Kreft. 2006. “Effects of Vowel Context on The Recognition of Initial and Medial Consonants By Cochlear Implant Users.” Ear and Hearing 27 (6):658–677. doi:10.1097/01.aud.0000240543.31567.54.
- Dorman, M. F., P. C. Loizou, and D. Rainey. 1997. “Speech Intelligibility as A Function of The Number of Channels of Stimulation For Signal Processors Using Sine-Wave and Noise-Band Outputs.” The Journal of the Acoustical Society of America 102 (4):2403–2411. doi:10.1121/1.419603.
- Findlen, U. M., and C. M. Roup. 2011. “Dichotic Speech Recognition Using Cvc Word and Nonsense Cvc Syllable Stimuli (Report).” Journal of the American Academy of Audiology 22:13–22.
- Gantz, B. J., C. Dunn, J. Oleson, M. Hansen, A. Parkinson, and C. Turner. 2016. “Multicenter Clinical Trial of The Nucleus Hybrid S8 Cochlear Implant: Final Outcomes.” The Laryngoscope 126 (4):962–973. doi:10.1002/lary.25572.
- Guevara, N., M. Hoen, E. Truy, and S. Gallego. 2016. “A Cochlear Implant Performance Prognostic Test Based on Electrical Field Interactions Evaluated By Eabr (Electrical Auditory Brainstem Responses).” Plos One 11 (5):e0155008–17. doi:10.1371/journal.pone.0155008.
- Ito, J., J. Tsuji, and J. Sakakihara. 1994. “Reliability of The Promontory Stimulation Test For The Preoperative Evaluation of Cochlear Implants: A Comparison With The Round Window Stimulation Test.” Auris, Nasus, Larynx 21 (1):13–16. doi:10.1016/s0385-8146(12)80004-6.
- Kirk, K. I., N. Tye-Murray, and R. R. Hurtig. 1992. “The Use of Static and Dynamic Vowel Cues By Multichannel Cochlear Implant Users.” The Journal of the Acoustical Society of America 91 (6):3487–3498. doi:10.1121/1.402838.
- Kristoffersen, G. 2000. The phonology of Norwegian (Oxford University Press, Oxford).
- Kurowski, K., and S. E. Blumstein. 1984. “Perceptual Integration of The Murmur and Formant Transitions For Place of Articulation in Nasal Consonants.” The Journal of the Acoustical Society of America 76 (2):383–390. doi:10.1121/1.391139.
- Ling, D. 1976. Speech and the Hearing-Impaired Child: Theory and Practice. Washington DC: The Alexander Graham Bell Association for the Deaf.
- Löfqvist, A., B. Sahlen, and T. Ibertsson. 2010. “Vowel Spaces in Swedish Adolescents With Cochlear Implants.” The Journal of the Acoustical Society of America 128 (5):3064–3069. doi:10.1121/1.3466850.
- Myhrum, M., H. Strøm-Roum, M. G. Heldahl, A. K. Rødvik, B. Eksveen, B. Landsvik, K. Rasmussen, and O. E. Tvete. 2017. “Sequential Bilateral Cochlear Implantation in Children: Outcome of The Second Implant and Long-Term Use.” Ear and Hearing 38 (3):301–313. doi:10.1097/AUD.0000000000000383.
- Neumeyer, V., J. Harrington, and C. Draxler. 2010. “An Acoustic Analysis of The Vowel Space in Young and Old Cochlear-Implant Speakers.” Clinical Linguistics & Phonetics 24 (9):734–741. doi:10.3109/02699206.2010.491173.
- Øygarden, J. 2009. Norwegian Speech Audiometry [dissertation]. Norwegian University of Science and Technology, Trondheim.
- Pelizzone, M., G. Cosendai, and J. Tinembart. 1999. “Within-Patient Longitudinal Speech Reception Measures With Continuous Interleaved Sampling Processors For Ineraid Implanted Subjects.” Ear and Hearing 20 (3):228–237. doi:10.1097/00003446-199906000-00005.
- Rahne, T., M. Ziese, D. Rostalski, and R. Muhler. 2010. “Logatome Discrimination in Cochlear Implant Users: Subjective Tests Compared To The Mismatch Negativity.” The Scientific World JOURNAL 10:329–339. doi:10.1100/tsw.2010.28.
- Rødvik, A. K. 2008. “Perception and Confusion of Speech Sounds By Adults With A Cochlear Implant.” Clinical Linguistics & Phonetics 22 (4–5):371–378. doi:10.1080/02699200801919299.
- Rødvik, A. K., J. v K. Torkildsen, O. B. Wie, M. A. Storaker, and J. T. Silvola. 2018. “Consonant and Vowel Identification in Cochlear Implant Users Measured By Nonsense Words: A Systematic Review and Meta-Analysis.” Journal of Speech, Language, and Hearing Research 61 (4):1023–1050. doi:10.1044/2018_JSLHR-H-16-0463
- Rødvik, A. K., O. Tvete, J. v K. Torkildsen, O. B. Wie, I. Skaug, and J. T. Silvola. 2019. “Consonant and Vowel Confusions in Well-Performing Children and Adolescents With Cochlear Implants, Measured By A Nonsense Syllable Repetition Test.” Frontiers in Psychology 10:1–17. doi:10.3389/fpsyg.2019.01813.
- Schumann, A., M. Serman, O. Gefeller, and U. Hoppe. 2015. “Computer-Based Auditory Phoneme Discrimination Training Improves Speech Recognition in Noise in Experienced Adult Cochlear Implant Listeners.” International Journal of Audiology 54 (3):190–198. doi:10.3109/14992027.2014.969409.
- Skinner, M. W., L. K. Holden, L. A. Whitford, K. L. Plant, C. Psarros, and T. A. Holden. 2002. “Speech Recognition With The Nucleus 24 Speak, Ace, and Cis Speech Coding Strategies in Newly Implanted Adults.” Ear and Hearing 23 (3):207–223. doi:10.1097/00003446-200206000-00005
- Tingleff, H. 2007. Norsk Fonemtest [Norwegian Phoneme Test]. Oslo: Damm.
- Titze, I. R. 1994. Principles of voice production. Englewood Cliffs, NJ: Prentice-Hall.
- Tyler, R. S., and B. C. J. Moore. 1992. “Consonant Recognition By Some of The Better Cochlear-Implant Patients.” The Journal of the Acoustical Society of America 92 (6):3068–3077. doi:10.1121/1.404203
- Välimaa, T. T., T. K. Määttä, H. J. Löppönen, and M. J. Sorri. 2002. “Phoneme Recognition and Confusions With Multichannel Cochlear Implants: Consonants.” Journal of Speech, Language, and Hearing Research 45 (5):1055–1069. doi:10.1044/1092-4388(2002/085).
- Välimaa, T. T., M. J. Sorri, J. Laitakari, V. Sivonen, and A. Muhli. 2011. “Vowel Confusion Patterns in Adults During Initial 4 Years of Implant Use.” Clinical Linguistics & Phonetics 25 (2):121–144. doi:10.3109/02699206.2010.514692.
- Välimaa, T. T., M. J. Sorri, and H. J. Lopponen. 2001. “The Effect of A Multichannel Cochlear Implant on Phoneme Perception.” Scandinavian Audiology 30 (1):51–53. doi:10.1080/010503901300007056.
- van Wieringen, A., and J. Wouters. 1999. “Natural Vowel and Consonant Recognition By Laura Cochlear Implantees.” Ear and Hearing 20 (2):89–103. doi:10.1097/00003446-199904000-00001.
- von Wallenberg, E. L., and R. D. Battmer. 1991. “Comparative Speech Recognition Results in Eight Subjects Using Two Different Coding Strategies With The Nucleus 22 Channel Cochlear Implant.” British Journal of Audiology 25 (6):371–380. doi:10.3109/03005369109076612.
- Wesker, T., B. Meyer, K. Wagener, J. Anemüller, A. Mertins, and B. Kollmeier. 2005. “Oldenburg Logatome Speech Corpus (Ollo) For Speech Recognition Experiments With Humans and Machines.” in 9th European Conference on Speech Communication and Technology, pp. 1273–1276.
- World Medical Association [WMA]. 2021, December 19. “WMA Declaration of Helsinki—Ethical Principles for Medical Research Involving Human Subjects.” Accessed from https://www.wma.net/policies-post/wma-declaration-of-helsinki-ethical-principles-for-medical-research-involving-human-subjects/.
- Wouters, J., and J. van den Berghe. 2001. “Speech Recognition in Noise For Cochlear Implantees With A Two-Microphone Monaural Adaptive Noise Reduction System.” Ear and Hearing 22 (5):420–430. doi:10.1097/00003446-200110000-00006