
 ?Mathematical formulae have been encoded as MathML and are displayed in this HTML version using MathJax in order to improve their display. Uncheck the box to turn MathJax off. This feature requires Javascript. Click on a formula to zoom.
Abstract
Objective
Modelling the head-shadow effect compensation and speech recognition outcomes, we aimed to study the benefits of a bone conduction device (BCD) during the headband trial for single-sided deafened (SSD) subjects.
Design
This study is based on a database of individual patient measurements, fitting parameters, and acoustic BCD properties retrospectively measured on a skull simulator or from existing literature. The sensation levels of the Bone-Conduction and Air-Conduction sound paths were compared, modelling three spatial conditions with speech in quiet. We calculated the phoneme score using the Speech Intelligibility Index for the three conditions in quiet and seven in noise.
Study sample
Eighty-five SSD adults fitted with BCD during headband trial.
Results
According to our model, most subjects did not achieve a full head-shadow effect compensation with the signal at the BCD side and in front. The modelled speech recognition in the quiet conditions did not improve with the BCD on the headband. In noise, we found a slight improvement in some specific conditions and minimal worsening in others.
Conclusions
Based on an audibility model, this study challenges the fundamentals of a BCD headband trial in SSD subjects. Patients should be counselled regarding the potential outcome and alternative approaches.
Introduction
Patients with single-sided deafness (SSD) experience deteriorated speech intelligibility in noise and sound localisation abilities and an increased listening effort compared to a normal listening situation (Kitterick, Smith, and Lucas Citation2016). These problems might affect social interaction, communication, and quality of life (Lucas, Katiri, and Kitterick Citation2018). To alleviate SSD consequences, Contralateral Routing of Signals (CROS) solutions, applied by wireless hearing aids or by a Bone Conduction Device (BCD), are commonly offered. Unfortunately, these options cannot restore binaural hearing but only compensate for the head-shadow effect (Kitterick, Smith, and Lucas Citation2016). A trial period with a BCD positioned on the mastoid using a headband is recommended before placing the percutaneous implant (Snik et al. Citation2005; Pennings, Gulliver, and Morris Citation2011). This trial period aims to test whether the head-shadow effect compensation is beneficial to the patient. Theoretically, the BCD attached to a headband (transcutaneous) must provide near equivalent results compared to a BCD fitted on an implant (percutaneous) to achieve a meaningful results of the trial. Furthermore, the BCD must offer equivalent audibility of the signal from the poor and the better-ear-side (Dillon Citation2012, 515) to compensate fully for the head-shadow effect.
Based on current literature, there is a lack of evidence about the BCD effectiveness on the headband as a treatment to restore hearing function in SSD subjects. Wendrich et al. (Citation2017) performed a systematic review of the acceptance and rejection of BCDs after a headband trial period, finding that between 32% and 70% of SSD patients did not choose implantation. One of the most common reasons patients stopped the treatment was a lack of benefit, specifically in noisy situations (Wendrich et al. Citation2017). In a cohort of 46 SSD patients, Kompis et al. (Citation2011) did not find any relevant patient-related factors (age, sex, aetiology, duration of deafness, transcranial attenuation, or hearing thresholds) related to the decision for or against the BCD implantation after the headband trial.
Very few studies highlight the speech perception performance of a band-worn BCD in an SSD population during the trial, all including a small sample of patients. For example, in a series of nine SSD patients, Hol et al. (Citation2010) found a comparable speech perception in noise with and without the testband-worn BCD in the listening condition with the noise in front and the signal at the poor-ear side. In other studies, diminished speech recognition in quiet and noise was found with the testband-worn compared to the percutaneous BCD (e.g. Kurz et al. Citation2014; Monini et al. Citation2015; Snapp, Morgenstein, and Kuzbyt Citation2019).
A testband-worn BCD has some drawbacks compared with a percutaneous system. The major limitation is that the skin attenuates the vibrations, causing a linear loss of the power output that the BCD can deliver to the better-ear. This acoustic damping is approximately 5-10 dB at 1 kHz and increases to about 20 dB with frequencies up to 4 kHz with significant differences between individuals (Kurz et al. Citation2014; Verstraeten et al. Citation2009; Gründer et al. Citation2008). Another major factor limiting the output of a testband-worn BCD is transcranial attenuation (TA). In the case of SSD, the headband is typically applied on the mastoid behind the deaf ear, while the vibrations must travel along the skull to stimulate the better ear on the other side, resulting in energy loss. This effect was measured by Stenfelt (Citation2012) in a group of 28 subjects with SSD. If the stimulation was applied at the mastoid, the TA was small at frequencies up to 1.8 kHz, increased at higher frequencies (10 dB between 3 and 5 kHz) and decreased at the highest measured frequencies (4 dB at 8 kHz). Additionally, a considerable variation between individuals was found (range 44 dB at 0.5 kHz, 18 dB at 1 kHz, 33 dB at 2 kHz, and 38 dB at 4 kHz).
Besides TA, another central aspect regarding SSD is the head-shadow effect, which consists of the acoustic filter effects caused by the head and torso as a function of the incidence angle and frequency of the incoming sound. These acoustic effects can be quantified measuring the Head-Related Transfer Function (HRTF). Stenfelt (Citation2005) studied the HRTF providing a dummy head and torso with a BAHA® (Cochlear®, Sydney, Australia) positioned at the implant location.
In a subject with SSD using a BCD, the signal will reach the better-ear cochlea along two different sound paths (Supplemental Online Material 1). The first path is the air conduction path across the ear canal and the middle ear, after filtering by the head, according to the HRTFAC. The second path is the bone-conduction path (BC-path). Along this path, the signal is filtered by microphone effects (location effects and polar plot, HRTF-BCD), by the BCD output characteristic (functional gain of the BCD, FGBCD), and by the transcranial attenuation (TA). In the case of a testband-worn fitting, the BC signal is also attenuated by the headband and skin (Askin). Both sound paths combine in the better-ear cochlea in a complex way, frequency-dependent. The contribution of the two sound paths can be summarised with a modification of the equation written by Stenfelt (Citation2005):
(1)
(1)
In EquationEquation (1)(1)
(1) all variables are frequency dependent, but HRTF also depends upon the incidence angle between the signal source and the considered ear (αBE for the better-ear and αPE for the poor-ear).
According to Stenfelt (Citation2005), a subject with SSD can benefit from the BCD if the acoustic energy of the targeted speech signal reaching the better-ear through the BC-path is higher than the acoustic energy through the AC-path. In other words, the difference between the sensation levels elicited by the two sound paths (bone-conduction versus air-conduction) must be greater than 0. This condition is essential for the BCD user to achieve a favourable signal-to-noise ratio in the case of a speaker on the deaf side and, simultaneously, competitive signals on the better-ear-side. So far, whether a BCD applied on a headband could effectively compensate for the head-shadow effect is unknown. Thereby, it is unclear whether a trial of a BCD on the headband is of additional value in deciding for or against BCD implantation. Therefore, in this study, using data from a headband trial in SSD patients, we aimed to model the difference between the sensation levels elicited by the two sound paths, the speech intelligibility index (SII; ANSI S3.5-1997) and the phoneme score (CVC-score) of the testband-worn BCD for different listening conditions.
Materials and methods
To demonstrate if a BCD applied on a headband could compensate for the head-shadow effect, as our primary goal of the study, we calculated sensation levels, SII values and CVC-score simulating different spatial conditions in quiet and noise based on data of a headband trial in SSD patients. To make our model, we used the better-ear AC thresholds, the BC-direct thresholds, and the BCD output measured on the skull simulator based on the registered BCD settings.
Participants
Audiometric and BCD fitting data used in this study were attained from SSD subjects included in a single-centre Randomised Controlled Trial (RCT), in which different treatments were compared in adult patients with SSD (Peters et al. Citation2015). This RCT is registered by the Dutch Trial Register under the code NTR4580 and is ethically approved by the Institutional Review Board of the University Medical Centre Utrecht (NL45288.041.13). All participants provided written Informed Consent before trial participation.
As part of this trial, eighty-five patients aged 18 or older were fitted with a testband-worn BCD between 2014 and 2019. All participants suffered from SSD between three months and ten years before inclusion. The air conduction Pure Tone Average (PTA), measured at four-octave frequencies between 0.5 and 4.0 kHz at the impaired ear, was ≥70 dB. On the contralateral “normal hearing” ear, the PTA was ≤ 30 dB. The average air-bone gap at the normal ear was ≤ 10 dB (at four-octave frequencies between 0.5 and 4.0 kHz). The hearing thresholds were measured in an audiometric test room, with permissible ambient noise fulfilling ISO 8253-1 (2010) requirement. Air- and bone-conduction thresholds were measured, following the modified Hughson-Westlake procedure (Carhart and Jerger Citation1959), using a headphone TDH39 (Telephonics, Farmingdale, USA) and a bone conductor B71 (RadioEar, Eden Prairie, USA). Participants could use the testband-worn BCD for six weeks.
Devices and fitting
The BCDs were provided by the manufacturer Cochlear™ (Cochlear Benelux NV, Mechelen, Belgium). According to the manufacturer’s prescriptions for SSD, a “power” BAHA® was used. From the start of the study until December 2016, 49 patients received a device model Baha® 3 Power (BP110). From January 2017 to the end of the inclusion in the study, 36 patients received a device type Baha® 5 Power Sound Processor (BAHA5P). The testband-worn BCDs were fitted accordingly to the manufacturer’s standard method, measuring the hearing thresholds in situ (at 0.5, 1, 1.5, 2, 3, 4 kHz) according to the “direct BC” procedure (Carlsson, Håkansson, and Ringdahl Citation1995; Flynn and Hillbratt Citation2012). The fitting target was the gain prescribed by the manufacturer. The manufacturer fitting formula makes an estimate of the skin damping and TA, trying to compensate for this loss. For the BAHA5P, we determined the maximum stable gain with a feedback test. The settings of the instruments were stored in a database for all consecutive patients.
The pure tones produced by the BCD during the “direct BC” procedure were measured on the skull simulator in the test box of the Verifit®2 (Audioscan®, Dorchester, Canada) to determine the reference values (RETFL) expressed in dB force level (reference 1 µN).
We loaded retrospectively the saved settings on the BCD for every patient and measured the instrument force-level output on the skull simulator in the test box. The International Speech Test Signal (ISTS, Holube et al. Citation2010) was chosen as the input signal. We measured the BCD output twice, with the ISTS signal set at 55 and 65 dB SPL. The average level delivered by the BCD, measured in dB force levels (reference 1 µN) per one-twelfth octave band, was stored in a database. For the measurement in the box, the microphone was set omnidirectional.
After the measurements with first-fit settings, the manufacturer settings were manually adjusted, setting the gain at the maximum stable level at 1 kHz and higher frequencies. This maximum stable level was measured during the BCD fitting for the single BAHA5P-group subject. After the gain optimisation, we measured the output force levels with the ISTS at 65 dB SPL. In the BP110-group, the gain was already at the maximum stable level at 1 kHz and higher frequencies.
Data post-processing
Calculations and statistical analysis were performed using Python 3.7 and related libraries (Numpy, Pandas, and Scipy).
Note that all variables presented in the equations in this method section are frequency dependent. A dependence from an angle is explicit presented in the formula with the notation “(α).”
Modelling the difference in sensation levels
The BC-direct thresholds (TBC direct) were transformed in dB force levels (TBC FL) using the reference values (RETFL) for every single patient, according to the following formula:
(2)
(2)
After this, the BC-direct thresholds (senza virgolette) (at 0.5, 1, 1.5, 2, 3, and 4 kHz), expressed in dB force level, were logarithmically interpolated to obtain values for each one-third octave band.
The output force levels per one-third octave band (L1/3octave) were corrected according to the BAHA® HRTF (Stenfelt Citation2005) for an azimuth of 0-, 90-, (BCD-side), and 270-degree angle (better-ear-side) respectively, to account for the BCD microphone location effects on the head. This correction was applied under the hypothesis that the gain provided by the BCD was approximately independent of the input level, using the following equation:
(3)
(3)
To verify our hypothesis that the gain was independent of the input level, we calculated the compression ratio, which was defined as the fraction of the difference between the ISTS-signal input levels (10 dB) and the difference in the one-third octave band output levels measured with the skull simulator at 65 and 55 dB SPL:
(4)
(4)
The sensation level (SL) elicited by the BC path was calculated at each one-third octave band as the difference between the output value measured with the skull simulator and the direct BC threshold, both in dB force level:
(5)
(5)
Regarding the air conduction path, we proceeded similarly. The spectrum of the ISTS signal per one-third octave band (LISTS), at 55 and 65 dB, was filtered according to the HRTF (Stenfelt Citation2005) for an azimuth of 0 and 90 and 270-degree angle, using the following equation:
(6)
(6)
The air-conduction thresholds were converted into free-field thresholds using data about the Real Ear to Dial Difference (REDD) provided by Bentler and Pavlovic (Citation1989). Bentler’s original data were modified using the Reference Thresholds Sound Pressure Level (RETSPL) of the used TDH39 headphone, according to ISO 389-1 (1998). The octave free-field thresholds were finally logarithmically interpolated to obtain thresholds (in dB SPL) for each one-third octave band (TAC). The SL elicited by the AC path was calculated, per one-third octave band, as the difference between the corrected output of the ISTS signal (LAC) and the free field threshold (TAC):
(7)
(7)
The calculation of the SL for the AC and BC paths was performed under three different conditions: 1) with the signal coming from the front of the subject, 2) with the signal coming from a 90-degree angle at the BCD-side and, 3) with the signal coming from a 270-degree angle at the better-ear-side.
In the end, the difference between the SL elicited by the two different sound paths was determined using EquationEquation (8)(8)
(8) :
(8)
(8)
Qualitative analysis of the BCD fitting audibility
Note that a positive SL difference does not mean that the signal through the BCD path is also audible. A positive value could be caused by an increased AC threshold relative to the BC direct threshold, also if the BC signal is not audible. With this in mind, we performed a “qualitative” analysis of the fittings, counting the cases that met two criteria:
The difference between the SL elicited by the BC and AC sound path is -3 dB or greater in all one-third octave bands between 2 kHz and 4 kHz (CROS-balance-criterium),
The bone-conduction path SL is greater than 0 dB in all one-third octave bands between 2 kHz and 4 kHz (BC-audibility criterium).
We focused on the high-frequency bands because the fitting software applies a high-pass filter with a cut-off frequency around 1.5 kHz when a BAHA is fitted in a SSD subject (Pfiffner et al. Citation2011).
Modelling the SII and phoneme-score
An analysis of the overall audibility was performed using the Speech Intelligibility Index (SII, ANSI S3.5‐1997) to study the BCD's global performance. The SII was calculated according to the one-third octave frequency band method, using the importance of NU6 monosyllables presented in table B.2 of the ANSI standard. We used a level distortion factor L of one because of the moderate signal level (65 dB) applied in our simulation. To calculate the bone-conduction path audibility, we used the output force levels per one-third octave band corrected according to the azimuth (LBCD(α)) and the BC-direct thresholds in dB force levels (TBC FL).
Besides the three conditions in quiet, the SII was calculated for seven conditions in noise, using the ISTS signal at a level of 65 dB for both signal and noise:
Signal and noise directly in front of the subject,
Signal in front of the subject and noise from the BCD side,
Signal from the subject’s front and noise from the better-ear side,
Signal from the BCD side and noise from the better-ear-side,
Signal from the BCD side and the noise in front of the subject,
Signal from the better-ear-side and the noise from the BCD side,
Signal from the better-ear-side and the noise from the front of the subject
The SNR of 0 dB was chosen to simulate a challenging listening situation, sometimes occurring in real life.
Following the SII method, the highest speech and noise level values were selected for each 1/3 octave band to perform the calculation.
Finally, the obtained SII was used to calculate the phoneme score for Dutch monosyllables (Bosman and Smoorenburg Citation1992, Citation1995) using EquationEquation (9)(9)
(9) :
(9)
(9)
Statistical analysis
Results were analysed, calculating median and percentile (P10 and P90) values. Distribution normality was checked using the Shapiro-Wilk test. The Levine test was used to assess the equality of variances. Comparison of continuous variables between the BP110 and BAHA5P group was performed using the independent T-test (in the case of a normal distribution in both groups) or the Mann-Whitney U test (both 2-sided). Proportions of categorical variables between the two device groups were studied using Fisher’s exact test (2-sided). Between-group comparison was assessed using the paired T-test (in the case of normal distributions) or the Wilcoxon signed-rank test (2-sided). In particular, we used these tests to compare the CVC score with and without BCD.
A result was defined as statistically significant when the p-value of the applied test was lower than 0.05.
Results
Numerical results are summarised in Supplemental online Material 2 (Supplemental Table 1). Complete data, calculation results, analysis results, and graphics can be retrieved from the repository Zenodo at https://doi.org/10.5281/zenodo.5573872 (Cattani, Rhebergen, and Smit Citation2022).
Participants
Eighty-five subjects were fitted with the testband-worn BCD, 49 with a BP110 and 36 with a BAHA5P. The BC-direct thresholds were not complete for each frequency in 14 BP110 participants and in one BAHA5P participant. Due to this data loss, calculating the BC sensation level, SII values, and CVC score was only possible for 35 subjects in the BP110 group and 35 subjects in the BAHA5P group.
Output force-levels for first-fit settings
We found substantial differences in force-level output between the two devices (Supplemental online Material 3, violin plot) for first-fit settings. The BAHA5P (N = 36) provided, compared with the BP110 (N = 49), significantly higher output levels in the frequency range between 1.6 and 8 kHz. For example, at 2 kHz the median value of the output level for the BAHA5P group is 86 dBFL and for the BP110 group 82 dBFL (t = 4.93, p < 0.0001).
Output force-levels after adjustment of the gain (BAHA5P-group only)
We found a significant difference between the output after optimising the gain and the output provided by the first-fit settings for frequency bands lower than 4 kHz. The median value of the output difference ranged between 0.6 dB at 3.15 kHz (Wilcoxon signed rank statistic = 38.0, p < 0.001) and 2.9 dB at 2 kHz (Wilcoxon signed rank statistic = 9.0, p < 0.001).
Compression ratio
All compression ratio values in both BCD groups were near 1. For the BP110 group the median ranged between 0.93 at 3.15 kHz and 1.1 at 0.25 kHz. For the BAHA5P group the median ranged between 0.92 at 4 kHz and 1.12 at 0.25 kHz.
Audibility modelling
Model in quiet with the speaker in front of the subject
The difference between the sensation levels elicited by the two sound paths (bone-conduction versus air-conduction) is presented in .
Figure 1. Difference between the sensation levels elicited by the two different sound paths (bone-conduction versus air-conduction), modelled for the BAHA5P group (N = 35, red lines with circles) and for the BP110 group (N = 35, bluelines with squares) in the situation in quiet with the speaker in front of the subject. Input signal with ISTS spectrum set at 65 dB. If the difference of SL ≥ 0 (black dotted line), a full head-shadow-effect compensation is reached. P50 solid line, P90 dashed line, P10 dotted line. No case fulfils our qualitative analysis criteria.
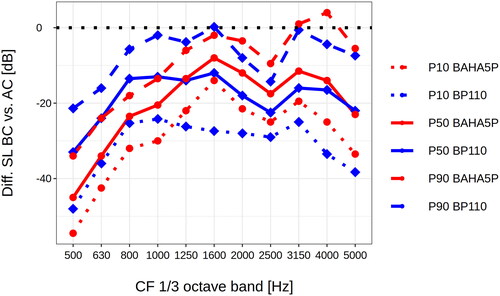
In the frequency range between 2 and 4 kHz, the BAHA5P-group (N = 35) showed a more favourable performance than the BP110 group (N = 35). However, most cases with a BAHA5P could not achieve the 0 value. The sensation levels elicited by the bone-conduction path were generally lower than those produced by the air-conduction path. In the frequency range between 1.6 and 4 kHz, the P10 showed values between −26 and −12 dB.
In the model in quiet with the speaker in front of the subject, we did not find any case fulfilling the CROS criterium and the BC-audibility criterium, as set in our “qualitative” analysis.
Model in quiet with the speaker at the BCD side of the subject
The difference between the sensation levels elicited by the two sound paths (bone-conduction versus air-conduction) is presented in .
Figure 2. Difference between the sensation levels elicited by the two different sound paths (bone-conduction versus air-conduction), modelled for the BAHA5P group (N = 35, red lines with circles) and for the BP110 group (N = 35, bluelines with squares) in the situation in quiet with the speaker at the BCD side of the subject, with the ISTS set at 65 dB. If the difference of SL ≥ 0 (black dotted line), a full head-shadow-effect compensation is reached. P50 solid line, P90 dashed line, P10 dotted line. Three cases from the BAHA5 group fulfil our qualitative analysis criteria.
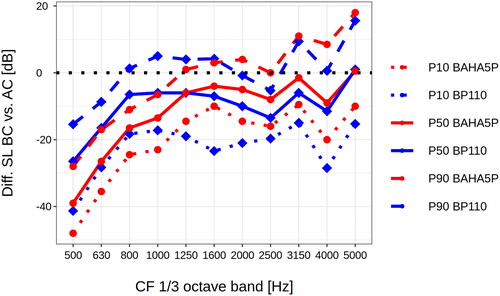
The BAHA5P group (N = 35) showed higher differences between sensation levels than the BP110 group (N = 35) in the frequency range between 1.6 and 4 kHz. However, most cases did not reach the 0 dB value. In the frequency range between 1.6 and 4 kHz, the P10 showed values between −20 and −9 dB.
In the BP110 group, we did not find any case fulfilling the CROS criterium and the BC-audibility criterium, as set in our “qualitative” analysis. In the BAHA5P group, we found 3 of 35 subjects (9%), with first-fit settings fulfilling those criteria.
We could not find any clear criterion based on the AC or BC-direct thresholds to identify the best fittings. The three subjects with the most proficient results showed a flat BC-direct profile with thresholds around 30 dB (BC direct).
SII predictions of CVC score
We analysed the difference between the CVC score of the combined transmission path versus the AC path. The AC path is equivalent to the unaided situation and the combination path to the aided situation ().
Figure 3. Heatmap representation of the median of the difference between the CVC score of the combined transmission path versus the AC path in the different conditions in quiet and noise. The AC path is equivalent to the unaided situation, and the combination path is equivalent to the aided situation.
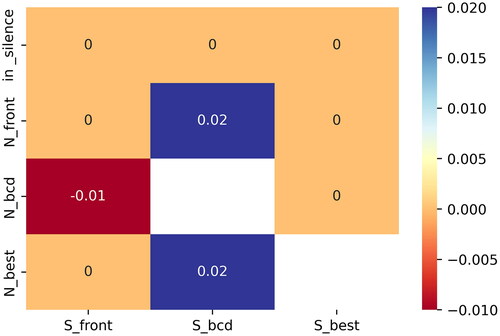
In the “noisy” situations (SNR = 0 dB), the use of the BCD slightly improved the SII and, consequently, the CVC score when the signal was coming from the BCD side. For the BAHA5P group, the P10, median, and P90 of the CVC score improvement were 0%, 2%, and 9% in the condition with the signal at the BCD side and the noise at the better-ear side (Supplemental Online Material 4). For the BP110 group, the P10, median, and P90 were 0%, 1%, and 8%. We also found a slight improvement in the situation with the signal at the BCD side and the noise in front of the subject. For the BAHA5P group, the P10, median, and P90 of the difference between the CVC score of the combined transmission path versus the AC path were 0%, 2%, and 5%, and for BP110 0%, 1%, and 5% (Supplemental Online Material 5).
With the signal at the better-ear side and the noise at the BCD side we found a slight worsening of the CVC score compared to the condition without BCD, equivalent in the two groups (spazio dopo P10, Supplemental online material 6).
In the other situations in noise and the three situations in quiet, we found minimal or no benefits using the BCD (see for example Supplemental online material 7).
Discussion
Reflections on the results
We aimed in this study to model the difference between the sensation levels elicited by the BC and AC sound paths, the audibility (SII values), and the CVC score for different listening conditions, using data attained from SSD subjects fitted with a testband-worn BCD during a headband trial.
We found that the BAHA5P performance was better compared to the BP110 because of the significantly higher output levels measured in the high-frequency bands (Supplemental online Material 3, violin plot). However, we conclude that neither the BP110 nor the BAHA5P testband-worn trial condition can fully compensate for the head-shadow effect ( and ) according to our model.
Based on our qualitative analysis of BCD fitting audibility, the BAHA5P, with first-fit settings, could provide only 9% of SSD subjects of our study population with adequate head-shadow-effect compensation in the most favourable situation (i.e. with the signal at the BCD side). In the condition with the signal in front of the subject, the number of satisfactory fittings dropped to 0%. In other words, the probability of providing adequate head-shadow-effect compensation lowers gradually as the signal azimuth moves from the BCD side to the front. Slightly better results could be achieved after the optimisation of the settings. As demonstrated, a manual gain adjustment of the first-fit settings could eventually be valuable for individual subjects.
However, to provide at least 90% of our SSD participants with a consistent compensation for the head-shadow effect, the BCD must deliver much higher output levels (around 15 to 20 dB relative to the first-fit, see ) without the occurrence of feedback. Nowadays, this is impossible to achieve with commercially available “power” devices similar to the BAHA5P.
In this study, the speech recognition outcomes modelled for the three simulated listening situations in quiet with the BCD were not improved, even with the signal at the BCD side.
We found a slight CVC-score improvement in some specific modelled situations in noise. The best improvement was found in the situations with the noise at the better-ear-side and the signal at the BCD side, and, in the second place, with the signal at BCD side and the noise in front. The BCD did not provide substantial benefits in the other simulated conditions.
As expected, the improvement of audibility (SII values) and CVC score lowered gradually as the signal location moved from the BCD side to the front. With the noise at the BCD side, we found a minimal degradation of speech recognition.
The result of our speech-recognition outcomes model is in line with the current literature. Kitterick, Smith, and Lucas (Citation2016, table 3) found in their review that a BCD could be beneficial for speech perception in noise when the SNR is more favourable at the device side but impairs speech perception when the SNR is more favourable at the better-ear side. They did not find benefits in quiet or when the SNR is similar on both sides. Peters et al. (Citation2021, Figures 1–3) found similar results for speech recognition in noise outcomes with a CROS device and a percutaneous BCD. Note that the CROS and percutaneous-BCD data presented by Peters et al. are about subgroups of subjects who took part in this current research.
The minor differences in outcomes between the aided and the unaided conditions that we found could be explained by the insufficient output levels provided by the testband-worn BCD due to technical constraints (e.g. the device’s maximal output power and the occurrence of feedback) and damping effects (transcranial and skin attenuation). Probably a “superpower” device (e.g. Cochlear™ Baha® 5 SuperPower) could provide more subjects with full head-shadow-effect compensation. It is also possible to place the processor on the deaf ear and the transducer on the better-ear side with a long cable, bypassing the TA. On the other hand, feedback mechanisms could limit the BCD output, especially when a “superpower” device is applied along with poorer BC-direct thresholds (Bosman et al. Citation2018).
Also, using a steel testband instead of a plastic headband could improve audibility, increasing the pressure of the BCD on the subject mastoid. Verstraeten et al. (Citation2009) found slightly favourable aided thresholds and speech-reception thresholds with the steel testband vs. the headband in 10 subjects cohort. However, the difference was not significant. In practice, the steel testband and the “superpower” device are not easy to wear by the patient.
Based on our study, it seems impossible to achieve sufficient audibility to fully compensate for the head-shadow effect with a BCD on the headband in a trial phase for SSD patients. We could not find any relation between AC or BC-direct thresholds and an “audible” BCD fitting, as demonstrated in our “qualitative analysis.” The three subjects with the “best” fitting had a relatively flat BC-direct audiogram between 1 and 4 kHz, with thresholds around 30 dB (BC direct). This characteristic could be part of future studies to analyse more detailed BCD-fitting audibility.
Strengths and weaknesses of this study
The data used in this study was based on SSD patients included in an RCT. An extensive analysis of audibility outcomes with a testband-worn BCD in trial situations could be performed based on modelling. The subjects were enrolled based on a well-defined protocol, which is a strength of this experiment. On the other hand, the controlled setting limits the generalisation of results to all SSD subjects because of the strict inclusion and exclusion criteria. Moreover, the study suffers from data loss due to practical and logistic limitations. This data loss was slight and so it is unlikely that this (could) influence(d) the results and conclusions.
Another limitation is that the RCT protocol did not provide a speech-reception assessment during the trial period with the testband-worn BCD. Therefore, we could not validate our approach, comparing the results of an actual test with our modelled CVC score.
Our research is based on audibility. Nowadays, it is easy to clinically assess the audibility achieved with a conventional hearing aid or even with a CROS system using a Real-Ear-Measurement system. The introduction of the Audioscan® skull simulator, combined with the BC-direct procedure, made it possible to test the audibility in the test box.
Using the SII makes it possible to transform audibility into a functional result, calculating the CVC score. The SII is based on monaural hearing, so it is very suitable in the case of SSD. In the SII model, the signal with the highest acoustic energy in the considered frequency band “wins.” We based the SII calculation for the combination path on the maximum between the level of the signal and noise via AC path versus BC path. This method simplifies the complex frequency-dependent combination of vibrations in the cochlea, neglecting the phase information and eventual constructive or destructive interactions. At this moment, we do not know if it is necessary to consider the phase shift between AC and BC paths introduced by both acoustical and transcranial delay. Tringali et al. (Citation2015) analysed the cochlear microphonics (CM) in 5 one-side-deafened chinchillas using tonal stimuli. They did not find any subtraction effects due to phase shift, but they observed effects compatible with a linear summation of bone and air stimuli. This linearity is surprising because CM are believed to be generated primarily by outer hair cells. Additional studies will be needed to verify this outcome and base future research on it. Currently, we could not find in the literature a better model accounting for the combination of two signals in the cochlea with a different transmission modality.
The ANSI standard describes the SII calculation for air-born signals. We translated this approach to the BC path, assuming that the two transmission modalities produce the same perception mechanism in the cochlea. Specifically, the SII calculation for the combination path is based on the hypothesis that AC and BC-direct thresholds must correspond to equivalent vibration amplitude in de cochlea. Further studies are needed to test these assumptions.
We had to make some interpolations when applying the 1/3 octave filter band method to calculate the SII. Furthermore, we used the HRTF measured by Stenfelt (Citation2005) using a dummy head instead of individual data. The interpolations and the use of a simulated HRTF could cause an underestimation or overestimation of the actual individual audibility. Probably, these approximations have a low impact at a group level.
This project is based on a simulation of specific static listening conditions using particular stimuli and noise spectra. Obviously, this represents a simplification of the complex and dynamic listening conditions that a person with SSD has daily to deal with. Furthermore, our approach focused mainly on audibility and CVC score, leaving out other critical functional results such as the listening effort or the ease of communicating. On the other hand, our simulation bypassed some subject characteristics, e.g. cognition, concentration, memory, and speech and language abilities, which are well-known confounders in this kind of study. Moreover, we got rid of the test fatigue due to the long sessions needed to test different listening conditions. We could obtain a small spread in our results by focusing on audibility and using an objective method such as the SII.
Clinical recommendations
In our opinion, the restricted situations where the testband-worn BCD can provide benefits must be clearly addressed during the patient counselling before starting the headband trial.
Nowadays, it is possible to assess the audibility of the BCD with a commercially available skull simulator. In our experience, the skull simulator gives precious insights into the audibility and bandwidth offered by the BCD. We would encourage audiologists to use a skull simulator systematically while fitting a BCD, besides the psychoacoustic approach. However, we cannot directly compare the audibility of the BC path with that of the AC path. At this moment, this will require a custom-tailored calculation program.
Future research
Currently, we lack validation of our model approach. The validation requires speech recognition in noise data assessed with multiple loudspeakers in an SSD population fitted with a testband-worn BCD. To demonstrate the validity of our model, a correlation between the modelled speech recognition score and the measured speech recognition score has to be founded. It is known that speech recognition tests can be prone to ceiling or floor effects and to the large spread of language proficiency and other top-down cognitive processes in subjects. These limitations could potentially make it hard to find a clear correlation. In this respect, the choice of the test conditions, speech material and score method are critical. An alternative is the measurement of aided free-field thresholds in silence. This method has some drawbacks too, specifically the influence of the BCD advanced features (e.g. compression, feedback and noise limiting). Furthermore, a reliable test with tonal signals demands an anechoic chamber, low noise floor levels and the fixation of the subject head.
A validated model would be of future interest for studies and could make additional tests in patients redundant if modelled outcomes are reliable reflections of functional results, facilitating the often difficult process of selecting the optimal treatment for SSD subjects.
Conclusion
Compared to the BP110, the BAHA5P attached to the headband provides SSD subjects with significantly higher output levels in the high-frequency bands. Modelling the sensation levels, we demonstrated that most SSD participants could not achieve full compensation for the head-shadow effect. Our model showed that speech recognition in quiet did not improve with the testband-worn BCD compared to the unaided condition. Regarding speech recognition in noise, the model showed limited benefits in some specific conditions and minimal worsening in others, resulting from the insufficient output levels provided by the testband-worn BCD.
This study challenges the evidence-based fundamentals of a BCD headband trial in subjects with SSD, at least with the current technology. An other option to compensate the head-shadow effect, as a CROS system, can be considered. Recent research (e.g. Peters et al., Citation2021) demonstrated that early cochlear implantation after unilateral worsening of the cochlear function can partially restore sound localisation and speech recognition in noise.
Author contributions (CRediT)
Guido Cattani: Conceptualisation, Methodology, Investigation, Software, Formal analysis, Data Curation, Visualisation, Writing - Original Draft.
Koenraad S. Rhebergen: Conceptualisation, Methodology, Writing - Review & Editing, Supervision.
Adriana L. Smit: Conceptualisation, Writing - Review & Editing, Supervision.
Clinical trial registration
This RCT is registered by the Dutch Trial Register under the code NTR4580 (https://www.trialregister.nl/trial/4457).
Competing interests disclosure and funding
Cochlear Benelux NV (Mechelen, Belgium) provided the Bone Conduction Devices used during the current study.
Ethical approval
All subjects included in this study participated in a single-centre Randomised Controlled Trial (RCT) in which different treatments were compared in patients with SSD (Peters et al. Citation2015). This RCT is registered by the Dutch Trial Register under the code NTR4580 and is ethically approved by the Institutional Review Board of the University Medical Centre Utrecht (NL45288.041.13).
Informed consent from participants
All RCT participants provided written Informed Consent prior to trial participation.
| Abbreviation and Acronym Disambiguation | ||
| AC | = | Air Conduction |
| ANSI | = | American National Standards Institute |
| BAHA® | = | Bone Anchored Hearing Aid (registered by Cochlear™) |
| BC | = | Bone Conduction |
| BCD | = | Bone Conduction Device |
| CR | = | Compression Ratio |
| CROS | = | Contralateral Routing of Signals |
| FL | = | Force Levels, reference 1 µN |
| HRTF | = | Head-Related Transfer Function |
| ISO | = | International Standard Institute |
| ISTS | = | International Speech Test Signal |
| RCT | = | Randomised Controlled Trial |
| PTA | = | Pure-Tone Average |
| SII | = | Speech Intelligibility Index |
| SL | = | Sensation Level |
| SPL | = | Sound Pressure Level, reference 20 µPa |
| SSD | = | Single-Sided Deafness |
| TA | = | Transcranial Attenuation |
Supplemental Material
Download TIFF Image (12.6 MB)Supplemental Material
Download TIFF Image (12.6 MB)Supplemental Material
Download TIFF Image (12.6 MB)Supplemental Material
Download TIFF Image (12.6 MB)Supplemental Material
Download TIFF Image (13.9 MB)Supplemental Material
Download GIF Image (75.4 KB)
Supplemental Material
Download MS Word (14.9 KB)Supplemental Material
Download MS Word (13.2 KB)Acknowledgements
We thank Cochlear Benelux NV for providing the Bone Conduction Devices used during the current study and all participants who made it possible to carry out this research. Thanks to the ENT-department members involved in the CINGLE trial, particularly Jeroen Peters, Anne Wendrich, and Jan van Heteren. We also would like to thank all audiology department members for the collaboration, especially Danique van de Water and Gerrie van Rooijen-Peek for the logistic assistance. We are grateful to Bert van Zanten for encouraging this research.
Data availability statement for basic data sharing policy
The data that support the findings of this study are openly available in the repository Zenodo at https://doi.org/10.5281/zenodo.5573872, DOI reference 10.5281/zenodo.5573872, (version 2.0.0, 5 November 2022). The related software can be retrieved from https://doi.org/10.5281/zenodo.7295482, DOI reference 10.5281/zenodo.7295482
Disclosure statement
No potential conflict of interest was reported by the authors.
References
- American National Standards Institute. 1997. Methods For Calculation of The Speech Intelligibility Index. ANSI/ASA Standard No. 3.5. New York: Acoustical Society of America.
- Bentler, R. A., and C. V. Pavlovic. 1989. “Transfer Functions and Correction Factors Used in Hearing Aid Evaluation and Research.” Ear and Hearing 10 (1):58–63. https://doi.org/10.1097/00003446-198902000-00010
- Bosman, A. J., and G. F. Smoorenburg. 1992. Woordenlijst voor spraakaudiometrie. Gouda, the Netherlands: Electro Medical Instruments bv & Veenhuis Medical Audio bv, CD.
- Bosman, A. J., and G. F. Smoorenburg. 1995. “Intelligibility of Dutch CVC Syllables and Sentences for Listeners with Normal Hearing and with Three Types of Hearing Impairment.” Audiology: official Organ of the International Society of Audiology 34 (5):260–284. http://www.ncbi.nlm.nih.gov/pubmed/8837785. https://doi.org/10.3109/00206099509071918
- Bosman, A. J., I. J. Kruyt, E. A. M. Mylanus, M. K. S. Hol, and A. F. M. Snik. 2018. “On the Evaluation of a Superpower Sound Processor for Bone-Anchored Hearing.” Clinical Otolaryngology: official Journal of ENT-UK ; Official Journal of Netherlands Society for Oto-Rhino-Laryngology & Cervico-Facial Surgery 43 (2):450–455. https://doi.org/10.1111/coa.12989
- Carhart, R., and J. F. Jerger. 1959. “Preferred Method For Clinical Determination Of Pure-Tone Thresholds.” Journal of Speech and Hearing Disorders 24 (4):330–345. https://doi.org/10.1044/jshd.2404.330
- Carlsson, P., B. Håkansson, and A. Ringdahl. 1995. “Force Threshold for Hearing by Direct Bone Conduction.” The Journal of the Acoustical Society of America 97 (2):1124–1129. https://doi.org/10.1121/1.412225
- Cattani, Guido, Koenraad S. Rhebergen, and Adriana L. Smit. 2022. An Audibility Model of the Bone Conduction Device during Headband Trial in Single-Sided Deaf Subjects. Dataset version 2.0.0. Zenodo, November 5. https://doi.org/10.5281/zenodo.5573872
- Dillon, H. 2012. Hearing Aids. Stuttgart: Thieme.
- Flynn, M. C., and M. Hillbratt. 2012. “Improving the Accuracy of Baha® Fittings through Measures of Direct Bone Conduction.” Clinical and Experimental Otorhinolaryngology 5 (Suppl 1):S43–S47. https://doi.org/10.3342/ceo.2012.5.S1.S43
- Gründer, I., R. O. Seidl, A. Ernst, and I. Todt. 2008. “Wertigkeit der BAHA-Testung für das postoperative Hörergebnis.” Hno 56 (10):1020–1024. https://doi.org/10.1007/s00106-007-1608-7
- Hol, M. K., S. J. Kunst, A. F. Snik, and C. W. Cremers. 2010. “Pilot Study on the Effectiveness of the Conventional CROS, the Transcranial CROS and the BAHA Transcranial CROS in Adults with Unilateral Inner Ear Deafness.” European Archives of Oto-Rhino-Laryngology: official Journal of the European Federation of Oto-Rhino-Laryngological Societies (EUFOS): Affiliated with the German Society for Oto-Rhino-Laryngology - Head and Neck Surgery 267 (6):889–896. https://doi.org/10.1007/s00405-009-1147-9
- Holube, I., S. Fredelake, M. Vlaming, and B. Kollmeier. 2010. “Development and Analysis of an International Speech Test Signal (ISTS).” International Journal of Audiology 49 (12):891–903. https://doi.org/10.3109/14992027.2010.506889
- International Organization for Standardization 1998. Acoustics—Reference Zero for the Calibration of Audiometric Equipment—Part 1: Reference Equivalent Threshold Sound Pressure Levels for Pure Tones and Supra-Aural Earphones. ISO Standard No. 389-1 Geneva: International Organization for Standardization,
- Kitterick, P. T., S. N. Smith, and L. Lucas. 2016. “Hearing Instruments for Unilateral Severe-to-Profound Sensorineural Hearing Loss in Adults.” Ear and Hearing 37 (5):495–507. https://doi.org/10.1097/AUD.0000000000000313
- Kompis, M., F. Pfiffner, M. Krebs, and M.-D. Caversaccio. 2011. “Factors Influencing the Decision for Baha in Unilateral Deafness: The Bern Benefit in Single-Sided Deafness Questionnaire.” Advances in Oto-Rhino-Laryngology 71:103–111. https://doi.org/10.1159/000323591
- Kurz, A., M. Flynn, M. Caversaccio, and M. Kompis. 2014. “Speech Understanding with a New Implant Technology: A Comparative Study with a New Nonskin Penetrating Baha System.” BioMed Research International 2014:416205–416209. https://doi.org/10.1155/2014/416205
- Lucas, L., R. Katiri, and P. T. Kitterick. 2018. “The Psychological and Social Consequences of Single-Sided Deafness in Adulthood.” International Journal of Audiology 57 (1):21–30. https://doi.org/10.1080/14992027.2017.1398420
- Monini, S., I. Musy, C. Filippi, F. Atturo, and M. Barbara. 2015. “Bone Conductive Implants in Single-Sided Deafness.” Acta Oto-Laryngologica 135 (4):381–388. https://doi.org/10.3109/00016489.2014.990057
- Pennings, R. J. E., M. Gulliver, and D. P. Morris. 2011. “The Importance of an Extended Preoperative Trial of BAHA in Unilateral Sensorineural Hearing Loss: A Prospective Cohort Study.” Clinical Otolaryngology: official Journal of ENT-UK ; Official Journal of Netherlands Society for Oto-Rhino-Laryngology & Cervico-Facial Surgery 36 (5):442–449. https://doi.org/10.1111/j.1749-4486.2011.02388.x
- Peters, J. P. M., J. A. A. van Heteren, A. W. Wendrich, G. A. van Zanten, W. Grolman, R. J. Stokroos, and A. L. Smit. 2021. “Short-Term Outcomes of Cochlear Implantation for Single-Sided Deafness Compared to Bone Conduction Devices and Contralateral Routing of Sound Hearing Aids—Results of a Randomised Controlled Trial (CINGLE-Trial).” PloS One 16 (10):e0257447. https://doi.org/10.1371/journal.pone.0257447
- Peters, J. P., A. van Zon, A. L. Smit, G. A. van Zanten, G. A. de Wit, I. Stegeman, and W. Grolman. 2015. “CINGLE-Trial: Cochlear Implantation for SiNGLE-Sided Deafness, a Randomised Controlled Trial and Economic Evaluation.” BMC Ear, Nose and Throat Disorders 15 (1):3. https://doi.org/10.1186/s12901-015-0016-y
- Pfiffner, F., M. Kompis, M. Flynn, K. Asnes, A. Arnold, and C. Stieger. 2011. “Benefits of Low-Frequency Attenuation of Baha® in Single-Sided Sensorineural Deafness.” Ear and Hearing 32 (1):40–45. https://doi.org/10.1097/AUD.0b013e3181ecd002
- Snapp, H. A., K. E. Morgenstein, and B. Kuzbyt. 2019. “Speech Perception Outcomes in Transcutaneous Versus Percutaneous Bone Conduction Stimulation in Individuals With Single-Sided Deafness.” Otology & Neurotology: official Publication of the American Otological Society, American Neurotology Society [and] European Academy of Otology and Neurotology 40 (8):1068–1075. https://doi.org/10.1097/MAO.0000000000002362
- Snik, A. F. M., E. A. M. Mylanus, D. W. Proops, J. F. Wolfaardt, W. E. Hodgetts, T. Somers, J. K. Niparko, J. J. Wazen, O. Sterkers, C. W. R. J. Cremers, et al. 2005. “Consensus Statements on the BAHA System: Where Do We Stand at Present?” The Annals of Otology, Rhinology & Laryngology. Supplement 195 (12_suppl):2–12. https://doi.org/10.1177/0003489405114S1201
- Stenfelt, S. 2005. “Bilateral Fitting of BAHAs and BAHA® Fitted in Unilateral Deaf Persons: Acoustical Aspects.” International Journal of Audiology 44 (3):178–189. https://doi.org/10.1080/14992020500031561
- Stenfelt, S. 2012. “Transcranial Attenuation of Bone-Conducted Sound When Stimulation Is at the Mastoid and at the Bone Conduction Hearing Aid Position.” Otology & Neurotology: official Publication of the American Otological Society, American Neurotology Society [and] European Academy of Otology and Neurotology 33 (2):105–114. https://doi.org/10.1097/MAO.0b013e31823e28ab
- Tringali, S., K. Koka, H. A. Jenkins, and D. J. Tollin. 2015. “Sound Location Modulation of Electrocochleographic Responses in Chinchilla With Single-Sided Deafness and Fitted With an Osseointegrated Bone-Conducting Hearing Prosthesis.” Otology & Neurotology: official Publication of the American Otological Society, American Neurotology Society [and] European Academy of Otology and Neurotology 36 (4):678–686. https://doi.org/10.1097/MAO.0000000000000595
- Verstraeten, N., A. J. Zarowski, T. Somers, D. Riff, and E. F. Offeciers. 2009. “Comparison of the Audiologic Results Obtained with the Bone-Anchored Hearing Aid Attached to the Headband, the Testband, and to the 'Snap’ Abutment.” Otology & Neurotology: official Publication of the American Otological Society, American Neurotology Society [and] European Academy of Otology and Neurotology 30 (1):70–75. https://doi.org/10.1097/MAO.0b013e31818be97a
- Wendrich, A. W., T. E. Kroese, J. P. M. Peters, G. Cattani, and W. Grolman. 2017. “Systematic Review on the Trial Period for Bone Conduction Devices in Single-Sided Deafness: Rates and Reasons for Rejection.” Otology & Neurotology: official Publication of the American Otological Society, American Neurotology Society [and] European Academy of Otology and Neurotology 38 (5):632–641. https://doi.org/10.1097/MAO.0000000000001405