
Abstract
Objective
The aim of this study was to evaluate the efficacy of the Chinese version of Speech, Spatial and Qualities of Hearing Scale (C-SSQ12) in the Chinese Mandarin-speaking population and to determine its screening cut-off value by comparing measured pure-tone average (PTA), the Hearing Handicap Inventory for the Elderly-Screening Version (HHIE-S) scores and C-SSQ12 scores.
Design
All participants completed the C-SSQ12 questionnaire and underwent the pure-tone audiometry. Older subjects aged ≧ 60 years completed the HHIE-S questionnaire. The optimal cut-off value for the C-SSQ12 as a hearing screening tool was calculated by comparing different cut-offs and hearing thresholds.
Study sample
A total of 300 subjects were recruited.
Results
There was a negative correlation between C-SSQ12 scores and HHIE-S scores (r = −0.749). C-SSQ12 scores were negatively correlated with PTA (r = −0.507; r = −0.542). The best cut-off value for the C-SSQ12 was 6.0, with a sensitivity of 78.2%, specificity of 80.3%, positive predictive value of 63.7% and negative predictive value of 97.0% (PTA > 40dBHL for bilateral ears).
Conclusions
Compared to mild hearing loss, the C-SSQ12 is a reliable and validated hearing screening tool with increased sensitivity for detecting moderate-to-severe hearing loss.
Keywords:
Introduction
Hearing impairment has gained widespread recognition as a major public health issue globally. By 2021, it is anticipated that over 5% of the global population will necessitate rehabilitation to treat their disabling handicap in adult as per the World Health Organisation (WHO)(World Report on Hearing Citation2021). Furthermore, 80% of people with disabling hearing loss reside in low- and middle-income countries. In China, the largest developing country, the hearing problem is even more pronounced and serious. The number of people with hearing disorders in China has shown a significant upward trend over the past 30 years, and the burden of disease caused by handicap in adult may be heavier in the lower age groups. Specifically, the number of cases doubled in 2019 compared to 1990, with a substantial increase in prevalence among those aged >50 years, and 4.4% of the hearing impaired population were under 15 years old, with a higher proportion of total hearing loss in the younger age cohorts than in other age groups (“Hearing loss prevalence and years lived with disability, 1990–2019: findings from the Global Burden of Disease Study 2019,” GBD 2019 Hearing Loss Collaborators, 2021). Early detection, intervention and treatment of hearing loss are therefore of paramount importance. The audiogram is widely recognised as the gold standard for determining the severity of hearing loss. However, conventional audiological evaluation instruments typically gauge hearing ability in the clinic, often measuring static, predictable indicators of the frequency range and severity of hearing loss, and are severely limited by workplace and test facilities. Moreover, widely used audiological examinations pay little attention to the ecological intricacy of hearing. More recently, an increasing number of audiological scales for self-assessment of hearing performance have been developed, such as the Speech, Spatial and Qualities of Hearing Scale (SSQ)(Noble & Gatehouse, Citation2004), the Spatial Hearing Questionnaire (SHQ)(Moulin & Richard, Citation2016b) and the Hearing Handicap Inventory for the Elderly-Screening Version (HHIE-S)(Arnold, Schwartz, Neil, Chisolm, & Sanchez, Citation2022).
In China, a significant number of older people suffer from hearing loss without seeking medical intervention. In older adults, handicap in adult not only affects the social communication but can also lead to cognitive impairment, dementia, or depression (Lin et al., Citation2013). However, a study has shown that older people tend to delay seeking medical help until they have had hearing loss for about a decade (Simpson, Matthews, Cassarly, & Dubno, Citation2019). Timely hearing screening can effectively detect hearing loss and improve the social participation and quality of life of older adults. The HHIE-S is currently a widely used tool for large-scale hearing screening of older adults. The HHIE-S comprises ten items and provides a numerical score (Ventry & Weinstein, Citation1983). Scores in the range of 0 to 8 indicate that no hearing problems are present, while scores falling between 10 to 24 suggest mild-to-moderate hearing damage. The range of 26 to 40 signifies severe hearing impairment. Multiple translations of the HHIE-S have been created for use in older adult’s hearing loss screening (Duchêne, Billiet, Franco, & Bonnard, Citation2022). Jupiter et al. used the HHIE-S for hearing screening in elderly Chinese Americans in 2001 and validated its effectiveness (Jupiter & Palagonia, Citation2001), but it was not until 2014 that a true Chinese version of the HHIE-S was available for use in the Chinese elderly population (Diao et al., Citation2014). The HHIE-S is principally designed to appraise hearing impairment in subjects over the age of 60 and is not applicable to all age groups. Nevertheless, a research carried out in China indicated that the HHIE-S was appropriate for identifying hearing loss among adults above the age of 50 (Wang, Mo, Li, Zheng, & Qi, Citation2017).
The SSQ evaluates various aspects of hearing and focuses on the subject’s true hearing status in complex real-life scenarios and the impact of hearing loss on the patient’s quality of life (Noble & Gatehouse, Citation2004). The variety of questions on the SSQ scale is not conducive to the need for rapid assessment of hearing. Several simplified versions of the SSQ, including SSQ5(Noble, Naylor, Bhullar, & Akeroyd, Citation2012), SSQ6(Demeester et al., Citation2012) and SSQ12(Alkhodair, Mesallam, Hagr, & Yousef, Citation2021), have been developed for clinical practice. The SSQ12 is a simplified version created specifically for clinical research and rehabilitation therapy. Its purpose is to represent a simplified format of the full SSQ scale and is not designed for a specific target population. In comparison to the SSQ, the SSQ12 emphasises the assessment of auditory abilities in complicated surroundings. Twelve items were chosen by physicians from three separate hearing research centres, based on their prior experiences using the SSQ (Noble, Jensen, Naylor, Bhullar, & Akeroyd, Citation2013). Representatives of each centre provided their rationales for selecting those items, with experts engaging in discussions to finalise the SSQ12. Although multilingual versions of the SSQ12 are clinically validated (Aguiar, Almeida, & Miranda-Gonsalez, Citation2019; Cañete, Marfull, Torrente, & Purdy, Citation2022), there is a strong need for self-report surveys that are consistent with cross-lingual adaptation, as different cultural and ethnic backgrounds affect individuals’ daily activities.
Considering the immense Chinese-speaking population and the availability of multiple language versions of the SSQ12, we designed a Chinese version of the SSQ12. In order to ensure the sustainable application of the C-SSQ12 for hearing rehabilitation, it is important to assess the representation of hearing and disability within a relevant population sample using the scale. Noble et al. showed that after 6 months of wearing bilateral hearing aids, patients’ mean SSQ scores improved from 4.8 to 6.6. They concluded that in a general population sample, those with mean scores below 6.6 were likely to be hearing impaired, and defined the cut-off value as ≤ 6.5 (Noble et al., Citation2012), which was inevitably somewhat imprecise.
The HHIE-S is a commonly used hearing screening scale for older adults that correlates with the pure-tone average (PTA), enabling the classification of hearing loss based on its scores (Diao et al., Citation2014). The properties of SSQ12 questionnaire have been thoroughly studied and are primarily used to assess rehabilitative outcomes in patients with hearing loss. However, fewer studies have examined the correlation between SSQ12 scores and measured hearing thresholds. Moreover, there are no relevant studies to establish the cut-off value of the C-SSQ12 as a hearing screening tool. Therefore, the objective of this study was to investigate the cut-off value, sensitivity, specificity, positive predictive value, and negative predictive value for hearing impairment using different screening criteria. The correlations of the C-SSQ12 with the HHIE-S and pure-tone audiometry were analysed in order to determine whether the C-SSQ12 could be used as a rapid method for hearing screening, thus ensuring rational referral.
Materials and methods
Patient population
A total of 300 subjects who completed the pure-tone audiometry at the outpatient clinic of the Affiliated Hospital of Guizhou Medical University from September 2018 to June 2019 were randomly recruited. The participants included both normal-hearing and hearing-impaired individuals. Subjects were required to be able to understand the questionnaires and to complete them voluntarily and independently. None of the participants had previously worn hearing aids or cochlear implants. The questionnaires on paper were supplemented by face-to-face interviews during the visit to ensure that there were no missing items in each survey. Of the participants, 130 were male and 170 were female. Subjects were divided into three groups according to age (<35, n = 120; 35–59, n = 129; >60, n = 51). In addition, participants were categorised into three subgroups based on years of education (6-9, n = 102; 10–15, n = 100; ≥16, n = 98). All participants underwent the pure-tone audiometry and completed the C-SSQ12 questionnaire. The HHIE-S questionnaire was also completed by subjects aged ≥ 60 years. A total of 51 individuals aged ≥ 60 years, of whom 20 scored 0-8 on the HHIE-S, 18 scored 10–24, and 13 scored 26–40. According to the Hughson- Westlake procedure, Measurement of the pure-tone audiometry was carried out utilising an Astera hearing instrument (Natus, Middleton, United States) and performed by two trained audiologists. All audiological tests were conducted in a soundproof room, with a surrounding noise level of less than 30dBL. The pure-tone average (PTA) was used to determine the degree of hearing loss and included hearing tests at four frequencies −0.5 kHz, 1 kHz, 2 kHz and 4 kHz. Participants in this study were divided into a no hearing loss group (PTA ≤ 25dBHL), a mild hearing loss group (25 < PTA ≤ 40dBHL), and a moderate-to-severe hearing loss group (PTA > 40dBHL) (Wang, Mo, Li, Zheng, & Qi, Citation2017). All participants signed the informed consent forms. The Ethics Review Committee of the Affiliated Hospital of Guizhou Medical University approved the protocols and procedures for this study.
C-SSQ12
The C-SSQ12 comprised 12 questions aligning with the comprehensive version of the SSQ, covering the speech (#1, #4, #10, #11, #12), spatial (#6, #9, #13) and quality (#2, #7, #9, #14). Each item was rated on a scale of 0–10. A score of 0 denoted patients’ inability to complete the description in the item. A score of 10 indicated the subjects’ full capability of performing or encountering what was specified in the question. If the question did not apply to the current situation, the patients marked the ‘not applicable’ option. The C-SSQ12 was previously translated and validated, with strict adherence to guidelines for cross-cultural applicability of self-assessment scales (Hall et al., Citation2018). Overall, the translation of the questionnaire consisted of four parts. A. Initial translation: The English version of the SSQ12 was translated into Chinese by a pair of bilingual translators, consisting of a high school English teacher and an otolaryngologist. The translators employed simple vocabulary to ensure accessibility for individuals with low levels of education. A professor of Chinese language was subsequently requested to review the Chinese version to eliminate grammar issues and to evaluate the educational level at which the scale’s content could be comprehended. B. Re-translation: Two university professors specialising in English translated the Chinese version of the SSQ12 back into English and compared their final translation with the original scale. They had not seen the original English scale before the translation process. C. Expert review: Two audiology professors compared the Chinese translation of SSQ12 with its English version, and established the final C-SSQ12 affirming the statements’ clarity and simplicity, and the equivalence of the concepts. D. Testing the final version: Ten participants were randomly selected to complete the final version of the C-SSQ12 questionnaire, and final adjustments were made on the basis of their comments.
HHIE-s
According to current research, the HHIE-S was a widely used and available instrument for large-scale hearing screening of senior citizens. The scale comprised ten items that were investigated via patient self-completion or tester-guided method. Based on the emotional and social dimensions, the HHIE-S was primarily a reflection of the hearing and verbal communication of older adults. The HHIE-S exhibited high reliability and validity and correlated with the pure-tone audiometry (Chang, Ho, & Chou, Citation2009). It was extensively utilised in English and other language countries and was advocated by the American Speech Language Hearing Association (ASHA) as one of the screening techniques for adults with hearing loss (ASHA Citation1997). There were ten items in the HHIE-S test, which were rated on a scale of 0, 2, and 4, indicating whether subjects did not, sometimes, or did exhibit what was described in the items. A score between 0 and 8 denoted no hearing loss, while scores of 10–24 and 26–40 represented mild-to-moderate or severe hearing loss, respectively. The ASHA hearing screening guidelines stipulated that a score of greater than 8 on the HHIE-S suggested the presence of hearing impairment and could be utilised as a criterion for hearing screening (“Guidelines for the identification of hearing impairment/handicap in adult/elderly persons,” American Speech Language Hearing Association, Citation1989).
Statistical analysis
The Statistical Package for the Social Sciences (SPSS) 22.0 was used for all statistical calculations. Pure-tone audiometry results, C-SSQ12 scores, and HHIE-S scores were in accordance with a normal distribution. Correlations of clinical data were analysed using the Pearson test (Pripp, Citation2018). The Student’s t test was used for comparison of differences between two groups. One-way Analysis of Variance (ANOVA) was utilised to compare differences between multiple groups (Vrbin, Citation2022). The ages and years of education of the subjects conformed to a non-normal distribution and were statistically analysed using Kruskal-Wallis test. The receiver operating characteristic (ROC) curve (Obuchowski & Bullen, Citation2018) and the Youden index (Lai, Tian, & Schisterman, Citation2012) were performed for the calculation of the relevant cut-off values. A p-value of less than 0.05 was considered statistically significant.
Results
Analysis of basic clinical characteristics
A total of three hundred participants were categorised based on their age, gender, and years of education (). The age distribution of all subjects ranged from 12 to 86 years, with a mean age of 42 years. With regard to the mean scores for C-SSQ12, there was no significant difference between ≥ and < 60 years old (3.63 ± 1.67 vs 4.02 ± 1.86; p = 0.342). In our study cohort, 43% of the participants were male while 57% were female. Additionally, among the individuals with C-SSQ12 scores ≤ 6.5, the proportions of females and males were 53% and 47%, respectively (p = 0.081). Education levels of the participants were classified into primary (6–9 years), secondary (10–15 years), and tertiary (≥16 years), with 34%, 33.3%, and 32.7%, respectively. In terms of the hearing loss, 105 patients had PTA > 25dBHL on the better ear and 58 had > 40dBHL. In this case, 67.7% of the participants were considered to have no hearing deficit, but in fact 20.7% of them had unilateral hearing damage. In addition, hearing loss was defined as the worse ear PTA > 25dBHL and 40dBHL in 195 (65.0%) and 129 (43.0%) individuals, respectively.
Table 1. Number of cases with C-SSQ12 ≤ 6.5 in different genders, ages and education levels.
Comparison of C-SSQ12 scores, HHIE-S scores and hearing loss
The mean score of C-SSQ12 for the 300 subjects was 6.58 ± 2.77. When used as hearing screening tools, the C-SSQ12 and the HHIE-S were associated with the severity of hearing loss (). Based on the HHIE-S scores grouping (mild: 0–8; moderate: 10–24; severe: 26–40), the C-SSQ12 scores for the various subgroups showed significant statistical differences after comparison (p < 0.001). Through the application of Pearson correlation analysis, a strong negative correlation was demonstrated between the HHIE-S scores and the C-SSQ12 scores (r = −0.749; p < 0.001; ). Mean scores on the C-SSQ12 and its three subscales decreased as hearing impairment worsened. The slopes of decline for all four curves were similar (). In comparison to the speech and spatial scores, there was a slightly quicker decline in the quality score with hearing loss. Grouping was determined according to 10dBHL intervals. The C-SSQ12 and all three subscales showed noteworthy reductions in mean scores when PTA = 54-65dBHL (). When the better ear PTA was less than 55dBHL, the C-SSQ12 score decreased on average by 0.69 for every 10dBHL increase. Nevertheless, with a better ear PTA ranging from 54dBHL to 65dBHL, the C-SSQ12 score exhibited a significant decrease of 2.74. The correlation coefficient between C-SSQ12 score and better ear PTA was −0.569 (p < 0.001; ). Besides, the correlation coefficients of C-SSQ12 scores with left and right ear PTA were −0.507 and −0.542, respectively (p < 0.001; p < 0.001; ).
Figure 1. Comparison and distribution of C-SSQ12 scores between different HHIE-S subgroups. C-SSQ12, the Chinese version of short form of Speech, Spatial and Qualities of Hearing Scale; HHIE-S, the Hearing Handicap Inventory for the Elderly-Screening Version; SD, standard deviation.
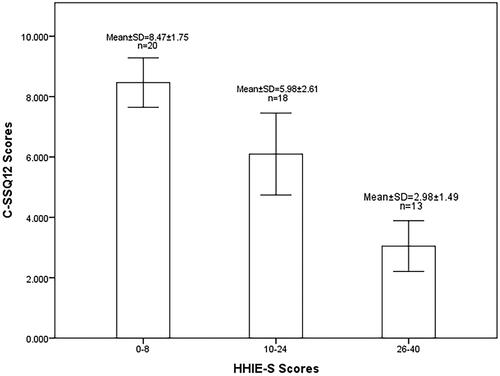
Figure 2. Correlation between C-SSQ12 scores with HHIE-S scores (A) and better ear PTA (B). C-SSQ12, the Chinese version of short form of Speech, Spatial and Qualities of Hearing Scale; HHIE-S, the Hearing Handicap Inventory for the Elderly-Screening Version; PTA, pure-tone average.
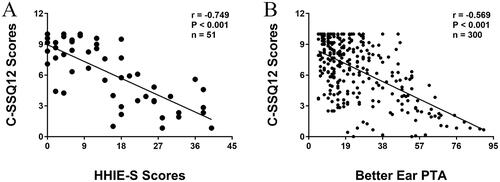
Figure 3. Distribution of C-SSQ12 mean scores and three subscale scores based on the better ear PTA. PTA, pure-tone average; SEM, standard error of the mean.
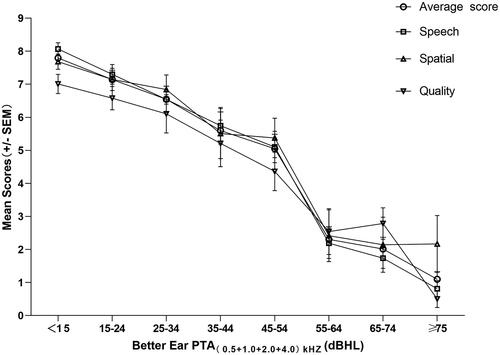
Table 2. Correlation between C-SSQ12 scores and PTA.
Determination of the cut-off values
In this study, firstly, better ear PTA > 40dBHL, worse ear PTA > 40dBHL and binaural ear PTA > 40dBHL were used as screening criteria for hearing impairment. ROC curves were constructed from the C-SSQ12 scores and used to analyse the predictive value for diagnosing hearing loss (). If the definition of the hearing loss was considered to be PTA > 25dBHL on the binaural ear, the AUC was 0.813. The maximum Youden Index point was a threshold of 6.5. The 83.9% specificity was reached with a threshold of 6.5, with 65.9% sensitivity. If the definition of the hearing loss was considered to be PTA > 25dBHL on the worse ear, the AUC was 0.780. The maximum Youden Index point was a threshold of 5.8. The 92.4% specificity was reached with a threshold of 5.8, with 49.7% sensitivity. If the definition of the hearing loss was considered to be PTA > 25dBHL on the better ear, the AUC was 0.750. The maximum Youden Index point was a threshold of 6.4. The 72.8% specificity was reached with a threshold of 6.4, with 69.5% sensitivity. If the definition of the hearing loss was considered to be PTA > 40dBHL on the binaural ear, the AUC is 0.841. The maximum Youden Index point was a threshold of 6.0. The 80.3% specificity was reached with a threshold of 6.0, with 78.2% sensitivity. If the definition of the hearing loss was considered to be PTA > 40dBHL on the worse ear, the AUC is 0.824. The maximum Youden Index point was a threshold of 6.5. The 78.2% specificity was reached with a threshold of 6.5, with 73.1% sensitivity. If the definition of the hearing loss was considered to be PTA > 40dBHL on the better ear, the AUC was 0.851. The maximum Youden Index point was a threshold of 6.4. The 69% specificity was reached with a threshold of 6.5, with 91.3% sensitivity. The proportion of subjects with a C-SSQ12 score < 6.4 in our study population was 42.67%. The corresponding sensitivity, specificity, positive predictive value and negative predictive value for better ear PTA > 40dBHL and C-SSQ12 score < 6.4 were shown in . We summarised the sensitivity, specificity, positive predictive value, negative predictive value and 95% confidence interval (CI) corresponding to the various cut-off values for the different hearing loss screening criteria (). When the C-SSQ12 score was < 6.4 and the better ear PTA was > 40dBHL, the sensitivity was 91.4% (95% CI: 83.9%–98.2%) and the specificity was 69.0% (95% CI: 63.1%–74.9%). Furthermore, when the C-SSQ12 score was < 6.0 and binaural PTA was > 40dBHL, the sensitivity was 78.2% (95% CI: 69.7%-86.9%) and the specificity was 80.3% (95% CI: 74.8%–85.7%).
Figure 4. Receiver operating characteristic curves for C-SSQ12 scores when worse (A) and better (B) ear PTA > 40dBHL were used as the screening criteria for hearing impairment. AUC, the area under curve.
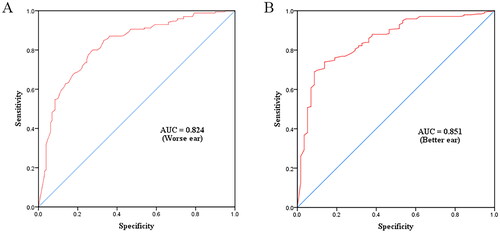
Table 3. Sensitivity, specificity, positive predictive value, negative predictive value and 95% CI of the C-SSQ12 when using a cut-off value of 6.4 and a better ear PTA > 40dBHL as hearing screening criteria.
Table 4. Sensitivity, specificity, positive predictive value, negative predictive value and 95% CI of different C-SSQ12 cut-off values for mild and moderate-to-severe hearing loss.
Discussion
Most hearing tests only evaluate the severity of hearing impairment, but a good hearing assessment tool should not only identify the presence or absence of hearing loss in the subject population, but should also reflect hearing ability in a real-world environment. Currently, hearing assessment scales used in clinical practice focus less on these aspects. The SSQ12 fulfils the same objective as the SSQ for evaluating varied hearing capacity in challenging real-life contexts, but is comparatively more user-friendly and has been implemented in clinical settings (Peetermans et al., Citation2022). It has been suggested that SSQ12 scores are approximately 0.37 points lower than SSQ scores and that the SSQ12, like the SSQ, is sensitive to temporal changes in the assessment of hearing capacity (Wyss, Mecklenburg, & Graham, Citation2020). However, the SSQ12 is mainly used to assess rehabilitation outcomes and is rarely used as a hearing screening tool (Sanchez-Cuadrado et al., Citation2021). Therefore, the main objective of this study was to investigate the effectiveness of the C-SSQ12 as a screening tool and to establish its cut-off values for early and targeted intervention for people with hearing impairment.
The HHIE-S was an initial screening diagnostic scale for hearing loss, and the correlation coefficient between the Chinese version of HHIE-S and the better ear PTA was 0.745(Diao et al., Citation2014). In our study, C-SSQ12 scores were correlated with HHIE-S scores and the correlation coefficient was −0.749 (P < 0.001). One study confirmed that the correlation coefficient between the SSQ12 and the original rating scale ranged from 0.37 to 0.79(Ou & Kim, 2017). The cronbach’s alpha for the C-SSQ12 was 0.94 and item-total correlation for all items were 0.68–0.85, suggesting that the C-SSQ12 had good reliability. However, the absence of reproductibility evaluation was an important limit. C-SSQ12 scores decreased with increasing hearing impairment, but this correlation was not significant in patients with normal hearing or mild hearing loss, which was consistent with findings from other language versions of the SSQ12(Cañete et al., Citation2022; Moulin, Vergne, Gallego, & Micheyl, Citation2019). In the current investigation, a decrease of 0.69 in C-SSQ12 scores was observed for every 10dBHL increase when the PTA was < 55dBHL, surpassing the reduction of 0.43 for every 10dBHL increase reported by Akeroyd for SSQ (Akeroyd, Guy, Harrison, & Suller, Citation2014). However, this was in close accord with the decline of 0.69 reported by Annie Moulin (Moulin & Richard, Citation2016a), and slightly less than the decrease of 0.75 per 10dBHL in the original version of the SSQ12(Noble et al., Citation2013). There were several plausible reasons for the disparity in findings across the various studies. First of all, the majority of the randomly selected subjects in this study were young people with a low degree of hearing impairment and therefore low sensitivity to the perception of hearing loss. In addition, due to the influence of traditional Eastern culture, the Chinese tended to be conservative and most people preferred to stay in familiar surroundings and were less demanding in adapting to their environment, which also limited the impact of hearing impairment (Wu et al., Citation2011).
Previous studies using different versions have reported mean total SSQ scores ranging from 6.7 to 8.8 for normal-hearing participants and from 4.1 to 7.7 for hearing-impaired patients, values that are confirmed by the results of the present study (Moulin & Richard, Citation2016a). In our study, binaural ear PTA > 40dBHL, worse ear PTA > 40dBHL and better ear PTA > 40dBHL were used as screening criteria for moderate-to-severe hearing loss in reference to the Ventry and Weinstein screening criteria (Ventry & Weinstein, Citation1982). The AUCs for the binaural, worse, and better ear in our study were 0.841, 0.824, and 0.851, respectively. In Western countries, the SSQ12 scale is mostly applied to assess the effectiveness of interventions in patients with sensorineural deafness (Megha & Maruthy, Citation2019). In total, there were 122 cases of sensorineural hearing loss in this study. Compared to subjects without hearing loss, the cut-off value of the C-SSQ12 score was 6.0, with a sensitivity of 85.7% and a specificity of 86.1%. Our experimental data were similar to those of a previous study. They reported the AUC of 0.86 for the SSQ12, and the sensitivity and specificity for symmetric hearing loss were 89% and 86%, respectively (Kamerer, Harris, Kopun, Neely, & Rasetshwane, Citation2022). This showed that the C-SSQ12 was feasible for use in hearing screening for sensorineural deafness. However, the current study aimed to evaluate the feasibility of utilising a concise hearing assessment tool for the purpose of screening, with consideration for various types of hearing loss among the chosen participants. In this study, 28% of patients had > 20dBHL difference between better and worse ear, showing that those subjects had asymmetrical hearing loss. A previous study showed that asymmetrical hearing loss can significantly affect the spatial and quality scores of the SSQ (Noble & Gatehouse, Citation2004). We found that the quality score was lower than the spatial score for the same degree of hearing damage.
Therefore, in addition to the traditional hearing test criteria, the screening criteria for hearing impairment used in this study were PTA > 25dBHL and 40dBHL in the left, right, worse and better ear. If the binaural PTA > 40dBHL was used as the hearing screening criterion, the cut-off for the C-SSQ12 was 6.0. Our experimental data were similar to the findings of von Gablenz et al. who showed that a cut-off value of 6 points on the SSQ17 predicted the self-reporting of hearing difficulties on a chance level (von Gablenz, Otto-Sobotka, & Holube, Citation2018). However, Noble et al. suggested that SSQ scores ≤ 6.5 should be defined as the hearing deficit (Noble et al., Citation2012). When utilising PTA > 40dBHL in the better ear as a criterion for hearing screening, the C-SSQ12 exhibited a cut-off value of 6.4, a sensitivity of 91.3%, a specificity of 69.0%, a positive predictive value of 41.4%, and a negative predictive value of 97.1%. In this case, however, there were only 58 subjects with a prevalence of 19.3%, which was quite different from the real situation. The positive predictive value was directly affected by the prevalence and was therefore only 41.4%. A study demonstrated that the Portuguese version of the SSQ5 had a cut-off value of 7.3 points, a sensitivity of 81.8%, a specificity of 78.3%, a positive predictive value of 78.3% and a negative predictive value of 81.8%, using the PTA > 25dBHL as a screening criterion for hearing impairment (Assef, Almeida, & Miranda-Gonsalez, Citation2022). In our results, when binaural ear PTA > 25dBHL was taken as a screening criterion in general population for hearing loss, the cut-off value of the C-SSQ12 was 6.5 points, with a sensitivity of 65.9%, a specificity of 83.9%, a positive predictive value of 83.1% and a negative predictive value of 67.3%. Regarding the disparities in the findings of the aforementioned results, it was hypothesised that certain studies prioritised the detection of potential hearing impairment through sensitivity, whereas others concentrated more on specificity in normal hearing populations. Lower positive predictive values result in increased false positive rates. This, in turn, leads to wastage of healthcare resources as subjects have to undergo unnecessary hearing tests at hospitals. Hence, taking into account the severity and type of hearing impairment, referral rates of C-SSQ12 > 6.0 (PTA > 40dBHL) and C-SSQ12 > 6.5 (PTA > 25dBHL) are deemed appropriate.
In this study, there were 51 participants aged ≥ 60 years, and the percentages of HHIE-S > 8 and C-SSQ12 ≤ 6.5 were 60.78% and 50.98%, respectively. Taking better ear PTA > 25dBHL as a screening criterion and C-SSQ12 ≤ 6.5 as the cut-off value, the sensitivity, specificity, positive predictive value and negative predictive value were 91.3%, 66.9%, 39.8% and 97.0%, respectively. HHIE-S scores were divided into three groups of 0-8, 10-24 and 26-40. There were statistically significant differences in C-SSQ12 scores between these three subgroups. These data suggested that the grading of the degree of hearing impairment in the C-SSQ12 could be analysed with reference to the grouping criteria of the HHIE-S. However, the ability of the C-SSQ12 to further differentiate the severity of hearing loss needed to be validated in a larger clinical sample.
The C-SSQ12, based on a quantitative study design, focuses on quantifying patients’ dynamic hearing abilities in daily communication settings. It has also been shown to have excellent validity and is ideal for comprehensive assessment of hearing function in complex environments. The C-SSQ12 scale provides clinicians with a relatively complete profile of a patient’s hearing impairment. Moreover, the easy-to-use C-SSQ12 can bridge the gap in the hearing care infrastructure and effectively address the distance that patients often have to travel to and from the hearing centre. The determination of the appropriate cut-off value allows for an accurate referral service and the C-SSQ12 as a hearing screening tool has important clinical applications in the early detection, diagnosis and treatment of hearing impairment.
Ethical approval
We briefed all participants in detail on the sample collection process, and all participants provided written informed consent following the declaration of Helsinki (Gandevia & Tovell, Citation1964). All procedures in this study related to human participants followed the ethical standards of the institutional and/or national research committees. The approval of this study was obtained from the institutional review committee of the Affiliated Hospital of Guizhou Medical University (China approval number: XYK20180709; Date: 26 August 2018).
Authors’ contribution
All authors made a significant contribution to the work reported, whether that is in the conception, study design, execution, acquisition of data, analysis and interpretation, or in all these areas; they took part in drafting, revising or critically reviewing the article; gave final approval of the version to be published; have agreed on the journal to which the report has been submitted; and agree to be accountable for all aspects of the work.
Disclosure statement
The authors declare that the research was conducted without any commercial or financial relationships construed as a potential conflict of interest.
References
- Aguiar, R. G. R., K. Almeida, and E. C. Miranda-Gonsalez. 2019. “Test-Retest Reliability of the Speech, Spatial and Qualities of Hearing Scale (SSQ) in Brazilian Portuguese.” International Archives of Otorhinolaryngology 23 (4):e380–e383. https://doi.org/10.1055/s-0039-1677754
- Akeroyd, M. A., F. H. Guy, D. L. Harrison, and S. L. Suller. 2014. “A factor analysis of the SSQ (Speech, Spatial, and Qualities of Hearing Scale).” International Journal of Audiology 53 (2):101–114. https://doi.org/10.3109/14992027.2013.824115
- Alkhodair, M. B., T. A. Mesallam, A. Hagr, and M. F. Yousef. 2021. “Arabic Version of Short Form of the Speech, Spatial, and Qualities of Hearing Scale (SSQ12).” Saudi Medical Journal 42 (11):1180–1185. https://doi.org/10.15537/smj.2021.42.11.20210441
- American Speech Language Hearing Association. 1989. “Guidelines for the Identification of Hearing Impairment/Handicap in Adult/Elderly Persons.” Asha 31 (8):59–63.
- Arnold, M. L., B. Schwartz, H. Neil, T. H. Chisolm, and V. A. Sanchez. 2022. “Feasibility and Assessment of a Hybrid Audiology Service Delivery Model for Older Adult Hearing Aid Users: A Pilot Study.” American Journal of Audiology 31 (3s):892–904. https://doi.org/10.1044/2022_aja-21-00200
- Assef, R. A., K. Almeida, and E. C. Miranda-Gonsalez. 2022. “Sensitivity and specificity of the Speech, Spatial and Qualities of Hearing Scale (SSQ5) for Screening Hearing in Adults.” CoDAS 34 (4):e20210106. https://doi.org/10.1590/2317-1782/20212021106
- ASHA 1997. “Guidelines for Audiologic Screening.” Retreived from Www.asha.org/Policy. Accessed October 26:2023.
- Cañete, O. M., D. Marfull, M. C. Torrente, and S. C. Purdy. 2022. “The Spanish 12-item version of the Speech, Spatial and Qualities of Hearing scale (Sp-SSQ12): Adaptation, Reliability, And Discriminant Validity for People with and without Hearing Loss.” Disability and Rehabilitation 44 (8):1419–1426. https://doi.org/10.1080/09638288.2020.1795279
- Chang, H. P., C. Y. Ho, and P. Chou. 2009. “The Factors Associated with a Self-Perceived Hearing Handicap in Elderly People with Hearing Impairment–Results from a Community-Based Study.” Ear and Hearing 30 (5):576–583. https://doi.org/10.1097/AUD.0b013e3181ac127a
- Demeester, K., V. Topsakal, J.-J. Hendrickx, E. Fransen, L. van Laer, G. Van Camp, P. Van de Heyning, and A. van Wieringen. 2012. “Hearing Disability Measured by the Speech, Spatial, And Qualities Of Hearing Scale in Clinically Normal-Hearing and Hearing-Impaired Middle-Aged Persons, and Disability Screening by Means of a Reduced SSQ (The SSQ5).” Ear and Hearing 33 (5):615–616. https://doi.org/10.1097/AUD.0b013e31824e0ba7
- Diao, M., J. Sun, T. Jiang, F. Tian, Z. Jia, Y. Liu, and D. Chen. 2014. “Comparison Between Self-Reported Hearing and Measured Hearing Thresholds of the Elderly in China.” Ear and Hearing 35 (5):e228-232–e232. https://doi.org/10.1097/aud.0000000000000050
- Duchêne, J., L. Billiet, V. Franco, and D. Bonnard. 2022. “Validation of the French Version of HHIE-S (Hearing Handicap Inventory for the Elderly - Screening) Questionnaire in French Over-60 Year-Olds.” European Annals of Otorhinolaryngology, Head and Neck Diseases 139 (4):198–201. https://doi.org/10.1016/j.anorl.2021.11.003
- Gandevia, B., and A. Tovell. 1964. “Declaration of Helsinki.” The Medical Journal of Australia 2:320–321.
- GBD 2019 Hearing Loss Collaborators. 2021. “Hearing Loss Prevalence and Years Lived with Disability, 1990-2019: findings from the Global Burden of Disease Study 2019.” Lancet 397 (10278):996–1009. https://doi.org/10.1016/s0140-6736(21)00516-x
- Hall, D. A., S. Zaragoza Domingo, L. Z. Hamdache, V. Manchaiah, S. Thammaiah, C. Evans, and L. L. N. Wong, 2018. “A Good Practice Guide for Translating and Adapting Hearing-Related Questionnaires for Different Languages and Cultures.” International Journal of Audiology 57 (3):161–175. https://doi.org/10.1080/14992027.2017.1393565
- Jupiter, T., and C. L. Palagonia. 2001. “The Hearing Handicap Inventory for the Elderly Screening Version Adapted for Use with Elderly Chinese American Individuals.” American Journal of Audiology 10 (2):99–103. https://doi.org/10.1044/1059-0889(2001/010)
- Kamerer, A. M., S. E. Harris, J. G. Kopun, S. T. Neely, and D. M. Rasetshwane. 2022. “Understanding Self-reported Hearing Disability in Adults with Normal Hearing.” Ear and Hearing 43 (3):773–784. https://doi.org/10.1097/aud.0000000000001161
- Lai, C. Y., L. Tian, and E. F. Schisterman. 2012. “Exact Confidence Interval Estimation for the Youden Index and its Corresponding Optimal Cut-Point.” Computational Statistics & Data Analysis 56 (5):1103–1114. https://doi.org/10.1016/j.csda.2010.11.023
- Lin, F. R., K. Yaffe, J. Xia, Q.-L. Xue, T. B. Harris, E. Purchase-Helzner, S. Satterfield, H. N. Ayonayon, L. Ferrucci, … E. M. Simonsick, 2013. “Hearing Loss and Cognitive Decline in Older Adults.” JAMA Internal Medicine 173 (4):293–299. https://doi.org/10.1001/jamainternmed.2013.1868
- Megha , and Maruthy S, (2019). Auditory and Cognitive Attributes of Hearing Aid Acclimatization in Individuals with Sensorineural Hearing Loss. American Journal of Audiology, 28(2s), 460–470. https://doi.org/10.1044/2018_aja-ind50-18-0100
- Moulin, A., and C. Richard. 2016a. “Sources of Variability of Speech, Spatial, and Qualities of Hearing Scale (SSQ) Scores in Normal-Hearing and Hearing-Impaired Populations.” International Journal of Audiology 55 (2):101–109. https://doi.org/10.3109/14992027.2015.1104734
- Moulin, A., and C. Richard. 2016b. “Validation of a French-Language Version of the Spatial Hearing Questionnaire, Cluster Analysis and Comparison with the Speech, Spatial, and Qualities of Hearing Scale.” Ear and Hearing 37 (4):412–423. https://doi.org/10.1097/aud.0000000000000269
- Moulin, A., J. Vergne, S. Gallego, and C. Micheyl. 2019. “A New Speech, Spatial, and Qualities of Hearing Scale Short-Form: Factor, Cluster, and Comparative Analyses.” Ear and Hearing 40 (4):938–950. https://doi.org/10.1097/aud.0000000000000675
- Noble, W., and S. Gatehouse. 2004. “Interaural Asymmetry of Hearing Loss, Speech, Spatial and Qualities of Hearing Scale (SSQ) Disabilities, and handicap.” International Journal of Audiology 43 (2):100–114. https://doi.org/10.1080/14992020400050015
- Noble, W., N. S. Jensen, G. Naylor, N. Bhullar, and M. A. Akeroyd. 2013. “A Short form of the Speech, Spatial and Qualities of Hearing Scale Suitable for Clinical Use: The SSQ12.” International Journal of Audiology 52 (6):409–412. https://doi.org/10.3109/14992027.2013.781278
- Noble, W., G. Naylor, N. Bhullar, and M. A. Akeroyd. 2012. “Self-Assessed Hearing Abilities in middle- and Older-Age Adults: A Stratified Sampling Approach.” International Journal of Audiology 51 (3):174–180. https://doi.org/10.3109/14992027.2011.621899
- Obuchowski, N. A., and J. A. Bullen. 2018. “Receiver Operating Characteristic (ROC) Curves: Review of Methods with Applications in Diagnostic Medicine.” Physics in Medicine and Biology 63 (7):07tr01. https://doi.org/10.1088/1361-6560/aab4b1
- Ou, H., and K. Elaine. 2017. “Which Short Version of the Speech, Spatial, and Qualities of Hearing Scale to Choose: SSQ5 or SSQ12?” Journal of Otorhinolaryngology Disorders and Treatments 1 (1):1–8. https://doi.org/10.16966/jodt.101
- Peetermans, O., B. Dobbels, G. Mertens, J. Moyaert, R. van de Berg, O. Vanderveken, P. Van de Heyning, A. Pérez Fornos, N. Guinand, M. J. W. Lammers, et al. 2022. “Sound Localization in Patients with Bilateral Vestibulopathy.” European Archives of Oto-Rhino-Laryngology: official Journal of the European Federation of Oto-Rhino-Laryngological Societies : Affiliated with the German Society for Oto-Rhino-Laryngology - Head and Neck Surgery 279 (12):5601–5613. https://doi.org/10.1007/s00405-022-07414-7
- Pripp, A. H. 2018. “[Pearson’s or Spearman’s Correlation Coefficients].” Tidsskrift for Den Norske Laegeforening: tidsskrift for Praktisk Medicin, ny Raekke 138 (8) :1-3. https://doi.org/10.4045/tidsskr.18.0042
- Sanchez-Cuadrado, I., M. Calvino, J. M. Morales-Puebla, J. Gavilán, T. Mato, J. Peñarrocha, M. P. Prim, and L. Lassaletta. 2021. “Quality of Life Following Cochlear Implantation in Patients with Menière’s Disease.” Frontiers in Neurology 12:670137. https://doi.org/10.3389/fneur.2021.670137
- Simpson, A. N., L. J. Matthews, C. Cassarly, and J. R. Dubno. 2019. “Time From Hearing Aid Candidacy to Hearing Aid Adoption: A Longitudinal Cohort Study.” Ear and Hearing 40 (3):468–476. https://doi.org/10.1097/AUD.0000000000000641
- Ventry, I. M., and B. E. Weinstein. 1982. “The Hearing Handicap Inventory for the Elderly: A New Tool.” Ear and Hearing 3 (3):128–134. https://doi.org/10.1097/00003446-198205000-00006
- Ventry, I. M., and B. E. Weinstein. 1983. “Identification of Elderly People with Hearing Problems.” ASHA 25 (7):37–42.
- von Gablenz, P., F. Otto-Sobotka, and I. Holube. 2018. “Adjusting Expectations: Hearing Abilities in a Population-Based Sample Using an SSQ Short Form.” Trends in Hearing 22:2331216518784837. https://doi.org/10.1177/2331216518784837
- Vrbin, C. M. 2022. “Parametric or Nonparametric Statistical Tests: Considerations When Choosing the Most Appropriate Option for Your Data.” Cytopathology: official Journal of the British Society for Clinical Cytology 33 (6):663–667. https://doi.org/10.1111/cyt.13174
- Wang, Y., L. Mo, Y. Li, Z. Zheng, and Y. Qi. 2017. “Analysing use of the Chinese HHIE-S for Hearing Screening of Elderly in a Northeastern Industrial Area of China.” International Journal of Audiology 56 (4):242–247. https://doi.org/10.1080/14992027.2016.1263399
- World Report on Hearing 2021. Retreived from. https://www.who.int/teams/noncommunicable-diseases/sensory-functions-disability-and-rehabilitation/highlighting-priorities-for-ear-and-hearing-care. Accessed October 1, 2023.
- Wu, X., Z. Yang, Y. Huang, J. Chen, L. Li, M. Daneman, and B. A. Schneider. 2011. “Cross-Language Differences in Informational Masking of Speech by Speech: English versus Mandarin Chinese.” Journal of Speech, Language, and Hearing Research 54 (6):1506–1524. https://doi.org/10.1044/1092-4388(2011/10-0282)
- Wyss, J., D. J. Mecklenburg, and P. L. Graham. 2020. “Self-Assessment of Daily Hearing Function for Implant Recipients: A Comparison of Mean Total scores for the Speech Spatial Qualities of Hearing Scale (SSQ49) with the SSQ12.” Cochlear Implants International 21 (3):167–178. https://doi.org/10.1080/14670100.2019.1707993