
Abstract
Objective
Knowledge regarding hearing acuity in the nonagenarian age group is sparse. In this study we aimed to advance our understanding of hearing loss in the 10th decade of life.
Design
A cross-sectional study in which standardised hearing measurements were performed during home visits, which included care home facilities and nursing homes to maximise participation.
Study sample
Two unselected groups of individuals aged 90 (n = 42) and 95 (n = 49), sampled from the population-based Gothenburg H70 Birth Cohort Studies.
Results
98% of the participants (95% CI [95, 100]) had some degree of hearing loss in their better ear, with 83% (95% CI [73, 89]) having a potentially disabling hearing loss of moderate degree or worse, according to WHO criteria. Furthermore, differences between the two age groups (five years apart) indicate an increasing hearing loss, primarily at frequencies ≥ 2 kHz.
Conclusion
Hearing loss was present in almost all of the participants in the nonagenarian age group and among a majority of them potentially to a degree that would warrant rehabilitation. Carrying out standardised hearing measurements in a home setting was feasible in this age group and enhanced the representativeness of the study population.
MAIN POINTS TO HIGHLIGHT
Bilateral hearing loss affected almost all of the individuals in the nonagenarian age group with 8 in 10 having hearing loss of a degree severe enough to warrant intervention or hearing aid prescription.
The findings provide valuable insight into hearing acuity among nonagenarians. Many earlier studies were limited to subjective hearing assessments, reviews of medical records and/or screening tests performed by non-audiologists.
The final sample size was smaller than initially planned due to the COVID-19 pandemic. However, measures were taken to optimise the representativeness of the study sample.
Introduction
A globally growing population and increasingly long lifespan is associated with opportunities as well as challenges. The number of people aged 80 to 89 years – octogenarians – and aged 90 to 99 years – nonagenarians – are expected to increase rapidly, particularly in developed countries. In Sweden, it is projected that half of individuals born in 2022 are expected to live well into their 90s (Statistics Sweden Citation2022). The octo- and nonagenarian age groups are diverse in many regards. While some individuals maintain strong physical and mental abilities well into their later years, this age group is also associated with various health problems, functional disability and comorbidities that affect the individual – as well as society as a whole – in a fundamental way (Christensen et al. Citation2009). In Sweden the prevalence of dementia among 95-year-olds is almost 52% and it is more common in females than in males (Börjesson-Hanson et al. Citation2004).
Age-related hearing loss (ARHL) is a highly prevalent sensory impairment that progresses with age. At 85 years of age, almost half of individuals are expected to have a potentially disabling hearing loss (Göthberg et al. Citation2021). Unaddressed hearing loss has a negative effect on verbal communication, psychosocial well-being and quality of life. In older individuals, there is also an increased risk of falls, frailty, dementia and depression (Cunningham and Tucci Citation2017).
As previously mentioned, ARHL progresses with advancing age. However, studies focusing on nonagenarians show disparate results with respect to the rate of decline, as well as the prevalence, type and severity of hearing loss. Differences in the rate and frequency range of hearing decline between females and males have also been documented. However, most previous studies were based on small sample sizes, subjective hearing assessments, reviews of medical records and/or screening tests performed by non-audiologists (Gates and Cooper Citation1991; Jönsson and Rosenhall Citation1998; Leskowitz et al. Citation2016; Wattamwar et al. Citation2017; Wiley et al. Citation2008). Undoubtedly, there are unique challenges associated with conducting research on this age group due to the high prevalence of cognitive, functional and sensory impairments, as well as the fact that many of the research subjects are housebound or reside in care homes (García-Peña et al. Citation2018). To our knowledge, very few – if any – of the studies focusing on hearing acuity in individuals aged ≥ 90 years were based on unselected samples or used standardised hearing assessments in home settings.
Consequently, the purpose of the present study was to obtain representative data on hearing acuity in individuals aged ≥ 90 years so as to advance our understanding of hearing ability in the nonagenarian age group. In this paper, we report on the prevalence and characteristics of hearing loss based on standardised pure-tone audiometry (air- and bone-conduction), and assessments of middle ear status. We also compare the hearing ability of two age groups, five years apart, as well as of females to males. To maximise participation, all measurements were made during home visits, which included nursing homes and special housing facilities.
Materials and methods
This study comprised cross-sectional data from two unselected groups of individuals sampled from the Gothenburg H70 Birth Cohort Studies (H70) born in 1930 and 1923/24 respectively. The H70 studies are multidisciplinary, epidemiological studies of normal ageing and its effects on physical and mental health. The samples are systematically selected based on birth dates, aiming to be representative of same-aged individuals living in Gothenburg Municipality in Sweden. The sampling procedures and examinations have been similar between different cohorts in the H70 studies; for the interested reader, this is described in detail elsewhere (Rydberg Sterner et al. Citation2019).
The H70 1930 and 1923/24 cohorts
Individuals born in 1930 (n = 654) were sampled to take part in the extensive 2018 H70 study at the age of 88 years. Of those, 32 (5%) individuals died prior to, or during the study; 26 (4%) could not be reached; nine (1%) were excluded due to difficulties in understanding Swedish. Out of the remaining 587 individuals, 286 declined to participate, leaving 301 participants (response rate 51%). A previous study (Wetterberg et al. Citation2022) investigated the representativeness of a majority (n = 505) of this cohort by e.g. comparing participants with refusals. Refusals had lower education levels as well as a higher rate of hospital discharges due to neuropsychiatric diseases. However, no difference was seen in discharge diagnoses such as cardiovascular disease, diabetes, cerebrovascular or ischaemic heart diseases.
Individuals born 1923/24 (n = 220) were sampled in 2018–2019 at the age of 95 years. Of those, 24 (11%) individuals died prior to or during the study; nine (4%) could not be reached; three (1%) were excluded due to difficulties in understanding Swedish; one was excluded due to technical reasons. Of the remaining 183 individuals, 96 (52%) declined to participate, leaving a total of 87 participants (response rate 48%). For this cohort no information regarding sociodemographic characteristics or health in refusals was available. However, a previous study from the Gothenburg H70 Birth Cohort Studies (H70) including 95-year-olds born 1901-03, showed a similar three-year mortality rate among both participants and refusals (Börjesson-Hanson et al. Citation2004).
No reason for decline was given and no exclusion criterion other than the ability to understand Swedish was applied to either cohort.
Participants in the present study
In conjunction with the general examination, the participants were asked for their consent (yes/no) to being contacted for additional hearing examinations. Of the 301 participants born in 1930, 256 (85%) gave their consent and out of the 87 individuals born in 1923/24, 82 (94%) gave their consent. Written information regarding the hearing study was sent out followed by verbal communication prior to the examination. Consent to participate in further hearing tests was signed by the participant or a representative, if consent could not be given by the participant themselves.
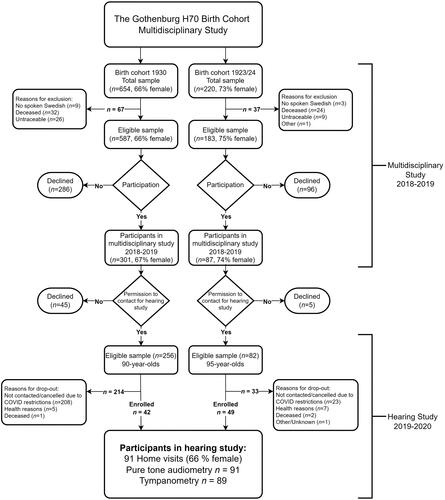
Due to the community spread of COVID-19 in March 2020, all hearing measurements were abruptly halted. Consequently, only 42 (16%) individuals out of the total sample of 256 born in 1930 were enrolled in the hearing study. In the 1923/24 age group, 49 (60%) out of the total sample of 82 were tested. The majority of participants were between the ages of 89 and 90 (median age, 89.5) or 95 years of age when their hearing was tested. For the sake of simplicity, they will be referred to as age groups 90 and 95, respectively, throughout this paper. (See for additional information).
Figure 1. Flowchart of sample process and participation.
Measurements
Pure-tone audiometry and tympanometry were conducted during a total of 91 home visits carried out between January 2019 and March 2020. A previously determined test procedure was used by the same two experienced audiologists (ÅWJ, BWB). All tests were performed with the well-being of the participant in mind. The hearing tests were preceded by a structured enquiry concerning any history of ear diseases and/or surgery, tinnitus and hyperacusis. Otoscopy was performed and signs of cerumen were registered. Participants with occluding cerumen were advised to consult a primary care provider.
Equipment
The Otometrics Aurical Aud type 1081, which was used for all pure-tone audiometric measurements, was equipped with circumaural headphones (Sennheiser HDA200), to minimise the risk of collapsing ear canal and to mitigate ambient noise. The B-81 bone conductor was used for additional bone-conduction thresholds. Maintenance and calibration were performed in accordance with ISO 8253-1 (2010): Stage A: routine checking and subjective tests were performed prior to every test session; Stage B: periodic objective checks were performed regularly according to ISO-389-8 (Citation2004) to ensure test reliability. A hand-held tympanometer (Interacoustics Titan) was used for all middle ear assessments and was checked daily using a 2 cc coupler.
Test environment
Measures were made to reduce any external disturbances whilst still prioritising the participants’ comfort. Therefore, most of the tests were performed in or near the kitchen, where a grounded electrical outlet could generally be found. A comfortable chair was moved into the kitchen if needed. Sound level measurements were performed twice before and twice after each hearing test in order to determine the ambient noise levels in dB (A) (M = 36.8, SD = 3.8). Measurements were also performed using dB (C) (M = 41.2, SD = 4.1) to control for excessive low frequency noise. In addition, a subjective control was performed by a person with normal hearing thresholds, to ascertain a 0 dB HL audibility at all test frequencies between 0.5 and 8 kHz and a 10 dB HL audibility at 0.25 kHz. In accordance with the procedure described by Margolis and Madsen (Citation2015), all air conduction (AC) hearing thresholds were compared to the maximum permissible noise levels when using ear phones of the model HDA200. Based on the outcomes of the sound level measurements in this study, it was concluded that AC hearing threshold levels below 20 dB HL, primarily in the frequencies below 1 kHz could potentially be even lower (better) due to the impact of noise levels in the test environment. Bone conduction (BC) thresholds were excluded if noise levels exceeded the maximum permissible noise levels with respect to the AC threshold level at the test frequency. For this reason, all results from bone conduction (BC) tests at 0.25 kHz were excluded from the analysis while thresholds at 0.5 kHz were considered as potentially being lower (better) in individuals with AC-thresholds lower than 20 dB HL. At all other frequencies, BC threshold measurements were considered reliable due to the severe degree of hearing loss in this age group.
Pure-tone audiometry
Audiometry was performed using the modified Hughson-Westlake ascending method in accordance with ISO 8253-1 (ISO Citation2010). Testing commenced with air conduction (AC) on the right ear at frequencies 0.25, 0.5, 1, 2, 3, 4, 6 and 8 kHz. Bone conduction (BC) was tested at frequencies 0.25, 0.5, 1, 2, 3 and 4 kHz. Contralateral masking was applied when necessary. The maximum stimulus level was set to 90 dB HL for AC stimulus and to 70 dB HL for BC stimulus (1 - 4 kHz). At 0.25 kHz and 0.5 kHz the maximum BC levels were set to 30 and 50 dB HL, respectively. If any deviation from the method had to be made (in case of dementia), the validity of the hearing threshold was critically assessed by both audiologists before it was included.
Tympanometry
Tympanometry was performed at 226 Hz with a pump speed of 400 daPa/s in a positive to negative direction. Due to the potential occurrence of cerumen, an umbrella probe tip was used for all the measurements. The tympanometric results were interpreted and documented regarding the Tympanometric Peak Pressure (TPP), Peak Compensated Static Acoustic Admittance (Peak Ytm) and Tympanometric Width (TW). The results were classified as type A (with subtypes AS and AD), B or C, as proposed by Jerger (Citation1970).
Data analysis and statistical methods
Categorisation and definitions of hearing loss
Type of hearing loss was categorised as either sensorineural or mixed (i.e. no purely conductive hearing loss was present). Mixed hearing loss was determined in accordance with Hoff et al. (Citation2020): “Air-bone-gap of ≥ 15 dB at 3 consecutive frequencies, and/or at least 20 dB at any frequency, in combination with either otoscopy, tympanometry or patient history that support a middle ear pathology.” Tympanometry was regarded as pathological with type B, as defined by Steiger (Citation2005): abnormally low Peak Ytm (< 0.03 mmho) and a TW greater than published normative data (TW > 134 daPa (Shahnaz and Polka Citation1997)). Type C indicated a negative pressure in the middle ear (TPP < -100 daPa). Type A was seen as consistent with a normal middle ear system (Peak Ytm > 0.03 mmho) with subtypes AD (Peak Ytm > 1.7 mmho) and AS (Peak Ytm < 0.03 mmho) indicating an abnormally flaccid versus stiff compliance.
Six degrees of hearing loss were used based on the four-frequency pure-tone average, PTA4 (0.5, 1, 2, 4 kHz) in the better ear, presented in dB HL: mild (20 to < 35), moderate (35 to < 50), moderately severe (50 to < 65), severe (65 to < 80), profound (80 to < 95) and complete or total hearing loss/deafness (≥ 95). These definitions are consistent with those of the World Health Organization (Citation2021). Pure-tone audiometry is not recommended as the sole determinant of potential limitation of activity or participation. However, a hearing loss of a moderate degree or worse, in the better ear, is often assessed as ‘disabling’ and will be used in this paper (Olusanya, Davis, and Hoffman Citation2019).
In addition to PTA4, pure tone averages for low and mid frequencies; PTA3 (0.5, 1, 2 kHz) and for high frequencies; PTAHF (3, 4, 6 kHz) were used for comparing right and left ear averages.
Asymmetrical hearing loss was defined and reported using two separate sets of criteria: (1) a difference of ≥ 15 dB between right and left AC thresholds for the PTA of 0.5, 1, 2, 3 kHz and/or ≥ 25 dB at two contiguous frequencies (Steiger Citation2005), and (2) a strict asymmetrical sensorineural hearing loss assessment, where the right and left BC- thresholds differed by > 10 dB at two or more frequencies between 0.5 and 4 kHz.
Statistical methods
To address the study aims, i.e. to advance our understanding of hearing ability in the nonagenarian age group, we performed a number of analyses. First we looked at the total sample (90- and 95-year-olds combined) reporting the degree and type of hearing loss in the right and left ear separately. The aim was to provide information on hearing ability in an unselected sample of individuals in this age group. Additionally, to assess the potential rehabilitative needs of this demographic, we also reported on the degree of hearing loss in the better ear, in accordance with Olusanya, Davis, and Hoffman (Citation2019).
Secondly, we analysed whether there were any differences in hearing thresholds between the age groups. Medians and quartiles of pure-tone thresholds were interpolated based on the frequency of occurrences above or below the nearest 5-dB step. The 10th and 90th percentiles were excluded to avoid misleading analysis due to excessive noise levels and maximum stimulus set at 90 dB HL. Non-responses at the maximum stimulus level (90 dB HL) were given an arbitrary value of 95 dB HL. Results were presented in audiogram-like formats to graphically demonstrate hearing thresholds for test frequencies between 0.25 and 8 kHz. Due to small sample sizes, statistical analysis between the two age groups was limited to comparisons of left and right ear pure tone averages. The Mann Whitney U test was used due to the potential skewness in hearing threshold distribution as well as small sample sizes. The statistical significance level was set to .008 to account for multiple comparisons. Lastly, we also made comparisons between the females and males in the sample to identify any difference between the sexes. Differences between sexes were limited to comparisons of audiogram-shape.
Information on sociodemographic variables in 2019 regarding participants, drop-outs, and same-aged individuals in Gothenburg Municipality and in Sweden generally, was received on an aggregated level from Statistics Sweden. The Pearson Chi-squared test was used to compare the characteristics of the participants and dropouts recruited to the study. The levels of statistical significance were adjusted using the Bonferroni method for multiple comparisons. Furthermore, we conducted comparisons of the participants with same-aged individuals in Gothenburg Municipality, as well as in Sweden as a whole. When fewer than four participants were present in a variable, no comparison could be performed due to the protection of anonymity. A 95% confidence interval for the study participants was estimated using the Wald Interval for Proportions.
All statistical analyses were performed using IBM SPSS, Version 25.
Participants’ characteristics
As shown in , there were no significant differences between participants and dropouts regarding several of the sociodemographic characteristics (where such a statistical comparison was possible). Significantly higher education levels were noted for the participants of the study compared to same-aged individuals in Gothenburg Municipality (Χ2 [df 2] = p < .01) as well as the population of Sweden (Χ2 [df 2] = p < .01) using the Chi-squared test. The proportions of the study participants and same-aged individuals living in Gothenburg and Sweden regarding, sex, ethnicity, housing or marital status were similar ( and Appendix A).
Figure 2. Comparison between participants, drop-outs and same-aged individuals in Gothenburg Municipality and in Sweden overall. Proportions and 95% confidence intervals (Wald intervals for proportions) for study participants regarding: sex, education level, ethnicity and housing. The same characteristics are presented with the proportions for the groups of drop-outs as well as same-aged individuals in Gothenburg Municipality and the population of Sweden. All of the variables are on an aggregated level from Statistics Sweden (SCB). Missing values for drop-outs in the 95-year-olds are due to the number of persons in that category is ≤ 3. * In 90-year-olds no confidence interval regarding special housing could be assessed due to the low number of participants in that group.
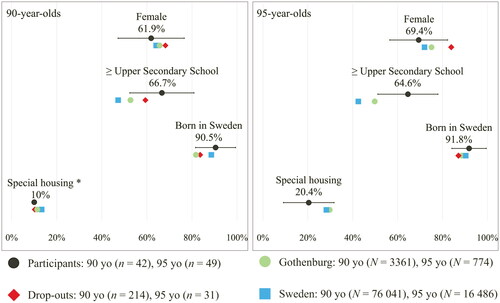
Table 1. Presentation and comparison of sociodemographic characteristics of participants and dropouts among 90- and 95-year-olds recruited to the current study.
Results
Description of degree, type, and prevalence of hearing loss
All tests (n = 91) were performed in accordance with the standardised method except for two cases where observational audiometry was used due to cognitive impairment and only a few frequencies were included in the results. All of the participants but two (98%; 95% CI [95, 100]) had some degree of hearing loss in their better ear. Moreover, a majority (83%; 95% CI [75, 91]) had a degree of hearing loss that was assessed as moderate or worse. When stratifying by age group, the older participants had a more severe degree of hearing loss ().
Table 2. Prevalence rates of hearing loss degree in the study participants.
The type of hearing loss was sensorineural in 89% of participants’ right and/or left ears, 7% of the right and 3% of the left ears were of a mixed type, none had a purely conductive hearing loss on either ear. A majority (63%) had a type-A tympanogram, indicating a normal middle ear function with no significant difference between the right and left ear. All the results are presented in detail in .
Table 3. Prevalence rates of type of hearing loss, tympanometric types, occurrence of cerumen and right-left asymmetry in the study participants.
Median hearing thresholds and pure tone averages in and between age groups and sexes
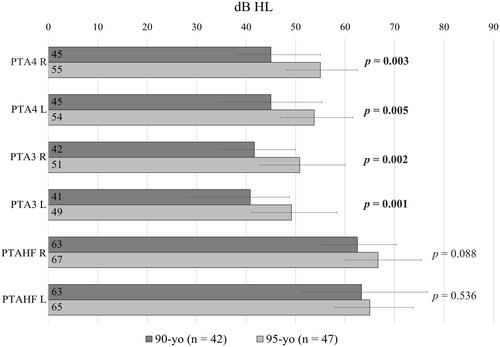
As seen in , the audiogram configuration indicates a difference in median thresholds between the two age groups at frequencies below 2 kHz in both ears, but not at higher frequencies. The statistical analysis was limited to comparing pure tone averages in the lower and higher frequency ranges, as well as PTA4, between the two age groups. Non-parametric tests showed significantly higher (worse) PTA4 and low frequency PTA3 binaurally in the 95-year-olds. This difference was not seen in the higher frequencies when comparing PTAHF between the two age groups in either ear ().
Figure 3. Interpolated median hearing thresholds and quartile ranges by age groups (females and males combined).
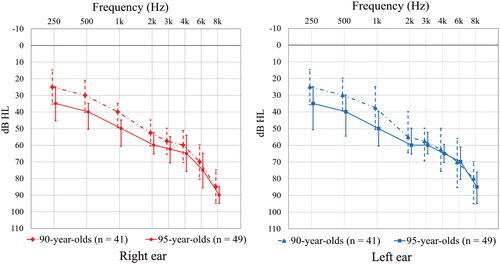
Figure 4. Comparisons of pure-tone averages (PTA) for the right (R) and left (L) ear between the 90-year- and 95-year-olds using PTA4 (0.5, 1, 2, 4 kHz), PTA3 (0.5, 1, 2 kHz) and PTAHF (3, 4, 6 kHz). Median PTA for each group is presented in dB HL in their respective bar. The error bars represent the 25th and 75th quantiles of the respective variable, where the length of the interval equals the interquartile range. The Mann-Whitney U-test indicated a significantly higher average in the older age group for PTA4 and PTA3 (values in bolds). This was not seen for the high frequency PTA. The significance level was set to 0.008 to account for multiple comparisons (six independent comparisons).
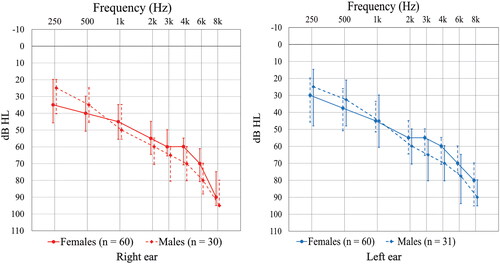
Furthermore – as seen in – comparing all female and male participants, the audiogram configuration indicates that the females had worse hearing < 1 kHz; however, for the frequencies ≥ 3 kHz the median thresholds among the female participants seem better than among the male participants.
Figure 5. Interpolated median hearing thresholds with quartile ranges by sex (age groups combined).
Hearing loss asymmetry
Asymmetric hearing loss was found in 13% of the participants when comparing the AC thresholds in the right and left ears in accordance with the definition of Steiger (Citation2005). Strictly sensorineural asymmetry (based on BC thresholds) was found in 4% of the participants. However, in 11 participants sensorineural asymmetry could not be defined due to unclear middle ear status owing to the presence of cerumen, or to missing or unmasked BC thresholds. See for detailed information.
Discussion
Our results indicate that hearing loss affects virtually everyone at the age of 90 years and older. Furthermore, 8 out of 10 of individuals in this age group have a hearing loss of moderate degree or worse, potentially limiting their activities and their ability to hear speech, both in quiet as well as in noisy environments. It is important to note that measuring pure-tone thresholds alone may not provide a complete view of how an individual perceives their hearing loss. However, there is a high prevalence of cognitive impairment in the nonagenarian age group, which potentially limits the feasibility of speech audiometry and other subjective measurements.
In this study, we took many steps to ensure participation, considering the high prevalence of cognitive, functional and/or sensory impairment in this age group. This is discussed in detail in the section on strengths and limitations. Therefore, this reference data on hearing thresholds from an unscreened sample is a valuable addition to our understanding of hearing health in this age group.
Hearing in the nonagenarian years
Age-related hearing loss is known to be progressive, but whether it continues to progress into very high age or whether it slows down has been up for debate. We noted a difference in hearing ability when comparing individuals aged 90 and 95 years. For instance, in the “younger” age group (90 years old), we found that the majority had a moderate degree of hearing loss in their better ear, whereas of those in the older age group (95 years old) a majority had a moderately severe degree of hearing loss. These findings may imply that hearing continues to decline after the age of 90, but more slowly than reported in those who have not reached the 9th decade of life (Gates and Cooper Citation1991; Wiley et al. Citation2008).
Wattamwar et al. (Citation2017) concluded that the rate of hearing loss increased in the 10th decade compared to the 9th decade of life. However, their results were based on medical records from patients referred for audiological evaluation, constituting a potential ascertainment bias, whereas the participants of our study were sampled from the general population. Still, the severity of and differences in hearing ability between age groups that was found in our study are consistent with theirs, thus strengthening the concept of the progressiveness of ARHL even in advanced age. Furthermore, our results are in agreement with those of Wattamwar et al. (Citation2017) and Gates and Cooper (Citation1991) that hearing decline is predominantly seen in the lower frequencies below 2 kHz. We observed a significant increase in the pure-tone averages PTA4 and PTA3, between the 90- and 95-year-old age groups. This was not the case in the pure tone averages for the higher frequencies where only minor differences were found in the thresholds of the two age groups. The results presented by Gates and Cooper (Citation1991) consist mostly of participants younger than 90 years of age, yet their results line up with ours. In the extensive longitudinal cohort study on hearing loss progression presented by Wiley et al. (Citation2008), similar results were presented. Their estimates of threshold changes in older adults over a 10-year period showed the same increase of low-frequency hearing loss. Thus, the trend of hearing loss progression in people of advanced age seems to be consistent across studies.
Interestingly, results from previous cohorts in the H70 study presented by Jönsson and Rosenhall (Citation1998) also showed a similar decline in the lower frequencies before the age of 90. However, they found only a limited hearing decline in females between ages 85 and 90, but no decline in males during the same period. In contrast to our findings, they hypothesised that hearing-loss progression slows down in and after the 9th decade of life. However, in their study, all tests were performed in a research clinic, possibly excluding those who were housebound or had cognitive impairments, which could explain the diverse results.
Hearing loss difference between females and males in the nonagenarian years
A gender-reversal phenomenon in ARHL has been registered and discussed in many studies with a hearing loss principally associated with high-frequency hearing loss that is more severe in males (Corso Citation1959; Jerger et al. Citation1993). Yet, there is less known about the difference in hearing between females and males of a more advanced age. The studies of Wattamwar et al. (Citation2017) and Wiley et al. (Citation2008) suggest that sex plays a less-important role in hearing ability in the 9th and 10th decades of life. In previous hearing studies within the H70 Birth Cohort Studies a gender-reversal pattern was noted for 70-year-old participants (Hoff et al. Citation2020) as well as in 85-year-olds (Göthberg et al. Citation2019). In the present study we also note the same pattern, but to a lesser extent. Owing to this, we hypothesise that hearing loss does vary with sex and frequency in the nonagenarian age range but seems to level out towards a more flat loss pattern over all the frequencies and possibly a more negligible difference between the sexes. One theory put forward by several authors is that as people enter the 10th decade of life, their hearing loss has already reached such a degree that it leaves limited room for further progression in higher frequencies. This ceiling effect is especially true for males (Gates and Cooper Citation1991; Wattamwar et al. Citation2017; Wiley et al. Citation2008). However, the sex ratio in older age groups differs greatly from younger age groups, making it difficult to determine the reason for the progression of hearing loss in females aligning with that in males after 90 years of age. Since hearing loss may also be associated with frailty, there is a possibility that research involving nonagenarians mostly include males with exceptionally good health and hearing ability, i.e. those who have survived.
Is Asymmetric hearing loss common among nonagenarians?
Asymmetric hearing loss has been reported as being common in nonagenarians by Leskowitz et al. (Citation2016) as well as by Wattamwar et al. (Citation2017). In contrast, we found a low prevalence of right–left ear asymmetry when assessing air-conduction as well as bone-conduction thresholds (AC = 11% and BC = 3%). As of yet, there is no standard definition of hearing loss asymmetry nor consensus on whether bone- or air-conduction thresholds should be used (Margolis and Saly Citation2008). Consequently, comparisons between studies can be misleading if different definitions are used. We could find no information on the scope or the definition of asymmetric hearing loss in the study of Wattamwar et al. (Citation2017), only that it was common. In the study by Leskowitz et al. (Citation2016) it was reported that at least one-third of persons aged 95 and older had an asymmetric pure-tone average (AC thresholds); however, it was not clearly specified which definition was used. Nevertheless, their result conflicts with ours, in which asymmetric hearing loss was uncommon using both AC and BC thresholds. However, their study focused on ambulatory patients in a clinic, which could explain the difference in results.
Strengths and limitations of this study
One important limitation of this study is the high dropout rate in the 90-year-old age group. This was a result of the unforeseeable outbreak of the COVID-19 pandemic in 2020, which abruptly halted data collection. This constitutes a potential participation bias, as many eligible individuals were not tested. To estimate the representativeness of the sample, measures were taken to compare study participants to the target population (Gothenburg Municipality) and to Sweden as a whole ( and Appendix A). There was no indication that the participants differed from these populations regarding sex, ethnicity or marital status. The educational level was higher in our sample compared to the general population, a difference that is in line with other population-based studies (Wetterberg et al. Citation2022). Importantly, we found no significant differences between the study participants and the dropouts in either age group, indicating that the halted enrolment did not lead to any systematic participation bias.
Even so, research conducted on persons of advanced age is challenging due to the diversity of physical and mental health in this population. There is a well-known risk of potential bias due to the “healthy volunteer effect” where refusals have a higher burden of disease than do participants. One major challenge is the high prevalence of dementia, which requires unique methodological considerations to balance the risk of high dropout rates with maintaining test reliability. In this study, we took many measures to encourage participation and made no exclusions as long as consent was given by the participant. If participants could not give consent themselves (due to severe dementia) it was given by a representative – in most cases a family member. Researchers had no prior information on the participants’ physical and/or cognitive health. Due to this, all tests were conducted in the participants’ home setting, which included nursing homes and care facilities, to minimise the dropout rate. However, it is likely that individuals with severe dementia were not included in this study. Detailed information on the participants’ cognitive and physical health was outside the scope of this study but this aspect will be addressed in future research. To minimise participant burden, a family member or other trusted companion was invited during the recruitment process and testing. Information about the study was given both verbally and in writing, in advance. Adequate time was planned for each home visit, taking into consideration the varying physical and mental capacities of the participants.
Conducting tests outside of a controlled test environment potentially entails limitations. For instance, in this study as many as 30% had cerumen in one or both ears, making a visual assessment of the eardrum impossible. With the research being conducted outside of a clinical environment, no measures to have it removed were possible. However, an assessment of hearing loss type could still be made in most cases using otoscopy, audiometric AC and BC thresholds along with tympanometric results. Some technical issues were encountered but most of these could be resolved during the visit. Noise levels were carefully monitored during tests and were accounted for in the analysis of hearing thresholds. However, in this age group noise levels did not constitute a problem considering that nearly all of the participants had some degree of hearing loss. Standardised pure-tone audiometry including both AC and BC thresholds was therefore judged to be feasible in a home setting.
Lastly, we are aware of the limitation of generalisability in a study sampled from a predominantly socioeconomically advantaged population in a developed country. Our hope is to see further studies that include persons of advanced age in low- and middle-income countries. The need for world-wide hearing healthcare in all age groups is crucial and our knowledge of hearing health in the oldest old from a global perspective is extremely limited.
Conclusions and wider implications
Hearing loss has a potentially negative impact on verbal communication, quality of life and both physical and mental health, and is – globally – the leading cause of years lived with disability (YLD) in persons over the age of 70 years. This study confirms earlier research showing that hearing loss is highly prevalent and progressive among nonagenarians. Amongst our participants all but two had some degree of hearing loss and a vast majority (83%) had a potentially disabling hearing loss. This underlines the need for rehabilitative actions and an elevated awareness of the potentially negative impacts of untreated hearing loss to enhance the overall well-being of the oldest-old population.
We suggest that healthcare workers should be encouraged to frequently ask questions regarding hearing health and to regularly perform otoscopic examinations to exclude the presence of occluding ear wax. Furthermore, audiologists need to adapt their work in consideration of the diverse mental and physical health of those belonging to this age group. Finally, this study has also shown that standardised pure-tone audiometry is a feasible method to use in a home setting for this population, which encourages diagnostic and rehabilitative measures outside the clinic. However, considering the high prevalence of dementia in this age group, future research is needed to add objective hearing tests that are feasible outside the clinical environment to the audiological test battery. We aim to contribute to this in upcoming studies, as well as regarding the rehabilitative needs for those in the nonagenarian age group.
Ethical approval
Ethical approvals for this study were granted by the Swedish Ethical Review Authority (Ref. No.: 278-18 and 843-18).
Author contributions
All authors contributed to the design and/or data collection in this study. Furthermore, all were involved in the development and final approval of this manuscript.
| Abbreviations | ||
| ARHL | = | Age-related hearing loss |
| PTA | = | Pure-tone average |
| PTA3 | = | Pure-tone average for frequencies 0.5, 1 and 2 kHz |
| PTA4 | = | Pure-tone average for frequencies 0.5, 1, 2 and 4 kHz |
| PTAHF | = | Pure-tone average for frequencies 3, 4 and 6 kHz |
Supplemental Material
Download MS Word (28.8 KB)Acknowledgements
The authors would like to thank all of the participants in the H70 studies in Gothenburg and the research group members for their cooperation in data collection and management. We would also like to thank Inger Wikström for her invaluable work during the recruitment and administrative process, and Tomas Tengstrand, Kjell-Erik Israelsson and Andreas Björsne for their technical guidance.
Disclosure statement
No potential conflict of interest was reported by the author(s).
Data availability statement
All data and analyses generated during the current study are available from the corresponding author on reasonable request.
Additional information
Funding
References
- Börjesson-Hanson, A., E. Edin, T. Gislason, and I. Skoog. 2004. “The prevalence of dementia in 95 year olds.” Neurology 63 (12):2436–2438. https://doi.org/10.1212/01.wnl.0000147260.52841.27.
- Christensen, K., G. Doblhammer, R. Rau, and J. W. Vaupel. 2009. “Ageing populations: the challenges ahead.” Lancet (London, England)374 (9696):1196–1208. https://doi.org/10.1016/S0140-6736(09)61460-4.
- Corso, J. F. 1959. “Age and sex differences in pure-tone thresholds.” The Journal of the Acoustical Society of America 31 (4):498–507. https://doi.org/10.1121/1.1907742.
- Cunningham, L. L., and D. L. Tucci. 2017. “Hearing Loss in Adults.” The New England Journal of Medicine 377 (25):2465–2473. https://doi.org/10.1056/NEJMra1616601.
- García-Peñ C., Gutiérrez-Robledo, L. M., & Pérez-Zepeda, M. U. (2018) (Eds.). 2018. Aging Research - Methodological Issues (2nd ed. 2018). Springer International Publishing AG. https://doi.org/10.1007/978-3-319-95387-8.
- Gates, G. A., and J. C. Cooper. 1991. “Incidence of hearing decline in the elderly.” Acta Oto-Laryngologica 111 (2):240–248. https://doi.org/10.3109/00016489109137382.
- Göthberg, H., U. Rosenhall, T. Tengstrand, L. Rydén, H. Wetterberg, I. Skoog, and A. Sadeghi. 2021. “Prevalence of hearing loss and need for aural rehabilitation in 85-year-olds: a birth cohort comparison, almost three decades apart.” International Journal of Audiology 60 (7):539–548. https://doi.org/10.1080/14992027.2020.1734878.
- Göthberg, H., U. Rosenhall, T. Tengstrand, T. Rydberg Sterner, H. Wetterberg, A. Zettergren, I. Skoog, and A. Sadeghi. 2019. “Cross-sectional assessment of hearing acuity of an unscreened 85-year-old cohort - Including a 10-year longitudinal study of a sub-sample.” Hearing Research 382:107797. https://doi.org/10.1016/j.heares.2019.107797.
- Hoff, M., T. Tengstrand, A. Sadeghi, I. Skoog, and U. Rosenhall. 2020. “Auditory function and prevalence of specific ear and hearing related pathologies in the general population at age 70.” International Journal of Audiology 59 (9):682–693. https://doi.org/10.1080/14992027.2020.1731766.
- International Organisation for Standardization (ISO). 2004. Acoustics-Reference Zero for the Calibration of Audiometric Equipment. Part 8: Reference Equivalent Threshold Sound Pressure Levels for Pure-Tones and Circum-Aural Earphones. (ISO Standard No. 389-8). Geneva, Switzerland: ISO.
- International Organization for Standardization (ISO) 2010. Acoustics - Audiometric test methods - Part 1: Pure-tone air and bone conduction audiometry (ISO Standard No. 8253-1). Geneva: ISO.
- Jerger, J. 1970. “Clinical Experience With Impedance Audiometry.” Archives of Otolaryngology (Chicago, Ill.: 1960)92 (4):311–324. https://doi.org/10.1001/archotol.1970.04310040005002.
- Jerger, J., R. Chmiel, B. Stach, and M. Spretnjak. 1993. “Gender affects audiometric shape in presbyacusis.” Journal of the American Academy of Audiology 4 (1):42–49.
- Jönsson, R., and U. Rosenhall. 1998. “Hearing in advanced age. A study of presbyacusis in 85-, 88- and 90-year-old people.” Audiology: official Organ of the International Society of Audiology 37 (4):207–218. https://doi.org/10.3109/00206099809072975.
- Leskowitz, M. J., F. F. Caruana, B. Siedlecki, Z. J. Qian, J. B. Spitzer, and A. K. Lalwani. 2016. “Asymmetric hearing loss is common and benign in patients aged 95 years and older.” The Laryngoscope 126 (7):1630–1632. https://doi.org/10.1002/lary.25503.
- Margolis, R. H., and G. L. Saly. 2008. “Asymmetric Hearing Loss: Definition, Validation, and Prevalence.” Otology & Neurotology: official Publication of the American Otological Society, American Neurotology Society [and] European Academy of Otology and Neurotology 29 (4):422–431. https://doi.org/10.1097/MAO.0b013e31816c7c09.
- Margolis, R. H., and B. Madsen. 2015. “The acoustic test environment for hearing testing.” Journal of the American Academy of Audiology 26 (9):784–791. https://doi.org/10.3766/jaaa.14072.
- Olusanya, B. O., A. C. Davis, and H. J. Hoffman. 2019. “Hearing loss grades and the International classification of functioning, disability and health.” Bulletin of the World Health Organization 97 (10):725–728. https://doi.org/10.2471/BLT.19.230367.
- Rydberg Sterner, T., F. Ahlner, K. Blennow, S. Dahlin-Ivanoff, H. Falk, L. Havstam Johansson, M. Hoff, M. Holm, H. Hörder, T. Jacobsson, et al. 2019. “The Gothenburg H70 Birth cohort study 2014–16: design, methods and study population.” European Journal of Epidemiology 34 (2):191–209. https://doi.org/10.1007/s10654-018-0459-8.
- Shahnaz, N., and L. Polka. 1997. “Standard and Multifrequency Tympanometry in Normal and Otosclerotic Ears.” Ear and Hearing 18 (4):326–341. https://doi.org/10.1097/00003446-199708000-00007.
- Statistics Sweden. 2022. “The future population of Sweden 2022–2070.” Demographic Reports 2022:4.
- Steiger, J. R. 2005. “Audiologic referral criteria: Sample clinic guidelines.” The Hearing Journal 58 (5):38. 39,42. https://doi.org/10.1097/01.HJ.0000287174.23086.36.
- Wattamwar, K., Z. J. Qian, J. Otter, M. J. Leskowitz, F. F. Caruana, B. Siedlecki, J. B. Spitzer, and A. K. Lalwani. 2017. “Increases in the rate of age-related hearing loss in the older old.” JAMA Otolaryngology- Head & Neck Surgery 143 (1):41–45. https://doi.org/10.1001/jamaoto.2016.2661.
- Wetterberg, H., L. Rydén, F. Ahlner, H. Falk Erhag, P. Gudmundsson, X. Guo, E. Joas, L. Johansson, S. Kern, M. Mellqvist Fässberg, et al. 2022. “Representativeness in population-based studies of older adults: five waves of cross-sectional examinations in the Gothenburg H70 Birth Cohort Study.” BMJ Open 12 (12):e068165. https://doi.org/10.1136/bmjopen-2022-068165.
- Wiley, T. L., R. Chappell, L. Carmichael, D. M. Nondahl, and K. J. Cruickshanks. 2008. “Changes in hearing thresholds over 10 years in older adults.” Journal of the American Academy of Audiology 19 (4):281–292; quiz 371. https://doi.org/10.3766/jaaa.19.4.2.
- World Health Organization 2021. World report on hearing. WHO.