
Abstract
Objective
To explore the feasibility of remote diagnostic hearing testing within schools, for school-entry aged children (4–7 years).
Design
A prospective cross-sectional comparative study design was used to establish the reliability of remote hearing assessment by comparing traditional face-to-face pure tone audiometry (PTA) with remote PTA, traditional otoscopy with remote video otoscopy and interpretation of tympanograms in-person with remote analysis.
Study Sample
464 school-entry year level children from 18 schools.
Results
Air conduction thresholds established by remote testing were within a clinically acceptable range of ±10 dB HL from traditional thresholds in 98% of cases at 1 kHz and 97.8% at 4 kHz. Bone conduction thresholds varied by ≤10 dB HL in 100% of cases at 1 kHz and 95.7% at 4 kHz. Remote otoscopy and tympanometry interpretation had 78.6% agreement (moderate; κ = 0.6) and 92.2% agreement (almost perfect; κ = 0.9), respectively.
Conclusions
We found there to be good reliability between face-to-face PTA and remote PTA performed within the school environment. Furthermore, assessment of the outer and middle ear via video otoscopy and remote tympanometry classification were both viable. Remote diagnostic hearing tests in schools can extend reach of paediatric services in rural areas.
Introduction
Hearing loss (HL) in childhood can impact learning, speech and language development and quality of life in the crucial early years of schooling (Lieu et al. Citation2020). While most children with congenital HL in countries that offer universal newborn hearing screenings (UNHSs) are identified soon after birth, a proportion of children in countries that do not offer such testing will go undiagnosed in the critical early developmental period. A large body of literature indicates that early identification and intervention (by 6 months of age) leads to better outcomes with social adjustment, behaviour, articulation and other school-related measures (Joint Committee on Infant Hearing Citation2019). Furthermore, research supports the implementation of UNHS across all low-, middle-, and high-income countries to prevent late diagnosis and the adverse effects of this (Edmond et al. Citation2022).
Additionally, children who receive and pass UNHS testing may later present with significant HL (Fitzgibbons et al. Citation2023). Permanent-type sensory HLs can be present from birth yet evade detection by UNHS, as these programs generally aim to capture bilateral HL of mild/moderate (or greater) degree (Joint Committee on Infant Hearing Citation2019). Mild congenital HLs that are not severe enough to be identified by UNHS can remain undetected for many years. Such untreated HL (although mild) are likely to have diverse developmental impacts (Cone et al. Citation2010). Furthermore, progressive sensory loss may not present at birth and may worsen over time, causing difficulties with communication and learning (Lieu et al. Citation2020). Acquired type HLs (from trauma, infections, ototoxic medications or autoimmune origins) are typically not present at the newborn period and may also remain undiagnosed well into childhood (Lieu et al. Citation2020). Newborn hearing screening will only identify fluctuating conductive hearing losses (CHLs) if present at time of screening. Such losses are common throughout childhood and can affect behaviour and listening in classroom environments (Lieu et al. Citation2020). CHL can also lead to the development of spatial processing disorder (where an individual has difficulty localising sound sources and, as a result, understanding speech in noisy environments) which also impacts the ability to succeed in the school environment (Tomlin and Rance Citation2014).
As both sensory and CHL may evade detection past the newborn period, access to timely diagnostic audiology in childhood is key. This ensures appropriate intervention options may be offered to ameliorate any negatively associated educational outcomes (World Health Organization, 2016). Identification of HL in the early schooling years (i.e. ages 4–9) is important, as evidence suggests that fluctuating CHL across this period can impact academic progress and behavioural and cognitive development well into adolescence (Bennett et al. Citation2001). A strategy for the prevention and care of childhood HL recommended by the World Health Organization (2016) is the implementation of school-based hearing screenings. This strategy is a practical option for detecting HL in childhood as many children can be tested as part of their daily activities—therefore avoiding reliance on parental action to seek out audiological assessment. This is the same reason that UNHS programs are effective—a “captive” population (i.e., while babies are inpatients) can be tested in an efficient manner and without specific referral.
While school hearing screenings aim to identify children who require diagnostic audiology services, follow up relies on access to Audiologists. This can be problematic in certain locales where there are large distances from communities to diagnostic Audiology centres. Literature exploring Audiology service accessibility in rural Australia, Canada and the United States has revealed limited availability of paediatric services, less satisfaction with services that did exist compared to urban counterparts, and greater costs for rural living families when it came to accessing Audiological care (Barr, Dally, and Duncan Citation2019, Citation2020). These findings indicate that a rethink of service provision for rural communities is needed. One approach to improving service accessibility for patients and their families is tele-audiology, which aims to provide hearing services to individuals by utilising internet connectivity and technology. While tele-audiology has become more widespread in recent years—especially with advancement in automated hearing test technologies—there remains a need for further research into effectiveness of tele-audiology in the school setting. Most of the literature in this space to date has focused on mobile screening technologies, rather than diagnostic applications (Bowers, Graydon, and Rance Citation2022; Bright and Pallawela Citation2016; Mealings et al. Citation2020). The most efficient way to follow up a screen referral would be the immediate completion of a remote diagnostic assessment. Given it is widely established that timely and appropriate diagnostic assessment is key to a hearing screening programs’ efficacy (World Health Organization, 2016), remote diagnostic assessments may be able to improve access to otological care for rural/remote populations. That is, by uncovering more detail about an individual’s hearing status (exact hearing levels and type of HL, if any), better triaging for medical management can occur. For example, a remote diagnostic assessment may uncover the extent of middle ear disease allowing more severe cases to be prioritised by medical specialists. With only a screen “refer”, all individuals may be triaged in the same way, delaying care for those more in need. Remote populations are often the most susceptible to ear disease; rural living Indigenous Australian children, for example, are known to be at high risk of middle ear disease and as many as 9 in 10 have an episode of otitis media (OM) in the early few years of life (Morris et al. Citation2005). Otitis media left untreated has the potential to persist, cause temporary and permanent HL and lead to serious consequences for the development of language, cognition, and psychosocial skills. Furthermore, severe medical complications such as mastoiditis and meningitis are possible without provision of treatment (Monasta et al. Citation2012).
Otoscopy and tympanometry are key in the diagnosis of middle ear disease in the paediatric population, so timely management can occur (Leach et al. Citation2021). While in-person assessment with a traditional otoscope allows for this, video otoscopy may afford remote visualisation of the ear canal (EC) and tympanic membrane (TM) to assist a clinician with diagnosis from afar. A systematic review of remote otological assessment using video otoscopy found very high agreement between a traditional assessment and remote video-otoscope assessment (Metcalfe et al. Citation2021). Both tympanometry and video-otoscopy require an individual to be trained on correct technique and awareness of contraindications for performing each, with Audiologists typically performing these tests. Tympanometry and video-otoscopy may be able to be performed remotely by a person trained to perform these tasks, but together they still cannot determine the presence or absence of a HL. To establish a comprehensive picture of an individual’s hearing status an assessment should also include pure-tone audiometry (PTA), which is the gold-standard for hearing threshold determination (Vogel et al. Citation2007). While performing PTA also requires specific training and expertise, the ability to perform this diagnostic assessment remotely may overcome the barrier of Audiologists needing to be physically present with the patient, thus improving service accessibility. Some reviews of literature focusing on the reliability of remote PTA when compared to traditional in-person PTA suggest good concordance between the two methods (D'Onofrio and Zeng Citation2022). However, when it comes to using remote PTA in young children, research is limited and mixed. Studies have mostly focused on PTA as a screening method rather than a diagnostic tool and while some findings suggest remote testing to be reliable, others have found higher failure rates with remote techniques compared with traditional testing (D'Onofrio and Zeng Citation2022; Govender and Mars Citation2017). There is also a lack of guidelines globally when it comes to the use of remote technologies for hearing level determination.
The global COVID-19 pandemic beginning 2020 encouraged rapid development of tele-audiology processes and protocols (D'Onofrio and Zeng Citation2022). Although many hearing providers acted quickly to further their tele-audiology practices, there remains a need to understand how such programs are implemented, the quality of the services on offer, and the challenges to their uptake (D'Onofrio and Zeng Citation2022). Some evidence suggests good client acceptance and satisfaction with tele-audiology, however, the application and perception of paediatric services are not well established (Chong-White et al. Citation2023).
The aim of this study was to explore the feasibility of remote diagnostic hearing testing for school-entry-aged children (4–7 years) within the school environment. We aimed to establish the reliability of a remote testing protocol by comparing traditional face-to-face PTA with remote PTA, traditional otoscopy with remote video otoscopy, and finally interpretation of tympanograms in-person with remote photographic interpretation.
Materials and methods
Ethics
This study carries approval from the University of Melbourne Human Research Ethics Committee (193825.1). Informed written consent from parents/guardians and verbal assent from each child was obtained for all participants.
Participants
An opportunistic sampling strategy was employed for this study, whereby schools within the state of Victoria were invited (through the Department of Education) to participate in this project, with the aim of recruiting a broad range of metropolitan and rural/remote sites. Regions were defined in accordance with the Victorian State Government’s regions outline (Victorian State Government Department of Jobs Precincts and Regions Citation2022). Once schools agreed to take part, children attending these schools in entry year level were invited to participate (typical age of school commencement in our locale being 4–6 years of age).
Procedure
Testing occurred between April 2022 and June 2023. Children were assessed within school grounds, in a quiet location such as an empty administrative space or classroom. Background noise levels were generally stable, but audiometric stimulus presentation was repeated if the facilitating audiologist considered that there was a transient noise level increase.
Each child was evaluated twice. For the “test” group (N = 436) this involved a traditional face-to-face assessment and an equivalent remote assessment. The order of face-to-face and remote assessments was randomised across the group to minimise any carryover effects. A “control” group (N = 28) underwent two face-to-face assessments. This cohort was included to establish the repeatability of audiometric findings obtained in two separate sessions carried out (using the standard clinical configuration) on the same day. Both assessments for each sample group were typically performed directly after one another, however on some occasions one may have been carried out on a subsequent school day given time limitations. The longest time difference between two assessments was two school days. Each assessment was undertaken by two different Audiologists, blinded to the results of the other test.
Traditional face-to-face assessment occurred with the child and facilitating Audiologist in the same room. The facilitating Audiologist would condition and test the child using manual PTA with clinical standard modified Hughson-Westlake technique to obtain their hearing thresholds. The Audiologist would use standard instructions to ensure the child was well conditioned to the audiometric tasks. In some cases (<10) PTA testing was modified as the Audiologist saw fit, to include increased encouragement and engagement to ensure the child maintained conditioning. Following PTA, otoscopy was used to assess the integrity of the TM and tympanometry to assess middle ear function. Air-conduction (AC) threshold seeking was performed at 0.5, 1, 2, and 4 kHz in both ears, down to a minimum level within the normal hearing range (≤15 dB HL). Bone-conduction (BC) was performed at relevant frequencies when AC thresholds were >20dBHL.
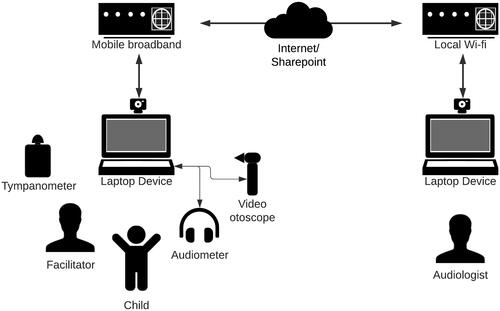
Remote testing occurred via a hybrid telehealth model, represented in . To initiate the remote assessment, the remote Audiologist would appear on the laptop screen via videoconference, using Zoom Video Communications, Inc. software. They would introduce themselves to the child seated in front of the computer. The facilitating audiologist (in the room with the child) would share the laptop screen and allow remote control by the remote Audiologist. The remote Audiologist would then condition the child to the audiometric task, by verbal instruction and visual demonstration. The facilitator would ensure that stimulus presentation levels and threshold information would not be visible to either the audiologist or the child. The facilitating Audiologist would put on or take off equipment (headphones, bone conductor) as requested by the remote tester and assist with performing video otoscopy and tympanometry when instructed by the remote tester. Assessments included establishing hearing thresholds via PTA (following the exact procedure described previously for traditional assessment) and assessing the integrity of the TM with video otoscopy. Air-conduction threshold seeking was performed at 1 kHz and 4 kHz in both ears, down to a minimum level within the normal hearing range (≤ 15 dB HL). As both the face-to-face and remote assessments were typically carried out on the same day, threshold testing in the remote condition was limited to these two frequencies to ensure optimal cooperation/concentration throughout. Bone-conduction assessment was performed at relevant frequencies when AC thresholds were >20dBHL (with masking where relevant). Assessment of middle ear function using tympanometry occurred by the facilitating Audiologist taking a photograph of the tympanogram and then uploading said image to a share point for the remote tester to access and interpret.
Figure 1. Representation of testing setup for remote assessments.
Data classification
Classification of tympanograms occurred in accordance with Jerger’s tympanogram types (Jerger Citation1970) and otoscopy was recorded into discrete categories to make comparisons across remote and face-to-face assessment in the test group. In the present study, HL was defined as AC thresholds being >20dB at any of 1, 2 and 4 kHz and >25dB at 0.5 kHz. Sensory HL was defined as AC thresholds meeting the HL criteria, along with BC thresholds that were >20dBHL and within 10dBHL of the AC threshold at any given frequency. CHL was defined as AC thresholds meeting the HL criteria along with BC values ≤20dBHL. Finally, mixed hearing loss was defined as AC thresholds meeting the HL criteria, along with BC values being >20dBHL plus ≥15dB HL better than the air conduction threshold at any given frequency.
Equipment
An Otometrics Madsen A450 Audiometer was used for all remote and face-to-face PTA. TDH39 headphones were used for air conduction assessment, BHM BC-1 transducers were employed for bone conduction testing and Natus Stereo (10 ohm) insert phones were used to provide masking for bone conduction evaluation as required. The audiometer was connected to a HP ProBook Windows 10 laptop via USB. The facilitator would connect the laptop to the internet using a Telstra 4GX Hotspot mobile broadband modem. Any connection issues were dealt with by the facilitating Audiologist by re-establishing the connection through the laptop and if severe, resetting the modem.
Otoscopy was performed using a HEINE mini 3000 F.O. otoscope for face-to-face assessment and via a handheld Natus Aurical Otocam 300 Video Otoscope in the remote condition. The video otoscope was connected via USB to the laptop. Tympanometry was performed to assess middle ear function using an Interacoustics MT10 tympanometer for both face-to-face and remote assessment. A smartphone was used to capture photographs of tympanograms and transfer them to the share point.
Statistical analysis
Primary outcome measure for the study was within-subject hearing threshold difference (i.e., the dB difference between audiometric threshold obtained in the remote and face-to-face test conditions). Power calculations were undertaken based on the paediatric test/retest reliability study carried out by Beahan et al. (Citation2012) which found a mean difference of 1.2 dB with a standard deviation of 8.5 dB for a group of 4–6-year-old participants. As such, the estimated sample size required for a target Power of 0.8 was 396 ears. To evaluate the accuracy of PTA in the remote assessment condition, hearing thresholds in remote and face-to-face configurations were compared using paired t-tests and mixed effects ANOVA. A test of two variances (Levene’s) was used to compare variances within the test group (between remote and face-to-face groups) as well as variances of the test group to the control group. Inter-rater agreement analysis including percentage agreement and Cohen’s kappa (κ) was employed for comparing classifications between testers for otoscopy and tympanometry in the test group. Significance was set at p < .05 for all statistical analyses.
Results
A total of 464 school-entry year level children were tested (mean age 5.9 years ± 0.5 SD; range 4 years 11 months to 7 years 1 month). Our sample included 233 (50.2%) females and 272 (58.6%) children living in regional/rural areas. Five-hundred and three children were consented to participate in this study; however, 28 were unable to be tested as they were absent for the duration of testing time at the school. Of 18 schools that participated in this study, 13 were in regional/rural areas within the state of Victoria and 5 were in metropolitan Melbourne. Regional schools were located as far as 542 kilometres away from the remote testing location. Test and control groups were compiled opportunistically, whereby the control group was made up of children attending schools where both Audiologists were able to attend on site to complete the required testing. The prevalence of HL within the test and control samples, along with type, degree and laterality, are presented in . The classifications presented are based on the face-to-face audiogram for each child (or first audiogram for control group). While we saw similar prevalence rates of HL (overall and by type) in both groups, these were skewed towards mild degree and unilateral in the control group, compared to the test group.
Table 1. Prevalence of hearing loss amongst 464 children tested, based on traditional face-to-face assessment.
Test group: air conduction findings
The number of children that had both a face-to-face and remote PTA assessment totalled 376 out of the 436 tested (86.2%). Partial absences and time constraints on data collection meant that 51 (11.7%) of the students were not tested in both conditions. In 4 children (0.9%), attention could not be maintained to complete both a full face-to-face and remote assessment and 5 (1.2%) became distressed part way through assessment. All children who completed both assessments were able to maintain conditioning to obtain thresholds per our protocol.
Of the 376 children, 224 (59.6%) had a face-to-face assessment first, while 152 (40.4%) had a remote assessment first. Air conduction thresholds for both face-to-face and remote conditions were established in 751 ears. Mean hearing threshold (±SD) for each condition at 1 kHz was 15.4 dB HL (6.5) for face-to-face testing and 15.4 dB HL (6.8) for remote testing. A paired t-test suggested no significant difference between mean AC thresholds established by face-to-face and remote methods (p = .64). At 4 kHz, mean hearing threshold was 14.6 dB HL (7.5) in the face-to-face condition and 14.3 dB HL (7.6) in the remote condition. No significant difference between mean AC thresholds at 4 kHz was found by a paired t-test (p = .08). A comparison of AC thresholds obtained in each condition for both frequencies is shown in (panels A and B).
Figure 2. Overlayed scatterplots of individual thresholds obtained for A. 1 kHz AC, B. 4 kHz AC, C. 1 kHz BC, and D. 4 kHz BC.
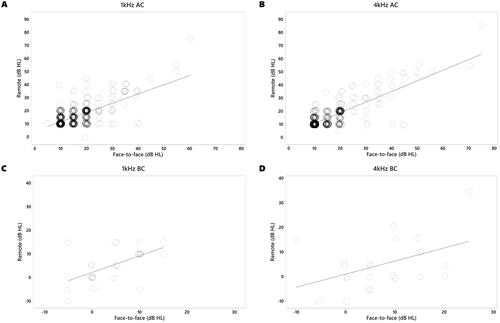
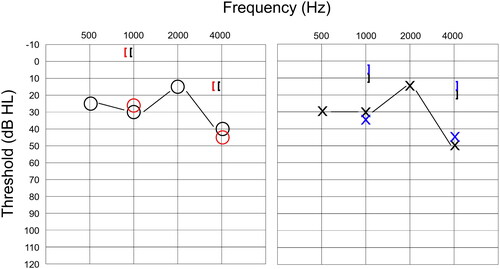
Mean differences (±SD) between thresholds obtained for each condition were 0.1 dB HL (5.9) at 1 kHz and 0.3 dB HL (4.7) at 4 kHz. The proportion of remote AC thresholds that were within 10 dB of the face-to-face value was 98% at 1 kHz and 97.8% at 4 kHz. An example of an audiogram obtained from one child in both face-to-face and remote conditions can be seen in , where the remote thresholds mirrored both the degree and configuration of the HL.
Figure 3. Face-to-face and remote audiograms obtained from one participant with mild conductive hearing loss. Black symbols indicate air conduction and masked bone conduction for traditional assessment, while red and blue symbols indicate thresholds obtained using remote testing for the right and left ear, respectively.
To investigate the impact of testing parameters on the hearing thresholds, a mixed effects ANOVA was performed. The dependent variable was the difference between remote and face-to-face hearing thresholds. The two factors were the order of assessment (remote first or second) and test frequency (1 or 4 kHz) with two covariates being participant age and face-to-face hearing threshold. There were significant main effects of frequency, F(1, 1085) = 8.1, p = .005 and face-to-face threshold F(1, 1405) = 356.8, p < .001. Non-significant results were obtained for participant age, F(1, 330) = 0.3, p = .59 and order of assessment, F(1, 330) = 0.7, p = .41. Investigating this further with a single linear regression analysis revealed a significant (yet weak) association between face-to-face thresholds and threshold differences (F(1, 1500) = 173.3, p < .001), with an R2 of 0.1.
The variability of hearing thresholds was equivalent across the two test configurations. Levene’s test revealed no variance difference between hearing levels obtained in the face-to-face and remote conditions (F(1, 3004) = 0.12, p = .72). There was, however, a significant order effect with face-to-face/remote threshold differences showing greater variance when the remote assessment was carried out second (F(1, 1500) = 19.51, p < .001).
Test group: remote assessments first
Given we found less variance in the subset of children receiving a remote assessment first, we then established the hearing profile in this population. Mean hearing thresholds (±SD) at 1 kHz were 14.8 dB HL (6.0) for face-to-face and 15.2 dB HL (6.1) for remote conditions and at 4 kHz, 14.26 dB HL (6.31) and 14.2 dB HL (6.9) respectively. Mean difference (±SD) between thresholds obtained for each condition were 0.4 dB HL (4.4) at 1 kHz and 0 dB HL (3.6) at 4 kHz. In this subset, the proportion of remote AC thresholds that were within 10 dB HL of the face-to-face values was 99.7% at 1 kHz and 99% at 4 kHz.
Control group comparisons
In our control group (where children underwent 2 x face-to-face assessments) mean hearing thresholds (±SD) for each assessment at 1 kHz were 13.6 dB HL (4.0) for the first audiogram and 12.9 dB HL (3.1) for the second audiogram. At 4 kHz, mean hearing thresholds were 11.7 dB HL (4.3) for the first audiogram and 11.2 dB HL (4.2) for the second audiogram. In the control group, the proportion of remote AC thresholds that were within 10dBHL of the face-to-face values was 100% at 1 kHz and 100% at 4 kHz. Mean difference (±SD) between thresholds obtained for each condition were 0.7 dB HL (3.2) at 1 kHz and 0.5 dB HL (2.1) at 4 kHz. There were no significant differences between air conduction thresholds established in each assessment for 1 kHz (p = .26) nor 4 kHz (p = .18).
Threshold variability was equivalent in the Test and Control groups. Levene’s test showed equivalent variance in threshold differences for the face-to-face/remote and face-to-face/face-to-face findings, F(1, 1616) =8.69, p = .003. There was, again, an order effect with significantly greater variance observed when the Test group underwent remote assessment second (F(1, 1010) = 12.4, p < .001), but Control threshold difference values showed equal variance to those of the Test group when remote assessment was carried out first (F(1, 720) = 3.3, p = .07).
Test group: Bone conduction findings
Mean BC thresholds (±SD) for each condition at 1 kHz were 3.6 dB HL (7.9) for face-to-face testing and 2.5 dB HL (8.7) for remote. At 4 kHz, mean BC thresholds were 8.7 dB HL (7.6) in the face-to-face condition and 8 dB HL (8.6) in the remote condition. A comparison of BC thresholds is shown in (panels C and D). The proportion of remote BC thresholds that were within 10dBHL of the face-to-face levels was 100% at 1 kHz and 95.7% at 4 kHz.
For 28 ears that had both face-to-face and remote BC thresholds established at 1 kHz, mean difference (±SD) was 1.1 dB HL (6.1), (p = .36). At 4 kHz, mean difference between conditions for 23 ears with BC thresholds was 0.7 dB HL (7.3), (p = .67). A mixed effects ANOVA revealed no significant effects for age, F(1, 25) = 0.01, p = .94, order of assessment, F(1, 23) = 1.8, p = .19, test frequency, F(1, 31) = 0.6, p = .44, nor face-to-face threshold level F(1, 46) = 3.8, p = .057.
There was no difference in the variability of BC thresholds across remote and face-to-face assessments (Levene’s: F(1, 100) = 0.08, p = .78). Levene’s test again showed equal variances between BC threshold difference levels (F(1, 49) = 3.1, p = .08), based on test order of the remote and face-to-face assessments.
Otoscopy and tympanometry
Prevalence of each tympanogram result and otoscopy classification can be found in , for both assessment conditions in the test group.
Table 2. Otoscopy classifications and tympanometry types for the sample of 752 ears in test group.
Concordance between the face-to-face and remote testers’ otoscopic examination was assessed using inter-rater reliability analyses. Significant agreement between ratings was found (p < .001) with percentage agreement between the standard otoscopy and video otoscopy of 78.6%. Cohen’s kappa (κ) was 0.6, indicating moderate agreement between raters (Landis and Koch Citation1977). Classification of tympanometry type by face-to-face and remote testers were compared using inter-rater reliability analysis. Percentage agreement of classifications was significant at 92.2% and κ = 0.9 (p < .001), indicating almost perfect agreement.
Discussion
In this study, we found that remote audiometric assessment can reliably establish a child’s AC hearing levels and (if a HL is detected) remote BC can determine the type of HL. Furthermore, assessment of children’s outer and middle ear function remotely resulted in good concordance with face-to-face measures. Through performing diagnostic hearing tests within primary school environments, we found a proportion of undiagnosed HL that further indicated routine and accessible hearing testing in school-aged children is warranted.
Pure tone audiometry
Out of 436 participants, we found only nine (3%) were unable to complete full remote and face-to-face testing. This number was reduced to one (0.7%) when looking at children who received a remote assessment first. This is a particularly high success rate considering most students underwent 2 assessments with only a brief break between tests. This represents a small proportion of children for whom attention to complete the audiometric task may be difficult to maintain. If a fully remote protocol was implemented in the future, we therefore expect the proportion of children unable to complete testing to be minimal (i.e., similar to standard face-to-face assessment) given each child would only be subject to the remote assessment and not an additional face-to-face test also.
For children who completed the full protocol of both face-to-face and remote assessments, we found no significant difference between the mean AC threshold levels in each group at both frequencies. The mean difference (±SD) between thresholds obtained in each condition ranged from 0.1–0.3 dB HL (4.7–5.9 dB) across the 1 kHz and 4 kHz test frequencies. This result is equivalent to a recent adult study comparing remote PTA with traditional PTA in 30 participants which reported mean differences (±SD) at 1 kHz of 0.2 dB (10.5 dB) and at 4 kHz, 0.8 dB (10.5 dB) (Swanepoel, Koekemoer, and Clark Citation2010). When we considered the percentage agreement of face-to-face and remote threshold levels with one another, we found they varied by no more than a clinically acceptable range of 10 dB HL (Atherley and Dingwall-Fordyce Citation1963) in 98% of cases at 1 kHz and 97.8% at 4 kHzFootnote1. Swanepoel, Koekemoer, and Clark (Citation2010) comparison of adult remote/traditional PTA found that 96% of cases showed remote hearing thresholds within 10 dB of face-to-face levels. Despite having smaller numbers for BC, we found no evidence of impacts of age, frequency, degree of HL, or test order on threshold differences. This aspect of the study was, however, significantly underpowered and should be interpreted with caution. Analyses of the BC data suggested similar agreement across test conditions with 100% of 1 kHz and 95.6% of 4 kHz thresholds within the 10 dB clinically acceptable range. Findings were consistent with those for AC, that BC thresholds can be obtained remotely from 4–7-year-old mainstream school children. Furthermore, the mean threshold differences established in the current study vary no more than these previously established rates for remote assessments in adults.
The authors are not aware of any previous reports comparing diagnostic remote and traditional PTA for both AC and BC in school-entry-aged children. We therefore then drew comparisons from our population with traditional PTA test-retest findings in children. In a study of 125 children, Beahan et al. (Citation2012) found test–rest variability for hearing thresholds obtained with traditional PTA to be within 10 dB in 89.9% of 4–6-year-olds, 93.0% in 7–9-year-olds, and 97.0% in 10–13-year-olds. We had a relatively narrow age range in our group (4–7 years) but found smaller mean differences and no age effect on test-retest reliability, suggesting equal accuracy for remote testing in students at school entry. The percentage agreement of thresholds when combined with the average threshold differences indicate that both remote and face-to-face assessments lead to similar findings in our population and present a clinically acceptable variance between assessment methods.
Children with abnormal hearing thresholds may have been adversely affected by remote assessment. As can be seen in , individuals with hearing levels (determined though face-to-face assessment) in the moderate-to-severe range tended to show greater remote/face-to-face threshold differences than those in the normal/mild loss range. The reason for this result is unclear as the testing audiologist reported no difficulty achieving and maintaining conditioning in the remote condition in these participants. As our study contained only 12 ears with significant HL, this effect must be interpreted with caution. Further investigation in hearing-impaired children is clearly warranted.
It is unclear why a frequency effect was found for AC (with 1 kHz showing greater threshold differences than 4 kHz). It is well established that low frequencies are particularly subject to environmental interference compared to high frequencies (Govender and Mars Citation2017). As such, we might expect low-frequency sound detection thresholds to be relatively elevated for testing in non-soundproofed conditions. For our analysis, however, we have compared the same test frequency (either 1 kHz or 4 kHz) across the remote and face-to-face test conditions. Given the testing for each condition occurred in the same room with the same equipment, the reason for threshold difference values being greater at 1 kHz is unknown.
Our results indicated that it may be more difficult to obtain accurate remote results when the child has already been subject to a full hearing assessment. Given we performed two hearing tests with each child, it is possible their concentration waned towards the end of the assessments. Their engagement and focus on the task may have been harder to maintain when the tester was located remotely versus in the same room, impacting their ability to respond down to their true threshold. Given these findings, we performed further analyses on the remote test first subgroup. In most cases, remote hearing thresholds (when obtained first) showed close agreement with face-to-face audiometric levels. When we analysed the threshold agreement between test configurations, >99% of thresholds were within 10 dB HL. Furthermore, mean difference and threshold variance levels were equivalent to those obtained in our control participants, where face-to-face assessment was carried out twice in the same test session. As such, our findings indicate that remote diagnostic PTA in children is clinically reliable in school-entry aged students.
Otoscopy and tympanometry
In the current study we found a moderate inter-rater agreement for otoscopy and almost-perfect agreement for tympanometry. The percentage agreement and statistical significance of these comparisons indicate good reliability for using this protocol for remote assessment of the outer and middle ear. These findings add to the growing body of evidence that suggests remote video otoscopy is useful to identify middle ear abnormalities and improve the reach of this assessment (Metcalfe et al. Citation2021). In the current study Audiologists performed the face-to-face otoscopy and tympanometry by travelling to each of the rural schools with standardised equipment. This proved to be a logistically challenging and expensive exercise. For a diagnostic program to reach every school in a given region (including the most remote schools) this would pose an even greater challenge. In our State alone there are 771 primary schools in regional areas (Victorian State Government Department of Education Citation2023). However, these challenges could be overcome by involving local professionals in the diagnostic process. Emerging research has investigated the role of parents and community healthcare workers (CHWs) in performing smartphone-based otoscopy (Erkkola-Anttinen et al. Citation2019; Shah et al. Citation2018). Furthermore, promising advancements with low-cost mobile phone-enabled tympanometers could see cost and distance barriers with middle ear assessment reduced (Chan et al. Citation2022). More research is required to assess the usefulness of these technologies, but the possibility of engaging non-specialist workers to take measurements of peripheral auditory function warrants exploration.
Prevalence of auditory abnormality
In our school entry test group, we found the overall prevalence of HL to be 17% (total of 74/436 children). Our results here are similar to previous findings obtained by our group using a solely face-to-face test procedure (Bowers, Graydon, and Rance Citation2022). Most of the HLs identified through the present study were bilateral (63.5%), conductive in nature (79.7%) and mild in degree (78.4%). The number of children identified with significant HL in the current study provides more evidence in support of a need to conduct routine hearing testing in school-aged children. The identification of 14 children with sensory type loss in our test population (3.2%) is significant. Given the well-established and long-running UNHS program in the local context (Russ et al. Citation2002), it is likely these children had passed a hearing assessment at birth and their HL had gone undiagnosed until the study. While identification of these sensory-type losses in childhood is high priority, the importance of identifying children with CHL should not be understated. Identifying CHL and associated middle ear pathologies is important in children under six years to minimise effects on academic progress and cognitive development (Bennett et al. Citation2001), as well as potentially serious medical complications (Monasta et al. Citation2012). The diagnostic protocol utilised in the current study rather than a screening tool, ensures parents are provided with detailed results and information, directing them towards appropriate management options. With the knowledge of a child’s exact hearing levels and ear status, we are able to communicate to parents the exact next steps they should take, including local referral options. This facilitates prompt otological care, reducing the time between initial assessment and medical management or aural rehabilitation. The current results support a need to provide accessible audiology in early schooling years to detect hearing impairment and provide intervention, be that medical or for optimisation of listening.
Implications
The findings of this study indicate school hearing screenings are necessary, and that implementing a remote diagnostic hearing assessment program in schools may be an option to address some of the cost and accessibility challenges associated with paediatric audiology services in remote locations (Barr, Dally, and Duncan Citation2020). In the current study, the facilitator assisting the remote Audiologist to perform the hearing assessment was an Audiologist. In the future, upskilling of CHWs to facilitate the remote assessments could occur, to strengthen the ability to engage with local communities and assist with ongoing relationships in rural locales. This would involve more research into training of CHWs to assist PTA and perform tympanometry and otoscopy. Some evidence suggests that involving CHWs may improve access to ear health services while also offering better engagement with management and intervention services (O'Donovan et al. Citation2019; Saunders et al. Citation2022)
While strategies were in place for internet connection issues in the current study, we found that overall, we had no instances of our test progress being adversely impacted by internet failure. While we were testing in rural areas, the internet coverage was adequate to deal with the requirements of our testing software. Fortunately, internet coverage in rural areas (in Australia at least) is less of an issue currently than in the past. For future rural work in schools, considerations of internet provider and coverage should be made and a strategy for troubleshooting in place. We decided to use a broadband modem as we could not rely on the schools to provide their internet connection; however, accessing a school’s fixed wireless could be feasible in situations where mobile broadband fails.
Limitations
We found during our data collection that if a child was absent for the duration of time spent at a given school, they missed the testing despite their guardian indicating they wished for an assessment. In future, this may be able to be avoided by involving local CHWs, to afford more scheduling flexibility.
One potential limitation of the study is that we used an audiologist as the on-site facilitator for the remote assessment. As discussed previously, universal screening over a wide geographic area requires the contribution of local staff (such as CHWs) trained to manage the child through the audiometric process, and particularly, to undertake the physical examination procedures associated with otoscopy and tympanometry. While there is some evidence that these tasks can be undertaken by CHWs (Saunders et al. Citation2022), the requisite skills take time and practice to acquire. Further study is required to optimise training procedures for non-audiologists and to determine the accuracy of the results obtained using this approach.
Our assessments were carried out in quiet, unoccupied rooms and audiometric stimulus presentation was repeated if transient noise fluctuations were considered (by the Facilitating audiologist) likely to affect the findings. Ambient noise levels were, however, not measured, and it is possible (as we used standard audiometric transducers [TDH39 Headphones] rather than more attenuating hardware) that noise level fluctuations may have added to the variability of the results.
Conclusion
This study presents an investigation into remote diagnostic hearing assessments in primary schools. We found good reliability between face-to-face PTA and remote PTA performed in school-entry children, within the school environment. Furthermore, remote assessment of the tympanic membrane and middle ear using remote video otoscopy and tympanogram classification was performed reliably. Future directions could involve investigations of listening difficulties in children that do not appear on the audiogram, for instance, speech-in-noise listening challenges and other self- or carer-reported listening challenges that may not be captured by PTA, otoscopy, and tympanometry. The ability to assess these difficulties remotely could allow the expansion of the diagnostic capability of these assessments for children living in remote circumstances.
Acknowledgements
We express our gratitude to the students who took part in the project, to the University of Melbourne, Department of Audiology and Speech Pathology staff (Donella Chisari, Michelle Todorov and Zoe McNeice) and to the Master of Clinical Audiology candidates who contributed to data collection. Thanks also to the teachers and schools who accommodated the project in their facilities.
Disclosure statement
No potential conflict of interest was reported by the author(s).
Additional information
Funding
Notes
1 Whether or not this degree of retest reliability is acceptable is beyond the scope of this study, but it is noteworthy that there is little data supporting the +/- 10 dB clinical standard in paediatric assessment.
References
- Atherley, G. R., and I. Dingwall-Fordyce. 1963. “The Reliability of Repeated Auditory Threshold Determination.” British Journal of Ind Medicine 20 (3): 231–235. https://doi.org/10.1136/oem.20.3.231.
- Barr, M., K. Dally, and J. Duncan. 2019. “Service Accessibility for Children with Hearing Loss in Rural Areas of the United States and Canada.” International Journal of Pediatric Otorhinolaryngology 123: 15–21. https://doi.org/10.1016/j.ijporl.2019.04.028.
- Barr, M., K. Dally, and J. Duncan. 2020. “Services for Children with Hearing Loss in Urban and Rural Australia.” The Australian Journal of Rural Health 28 (3): 281–291. https://doi.org/10.1111/ajr.12613.
- Beahan, N., J. Kei, C. Driscoll, B. Charles, and A. Khan. 2012. “High-Frequency Pure-Tone Audiometry in Children: A Test-Retest Reliability Study Relative to Ototoxic Criteria.” Ear and Hearing 33 (1): 104–111. https://doi.org/10.1097/AUD.0b013e318228a77d.
- Bennett, K. E., M. P. Haggard, P. A. Silva, and I. A. Stewart. 2001. “Behaviour and Developmental Effects of Otitis Media with Effusion into the Teens.” Archives of Disease in Childhood 85 (2): 91–95. https://doi.org/10.1136/adc.85.2.91.
- Bowers, P., K. Graydon, and G. Rance. 2022. “Evaluation of a Game-Based Hearing Screening Program for Identifying Hearing Loss in Primary School-Aged Children.” International Journal of Audiology 62 (6): 512–520. https://doi.org/10.1080/14992027.2022.2052981.
- Bright, T., and D. Pallawela. 2016. “Validated Smartphone-Based Apps for Ear and Hearing Assessments: A Review.” JMIR Rehabilitation and Assistive Technologies 3 (2): e13–e13. https://doi.org/10.2196/rehab.6074.
- Chan, J., A. Najafi, M. Baker, J. Kinsman, L. R. Mancl, S. Norton, R. Bly, and S. Gollakota. 2022. “Performing Tympanometry Using Smartphones.” Communications Medicine 2 (1): 57. https://doi.org/10.1038/s43856-022-00120-9.
- Chong-White, N., P. Incerti, M. Poulos, and J. Tagudin. 2023. “Exploring Teleaudiology Adoption, Perceptions and Challenges Among Audiologists Before and During the COVID-19 Pandemic.” BMC Digital Health 1 (1): 24. https://doi.org/10.1186/s44247-023-00024-1.
- Cone, B. K., M. Wake, S. Tobin, Z. Poulakis, and F. W. Rickards. 2010. “Slight-Mild Sensorineural Hearing Loss in Children: Audiometric, Clinical, and Risk Factor Profiles.” Ear and Hearing 31 (2): 202–212. https://doi.org/10.1097/AUD.0b013e3181c62263.
- D'Onofrio, K. L., and F. G. Zeng. 2022. “Tele-Audiology: Current State and Future Directions.” Frontiers in Digital Health 3: 788103. https://doi.org/10.3389/fdgth.2021.788103.
- Edmond, K., S. Chadha, C. Hunnicutt, N. Strobel, V. Manchaiah, and C. Yoshinga-Itano, Universal Newborn Hearing Screening (UNHS) Review Group. 2022. “Effectiveness of Universal Newborn Hearing Screening: A Systematic Review and Meta-analysis.” Journal of Global Health 12: 12006. https://doi.org/10.7189/jogh.12.12006.
- Erkkola-Anttinen, N., H. Irjala, M. K. Laine, P. A. Tähtinen, E. Löyttyniemi, and A. Ruohola. 2019. “Smartphone Otoscopy Performed by Parents.” Telemedicine Journal and e-Health 25 (6): 477–484. https://doi.org/10.1089/tmj.2018.0062.
- Fitzgibbons, E. J., S. Keszegi, C. Driscoll, and R. Beswick. 2023. “Childhood Hearing Loss Detected Beyond the Newborn Screen.” International Journal of Audiology 62 (3): 278–285. https://doi.org/10.1080/14992027.2022.2042606.
- Govender, S. M., and M. Mars. 2017. “The Use of Telehealth Services to Facilitate Audiological Management for Children: A Scoping Review and Content Analysis.” Journal of Telemedicine and Telecare 23 (3): 392–401. https://doi.org/10.1177/1357633x16645728.
- Jerger, J. 1970. “Clinical Experience With Impedance Audiometry.” Archives of Otolaryngology (Chicago, Ill.: 1960)92 (4): 311–324. https://doi.org/10.1001/archotol.1970.04310040005002.
- Joint Committee on Infant Hearing. 2019. “Year 2019 Position Statement: Principles and Guidelines for Early Hearing Detection and Intervention Programs.” Journal of Early Hearing Detection and Intervention 4 (2): 1–44. https://doi.org/10.15142/fptk-b748.
- Landis, J. R., and G. G. Koch. 1977. “The Measurement of Observer Agreement for Categorical Data.” Biometrics 33 (1): 159–174. https://doi.org/10.2307/2529310.
- Leach, A. J., P. S. Morris, H. L. Coates, S. Nelson, S. J. O'Leary, P. C. Richmond, H. Gunasekera, S. Harkus, K. Kong, C. G. Brennan-Jones, et al. 2021. “Otitis Media Guidelines for Australian Aboriginal and Torres Strait Islander Children: Summary of Recommendations.” The Medical Journal of Australia 214 (5): 228–233. https://doi.org/10.5694/mja2.50953.
- Lieu, J. E. C., M. Kenna, S. Anne, and L. Davidson. 2020. “Hearing Loss in Children: A Review.” JAMA 324 (21): 2195–2205. https://doi.org/10.1001/jama.2020.17647.
- Mealings, K., S. Harkus, B. Flesher, A. Meyer, K. Chung, and H. Dillon. 2020. “Detection of Hearing Problems in Aboriginal and Torres Strait Islander Children: A Comparison Between Clinician-Administered and Self-Administrated Hearing Tests.” International Journal of Audiology 59 (6): 455–463. https://doi.org/10.1080/14992027.2020.1718781.
- Metcalfe, C., J. Muzaffar, L. Orr, and C. Coulson. 2021. “A Systematic Review of Remote Otological Assessment Using Video-Otoscopy Over the Past 10 Years: Reliability and Applications.” European Archives of Oto-Rhino-Laryngology 278 (12): 4733–4741. https://doi.org/10.1007/s00405-020-06596-2.
- Monasta, L., L. Ronfani, F. Marchetti, M. Montico, L. Vecchi Brumatti, A. Bavcar, D. Grasso, C. Barbiero, and G. Tamburlini. 2012. “Burden of Disease Caused by Otitis Media: Systematic Review and Global Estimates.” PloS One 7 (4): e36226. https://doi.org/10.1371/journal.pone.0036226.
- Morris, P. S., A. J. Leach, P. Silberberg, G. Mellon, C. Wilson, E. Hamilton, and J. Beissbarth. 2005. “Otitis Media in Young Aboriginal Children From Remote Communities in Northern and Central Australia: A Cross-Sectional Survey.” BMC Pediatrics 5 (1): 27. https://doi.org/10.1186/1471-2431-5-27.
- O'Donovan, J., M. Verkerk, N. Winters, S. Chadha, and M. F. Bhutta. 2019. “The Role of Community Health Workers in Addressing the Global Burden of Ear Disease and Hearing Loss: A Systematic Scoping Review of the Literature.” BMJ Global Health 4 (2): e001141. https://doi.org/10.1136/bmjgh-2018-001141.
- Russ, S. A., F. Rickards, Z. Poulakis, M. Barker, K. Saunders, and M. Wake. 2002. “Six Year Effectiveness of a Population Based Two Tier Infant Hearing Screening Programme.” Archives of Disease in Childhood 86 (4): 245–250. https://doi.org/10.1136/adc.86.4.245.
- Saunders, J. E., S. Bessen, I. Magro, D. Cowan, M. G. Quiroz, K. Mojica-Alvarez, D. Penalba, C. Reike, C. E. Niemczak, A. Fellows, et al. 2022. “Community Health Workers and mHealth Systems for Hearing Screening in Rural Nicaraguan School Children.” Journal of Global Health 12: 04060. https://doi.org/10.7189/jogh.12.04060.
- Shah, M. U., M. Sohal, T. A. Valdez, and C. R. Grindle. 2018. “iPhone Otoscopes: Currently Available, but Reliable for Tele-otoscopy in the Hands of Parents?” International Journal of Pediatric Otorhinolaryngology 106: 59–63. https://doi.org/10.1016/j.ijporl.2018.01.003.
- Swanepoel, D. W., D. Koekemoer, and J. Clark. 2010. “Intercontinental Hearing Assessment - A Study in Tele-audiology.” Journal of Telemedicine and Telecare 16 (5): 248–252. https://doi.org/10.1258/jtt.2010.090906.
- Tomlin, D., and G. Rance. 2014. “Long-Term Hearing Deficits After Childhood Middle Ear Disease.” Ear and Hearing 35 (6): e233–242. https://doi.org/10.1097/aud.0000000000000065.
- Victorian State Government Department of Education 2023. School Locations 2023. https://discover.data.vic.gov.au/dataset/school-locations-2023
- Victorian State Government Department of Jobs Precincts and Regions 2022. Victoria’s Regions. Retrieved April 24 from https://www.rdv.vic.gov.au/victorias-regions
- Vogel, D. A., P. A. McCarthy, G. W. Bratt, and C. Brewer. 2007. “The Clinical Audiogram Its History and Current Use.” Communicative Disorders Review 1 (2): 81–94.
- World Health Organization. 2016. Childhood Hearing Loss: Strategies for Prevention and Care. World Health Organisation. Retrieved April 24 from https://apps.who.int/iris/handle/10665/204632.