
 ?Mathematical formulae have been encoded as MathML and are displayed in this HTML version using MathJax in order to improve their display. Uncheck the box to turn MathJax off. This feature requires Javascript. Click on a formula to zoom.
Abstract
Objective
The frequency specific maximum output (MO) of active middle ear implants is the most crucial parameter for speech intelligibility. We determined individual MO from clinical routine data in round window (RW) coupling of the Vibrant Soundbridge (VSB).
Design
Monocentric, retrospective analysis.
Study Sample
68 ears implanted with the VSB at the RW were analysed. Using bone conduction and direct threshold, MO was determined for combinations of implants (VORP502, VORP503) and processors (Samba, Amadé). Coupling modes were: (A) without coupler (N = 28), (B) spherical coupler (N = 19), (C) soft coupler (N = 10) or (D) custom-made “Hannover coupler” (N = 11).
Results
The MO frequency dependence was similar for coupling types (A-D) with a maximum at 1.5 kHz. No differences between groups were observed, although the average MO of the soft coupler was 10 dB lower. The average MO (0.5, 1.0, 2.0, 4.0 kHz) was (A) 77.6 ± 15.0 dB HL, (B) 81.0 ± 11.1 dB HL, (C) 67.6 ± 17.9 dB HL (C), and (D) 79.6 ± 11.7 dB HL (D).
Conclusion
The individual MO can be determined from patients’ clinical data. It permits in-depth analyses of patient outcomes and definition of evidence-based indication and decision criteria.
Introduction
In sensorineural hearing loss, current high power hearing aids are able to cover the entire dynamic range of patients between hearing threshold and uncomfortable level, but may fail to provide enough output in severe mixed hearing loss (MHL) cases (Wardenga et al. Citation2020). Especially in cases where reconstructive surgeries are not an option, implantable bone conduction devices (BCDs) and active middle ear implants (AMEI) in round window (RW) or other alternative applications provide a viable alternative as they circumvent the middle ear, making them independent of middle ear loss (Baumgartner et al. Citation2010). However, depending on the specific type of device, limitations in maximum output (MO) and gain may prevent their successful use if the sensorineural component is too pronounced. In addition, diverse coupling modalities have different coupling efficiencies (Zahnert et al. Citation2016). Furthermore, RW stimulation as the most common clinical application exhibits an inherent variability in coupling efficiency (Beltrame et al. Citation2009). To predict possible outcomes and to define indication and revision criteria, it is desirable to determine the MO and its distribution for different coupling modalities in individual patients. In addition, besides the MO the definition of evidence based indication criteria requires the necessary dynamic range for sufficient speech intelligibility. However, the needed audible dynamic range to understand speech, which is commonly estimated to be approximately 30 to 35 dB (Carlsson and Håkansson Citation1997; Rahne and Plontke Citation2022), may also depend on other factors such as the actual fitting rule and will be treated in detail in an accompanying paper (Busch, Lenarz, and Maier Citation2024).
Several methods have been developed for BCDs and AMEIs to determine the MO. For BCDs, the MO can be determined by measuring the output saturation with a known gain setting (usually with linear gain). Output measures that have been used successfully in previous studies to determine the MO were the sound pressure in the external ear canal (Mertens et al. Citation2014), nasally recorded sound pressure (Reinfeldt et al. Citation2019) and recordings with a surface microphone (Hodgetts et al. Citation2018; Persson et al. Citation2022). All methods that determine the MO by the output saturation can also be employed in transcutaneous devices that are not directly accessible. The same measurement principle of measuring the sound pressure in the ipsilateral external ear canal can be translated to AMEIs and has been used to determine the MO in several devices (Zwartenkot et al. Citation2012; Snik, Noten, and Cremers Citation2004). Determination of the MO by measuring the saturation level requires a defined sound field input and the exact knowledge of the gain/fitting of the device to relate the sound input to the output estimate. However, measuring the input-output function to determine the saturation level at each frequency is not part of clinical routine examinations. As this requires substantial time, effort and additional equipment, such measurements are possible only in a limited population. Although in BCDs saturation-based methods may circumvent the middle ear by the use of an independent output indicator such as a surface microphone, acoustic recordings from AMEIs require an intact ear canal and an at least partially functional middle ear, that is usually not available due to the pathology.
Here we intend to introduce an alternative approach, based on commonly acquired data from clinical routine and electrical specifications of the device. Previously we could introduce a similar method for the transcutaneous BCD “Bonebridge” (MED-EL, Austria) using the force output at threshold in patients, that is determined during direct threshold measurements (also known as in situ measurement) via the device in combination with the output vibratory force level at 90 dB SPL input (OVFL90) (Ghoncheh et al. Citation2024). In contrast to BCDs that are subject to pronounced crosstalk between ears, the method described in the present manuscript is even simpler, as crosstalk is negligible in AMEIs and sophisticated masking is not required in direct threshold measurements.
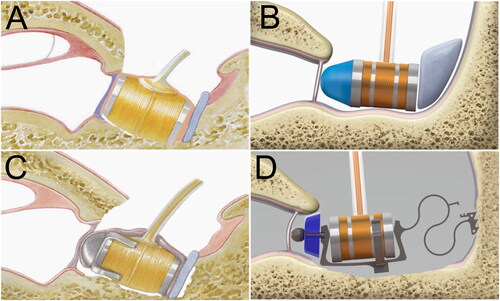
The suggested method for AMEIs employs the electrical input to the AMEI actuator at threshold determined via the device (for the Vibrant Soundbridge (VSB) the direct threshold measurement has the proprietary name “Vibrogram”) and the maximum voltage input to the actuator available from a specific actuator/processor combination. In case of round window coupling of the VSB, the MO depends on three variables, namely (1) the actual implant, e.g., VORP502 or VORP503, (2) the employed processor, e. g., Samba Hi/Lo, Amadé Hi/Std/Lo/LoLo, AP404, and (3) the type of coupler. Anatomical and pathological factors that might have influenced results were not taken into account here. These can easily be addressed also with the same method if pathology-related subgroups are investigated. In our present study, we determined the MO of the Vibrant Soundbridge in three clinically common types of RW coupling and one RW coupling with a custom-made device, the Hannover Coupler (Müller et al. Citation2018), all of which are illustrated in .
Figure 1. (A) The active middle ear implant Vibrant Soundbridge VORP502/VORP503 placed to the round window. Optional round window couplers: (B) the spherical titanium round window coupler, (C) the silicone soft coupler and, (D) the custom-made Hannover Coupler (Images by courtesy of MED-EL).
Methods
Patients and demographics
In this study, complete data sets of 62 patients (34 female, 28 male) were collected retrospectively from patient files. Since four patients were bilaterally implanted and two patients experienced a revision-related change in coupling modality, 68 complete data sets were available and contributed to the analysis. All patients suffered from mixed (54 cases) or conductive hearing loss (14 cases) and were implanted with the Vibrant Soundbridge VORP502 or VORP503 in round window application. The coupling modalities comprised coupling of the FMT in the round window niche using either the Vibroplasty-RW-Coupler (RWC, n = 19), the Vibroplasty-Soft-Coupler (SC, n = 10), the custom-made Hannover Coupler (HC, n = 11) or no coupler at all (RW, n = 28). The mean age at the time of measurement was 60.8 ± 15.7 years (ranging from 14.3 to 81.8 years).
At the respective time of implantation, one of two different generations of implants (VORP502 or VORP503) was available, and patients were provided with an adequate processor depending on their personal needs and preferences. At the time of examination, patients with the earlier implant version (VORP502) had one of the following processors: Samba/Amadé Hi (N = 32), Amadé Lo (N = 6), Amadé St (N = 1), Amadé LoLo (N = 4) or AP404 (N = 1). Patients with the newer implant version (VORP503) were provided with a Samba/Amadé Hi (N = 18), Samba Lo (N = 5) or AP404 (N = 1).
Informed consent for anonymous use of data was obtained at the admission of patients. The data processing was performed anonymously in accordance to the Regulation (EU) 2016/679 of 27 April 2016 on the protection of natural persons with regard to the processing of personal data, relevant guidelines and regulations and the internal regulations of the institution. According to German Data Protection and Professional Laws an ethics committee approval was not necessary for this study design as confirmed in a written statement by the local ethics committee.
Data analysis
The goal of our analysis was to determine the frequency specific maximum output level delivered by the Vibrant Soundbridge (VSB, MEDEL, Austria) coupled to the round window in individual patients. Previous approaches to determine MO and dynamic range (DR) of AMEIs (Zwartenkot et al. Citation2012; Zwartenkot et al. Citation2014) and BCDs (Mertens et al. Citation2014; Persson et al. Citation2022) rely on additional examinations and measurements with custom build setups. Here we employed only patient data that was available from clinical routine. Most AMEI and BCD external processors have an implemented function that allows to determine the direct threshold (also called ‘in-situ’ or in the case of the VSB ‘Vibrogram’ threshold), i.e., the behavioural threshold reported by the patient (with index i) measured via the device. Although the
is generally measured in device specific arbitrary units [dB] that are difficult to calibrate in dB HL for diagnostic purpose as it is the case in standard audiometry devices (Hodgetts and Scollie Citation2017). However, the input voltage to the actuator, at the behavioural direct threshold
can be determined. By adding
(dB attenuator setting) to the input voltage of the Floating Mass transducer (FMT)
at nominally 0 dB direct threshold, the frequency specific, individual input voltage at threshold
is determined:
(1)
(1)
In case of the VSB, the input voltage to the actuator at 0 dB direct threshold is independent of the type of implant and processor and was provided by the manufacturer (). In case of patients with an older processor, such as the AP404, that does not allow the measurement of direct threshold, it can be determined with a newer generation loaner during routine examinations.
Table 1. Voltage input to the actuator at 0 dB direct threshold (data provided by courtesy of MEDEL).
As a second step, the dynamic range provided by the device to the patient is calculated by taking the difference between the maximum voltage
that the implant/processor combination can deliver to the actuator and the voltage at threshold from Equationeq. (1)
(1)
(1)
(2)
(2)
This dynamic range calculation may be limited by the uncomfortable level (UCL; or loudness discomfort level LDL (Dillon and Storey Citation1998)) of the patient if the device is able to exceed the UCL. However, in round window applications of the VSB this is unlikely and can be neglected in the following analysis. Further, the maximum voltage that the implant can deliver to the FMT depends on the specific implant/processor combination. While only two implant types (VORP502, VORP503) have to be taken into account, several processor generations and subtypes exist. The values used for analysis of the most common combinations are listed in .
Table 2. Maximum input voltage to the FMT provided by different implant/processor combinations (data provided by courtesy of MEDEL).
The direct and BC threshold can be assumed identical at inner ear levelFootnote1 and the maximum output in terms of hearing level follows:
(3)
(3)
This easy relationship enables the determination of the of patient i if the BC threshold and the direct threshold on the implanted ear are known. Using only supplementary technical data of the specific implant/processor combination, we applied this method to determine the MO in a larger clinical data set of patients implanted with the VSB at the round window. Furthermore, the proposed method permits to eliminate the differences in MO caused by the use of different implant/processor combinations and to investigate the MO and its distribution for one hypothetical standard combination. Here we assumed a VORP503 implant in combination with a Samba Hi/Amadé Hi to compare the MO of different RW coupling types without or with some commonly used couplers.
Analyses of patient data were performed in groups according to the type of coupling of the VSB to the round window: (A) without coupler (NoC, N = 28), (B) the spherical titanium coupler (RWC, N = 19), (C) the soft coupler (SC, N = 10), (D) the custom-made Hannover coupler (HC, N = 11). The latter device is a non-commercial custom-made-device (CMD) provided by the manufacturer (MED-EL) on individual prescription for each patient, according to the medical device directive (European Union Citation2017) with first clinical results published recently (Knölke et al. Citation2022). In a first analysis step, we determined the MOHL for the actual implant/processor configurations used by the patient, and in a second analysis step, we determined the MOHL for different types of coupling by eliminating the differences arising from different configurations.
Statistical analysis
All statistical analyses and data visualisation were performed with SigmaPlot (version 14, SigmaPlot, Systat Software Inc.). Normal distribution of the datasets was tested using the Shapiro-Wilk test (Shapiro-Wilk, SigmaPlot). In case of normally distributed data an ANOVA was performed, in all other cases the Kruskal-Wallis ANOVA on ranks was used to detect differences between groups. In case of detected significances at single frequencies between groups, this was followed by a pairwise comparison with the Student‘s t–test in case of a normal distribution, otherwise a Mann-Whitney Rank Sum test was performed. Throughout the paper, a significance level of p < 0.05 criterion with a correction for multiple comparisons was adopted.
Results
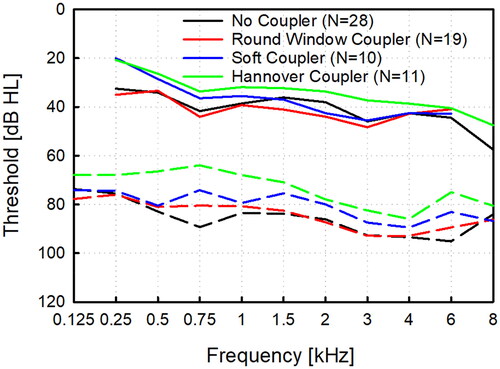
The analysis of AC and BC threshold baselines in the four coupling groups (four groups, 11 frequencies + pure tone average (0.5, 1, 2, 4 kHz)) showed that 25% (12/48) of AC and 21% (10/48) threshold data cannot be assumed normally distributed. The ANOVA on ranks found significant differences in the AC baseline between group RW and HC (Dunn’s method, 0.75 kHz: p = .018; 6 kHz: p = .017), but no difference in the BC baseline between all groups was detected. Unaided baseline AC and BC thresholds of all investigated groups are displayed in .
Figure 2. Unaided air and bone conduction thresholds in the investigated groups without coupler (NoC, N = 28), with the titanium round window coupler (RWC. N = 19), the soft coupler (SC, N = 10) and the custom-made Hannover Coupler (HC, N = 11).
In a first analysis, we compared the patients’ MOHL data for the individual choice of the implant/processor configuration. In , the most common combinations and their mean MOHL are compared to selected combinations with the same implant, but a low-output processor. and shows the individual MOHL for the VORP502 coupled to the round window without coupler (NoC) or with the titanium coupler (RWC). Mean MOHL in patients wearing an Amadé Hi/Samba Hi processor (NoC, N = 18/28; RWC, N = 12/19) was higher at most frequencies than MOHL for two patients provided with an Amadé LoLo processor. A similar picture was seen for the VORP503 coupled to the round window with the soft coupler (SC) or the Hannover coupler (HC) in and . Also, the mean MOHL of patient with an Amadé Hi/Samba Hi (SC: N = 7/10, HC: N = 8/10) was higher at most frequencies than for patients provided with a Samba Lo processor.
Figure 3. Maximum output hearing level for different coupling types to the round window and implant/processor combinations. The VORP502 implant coupled to the round window without coupler (A) and with the spherical coupler (B). Individual (blue) and mean MOHL (black) with the Amadé Hi/Samba Hi processor and examples with the Amadé LoLo (red). VORP503 implant coupled to the round window with the soft coupler (C) and with the Hannover Coupler (D). Individual (blue) and mean MOHL (black) with the Amadé Hi/Samba Hi processor and two examples with the Samba Lo (red).

Although replacement or upgrade of the implanted device is not straightforward after surgery, patients may choose a more or less powerful processor depending on their individual needs after implantation. Specifically in cases with high coupling efficiency combined with minor sensorineural hearing loss, patients may opt for a low output processor, such as the Amadé Lo, Amadé LoLo or Samba Lo, when the output noise of the devices is audible. Consequently, the MOHL in a patient depends on this individual choice, and different coupling types cannot be compared directly to each other. However, differences in implant/processor combinations can be compensated for comparison by normalisation of MOHL patient data for a hypothetical standard configuration. Here we choose the VORP503 with a Amadé Hi/Samba Hi processor as reference configuration because both processors provide the highest maximum output (see ).
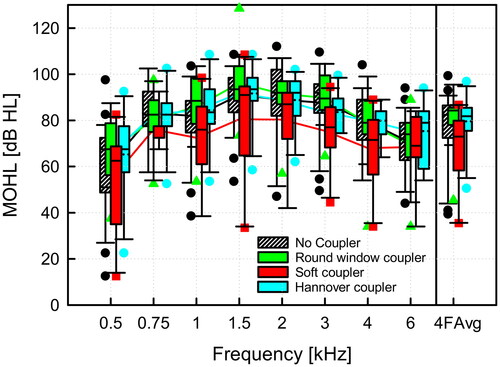
The MOHL for all types of coupling after normalisation for the standard implant/processor configuration is shown in . The MO averaged across speech relevant frequencies (0.5, 1.0, 2.0, 4.0 kHz) was 77.6 ± 15.0 dB HL (mean value ± standard deviation) without coupler, 81.0 ± 11.1 dB HL with the round window coupler, 67.6 ± 17.9 dB HL with the soft coupler, and 79.6 ± 11.7 dB HL with the Hannover coupler. The variability in MO results and coupling efficiency with the round window and Hannover coupler were small in comparison to the soft coupler, which showed a pronounced spread in MO. The outlier in with significantly reduced maximum output was a patient with an AP404, not shown in and revised 6 years with a CI after the analysis. At approximately 50% of frequencies, MOHL data groups cannot be assumed normally distributed (Shapiro-Wilk test), and a Kruskal-Wallis ANOVA on ranks with following pairwise multiple comparison (Dunn’s Method) did not detect significant differences between any groups. However, a trend that the SC had less maximum output than all other coupling types was clearly visible (see ).
Figure 4. Maximum output hearing level for round window coupling normalised for a hypothetical standard configuration of a VORP503 with a Amadé Hi/Samba Hi processor with different coupling modalities. (A) without a coupler, (B) with the spherical round window coupler, (C) with the soft coupler, (D) with the custom-made Hannover Coupler. Individual patient results are shown as thin blue lines and mean values and standard deviations as thick black lines.
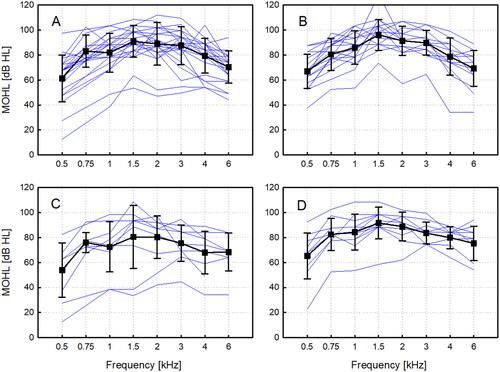
Figure 5. Comparison of normalised (VORP503, Amadé Hi/Samba Hi) MOHL for different methods of round window coupling. The four frequency average (4FAvg) was calculated as the average of maximum output at 0.5, 1, 2, 4 kHz. The boxplot for each group shows the median (solid line), the 25th and 75th percentiles (box) and the 5th and 95th percentile (whiskers) and outliers (symbols of corresponding color).
Discussion
The primary goal of our retrospective study was to introduce an easy method to determine the MO of AMEI in a sufficiently large, statistically meaningful cohort. Previously suggested methods employ a measure of output, such as sound pressure in one of the ear canals, the nose or recorded from the forehead, to determine the output saturation level (Mertens et al. Citation2014; Reinfeldt et al. Citation2019; Hodgetts et al. Citation2018; Persson et al. Citation2022; Snik, Noten, and Cremers Citation2004). These measurements of the input-output function at each investigated frequency take time, are non-standard examinations and require special equipment. In percutaneous and transcutaneous BCDs, this approach is straightforward as sufficient vibratory excitation of the head is generated to record sound as an indicator for output above the noise floor. In AMEIs, only the sound recorded from the ipsilateral ear canal is recordable above noise floor (Snik, Noten, and Cremers Citation2004; Winter, Weber, and Lenarz Citation2002). The situation is even more complicated in conductive and mixed hearing loss (MHL) cases if the reverse transmission is impaired and sound recordings from the ear canal suffer from severe backward transmission attenuation or the ear canal is absent. Under these conditions, such measurements will be possible only in a fraction of CHL and MHL cases and are presumably the reason that MO determinations for comparison are rare (to our knowledge, only a single example for RW coupling is described (Zwartenkot et al. Citation2012; Zwartenkot et al. Citation2014)). However, combined MO results from 5 incus couplings and 1 RW with the Amadé speech processor (0.5 kHz: 75 dB HL; 1 kHz: 83 dB HL, 2 kHz: 90 dB HL, 4 kHz 80 dB HL) are nearly identical to the average results obtained in our study. The only exception in our study was the SC coupler with approximately 10 dB less MO at average across frequencies, although the difference was statistically not significant (). The lower output of the soft coupler is in agreement with earlier clinical findings (Rajan et al. Citation2011).
Beside its simplicity, our proposed method has several additional advantages. Firstly, it provides not only average MO data but also information about the expected statistical distribution, which is relevant in applications that are prone to variability in outcomes. Knowledge about the distribution allows for the preoperative prediction for a specific individual BC threshold and the probability to obtain sufficient benefit, e.g., which word recognition score in quiet can be expected. Further, comparison of the distribution with individual data allows for the evaluation of whether the coupling efficiency is sufficient or below average. However, the definition of indication and revision criteria requires additional information about the dynamic range, i.e., the output level range above threshold that needs to be covered. For example, one patient in was clearly below the average MO but obtained >80% WRS and was not revised despite the low coupling efficiency. Individual patient benefit depends only indirectly on the MO, e.g., patients with a low sensorineural hearing loss (SNHL) can be satisfied, whereas a patient with a pronounced SNHL will not be with the same device. Individual benefit mainly depends on the dynamic range accessible to the patient, which will be addressed in an accompanying paper (Busch, Lenarz, and Maier Citation2024).
Secondly, our suggested method permits to take the specific output of a processor into account. In case of insufficient patient benefit, it allows for the prediction of MO with an upgraded processor to decide if a revision is required or if the exchange of a processor suffices.
Thirdly, with the standardisation of the actual configuration to a hypothetical specific processor/implant combination, the effect of different implants/processors can be taken into account. The specific differences arising from the different electrical output can amount up to approximately 16 dB in MO results (). The approach presented here allows for investigation and comparison of specific coupling options in a cohort independent of the employed implant/processor combination ().
Last but not least, the simplicity and availability of historical data makes tracking of individual patient results from clinical routine possible in order to monitor long-term distinction of implant stability vs. coupling efficiency.
Although the proposed method provides substantial advantages, a few limitations have to be taken into account as well. In contrast to objective measurements, the proposed method relies on two behavioural psychophysical tests (direct and BC threshold). Inherent variability known for the determination of behavioural thresholds (Mahomed et al. Citation2013; Schmuziger, Probst, and Smurzynski Citation2004) may add up and increase dispersion. Nevertheless, the easiness to collect data makes large data sets possible and by regression towards the mean robust average MO can be expected. On the other hand, the sensitivity of MO results to overestimation of BC thresholds (that adds to MOs) require special attention to out-of- range BC or direct thresholds.
Conclusion
The individual MO could be successfully determined exclusively based on patients’ clinical data and hence permits in-depth analyses of individual patient outcomes. For the characterisation in terms of MO of diverse implant/processor combinations of the Vibrant Soundbridge (MED-EL), only the direct (Vibrogram) threshold and BC threshold are required. Patient specific or standardised (device independent) MO determination allows for a detailed interpretation of audiological results and the definition of improved indication and clinical decision criteria.
Author contributions
All authors contributed equally to this work: SB and HM designed the study, SB collected the data; SB and HM analysed the data and wrote the main manuscript; TL conducted the surgery; all authors discussed the results and implications and commented on the manuscript at all stages.
Competing interests
This study is an institution initiated research (IIR) project. SB, TL and HM received travel support to meetings from Cochlear, Oticon and Med-El. The authors declare that the research was conducted in the absence of any commercial or financial relationships that could be construed as a potential conflict of interest.
Ethics declaration
All patient data was acquired during routine measurements and the analysis was performed in retrospective from patient files and intraoperatively recorded data. Informed consent for anonymous use of data was obtained at the admission of patients. The data processing was done anonymous in accordance to the Regulation (EU) 2016/679 of 27 April 2016 on the protection of natural persons with regard to the processing of personal data, relevant guidelines and regulations and the internal regulations of the institution (MHH). According to German Data Protection and Professional Laws an ethics committee approval was not necessary for this study design.
Disclosure statement
SB and HM received travel support by Cochlear Ltd., MEDEL GmbH and Oticon Medical to conferences. The authors disclose no other conflicts of interest.
Data availability statement
The anonymized data used to support the findings of this study are available from the corresponding author upon request.
Note
Additional information
Funding
Notes
1 Here, the reasonable assumption is made that the physiological conditions of the cochlea at threshold, when stimulated with a diagnostic vibrator during audiometric determination of the bone conduction threshold and determination of the direct threshold via the device do not differ.
References
- Baumgartner, W. D., K. Böheim, R. Hagen, et al. 2010. “The Vibrant Soundbridge for Conductive and Mixed Hearing Losses: European Multicenter Study Results.” Advances in Oto-Rhino-Laryngology (Basel) 69: 38–50. https://doi.org/10.1159/issn.0065-3071.
- Beltrame, A. M., A. Martini, S. Prosser, N. Giarbini, and C. Streitberger. 2009. “Coupling the Vibrant Soundbridge to cochlea round window: auditory results in patients with mixed hearing loss.” Otology & Neurotology: official Publication of the American Otological Society, American Neurotology Society [and] European Academy of Otology and Neurotology 30 (2): 194–201. https://doi.org/10.1097/mao.0b013e318180a495.
- Busch, S., T. Lenarz, and H. Maier. 2024. “An Easy Method to Determine Crucial AMEI Performance Parameters from Clinical Routine Data in Individuals - Part 2: Dynamic Range.” International Journal of Audiology. under review.
- Carlsson, P. U., and B. E. Håkansson. 1997. “The Bone-Anchored Hearing Aid: Reference Quantities and Functional Gain.” Ear and Hearing 18 (1): 34–41. https://doi.org/10.1097/00003446-199702000-00004.
- Dillon, H., and L. Storey. 1998. “The National Acoustic Laboratories’ Procedure for Selecting the Saturation Sound Pressure Level of Hearing Aids: Theoretical Derivation.” Ear and Hearing 19 (4): 255–266. https://doi.org/10.1097/00003446-199808000-00001.
- European Union. 2017. “European_Parliament_and_the_Council_of_the_European_Union'. Regulation (EU) 2017/745 of the European Parliament and of the the Council of 5 April 2017 on medical devices.” Official Journal of the European Union.
- Ghoncheh, M., S. Busch, T. Lenarz, and H. Maier. 2024. “A Novel Method to Determine the Maximum Output of Individual Patients for an Active Transcutaneous Bone Conduction Implant Using Clinical Routine Data.” Ear and Hearing 45 (1): 219–226. https://doi.org/10.1097/AUD.0000000000001415.
- Hodgetts, W. E., and S. D. Scollie. 2017. “DSL Prescriptive Targets for Bone Conduction Devices: Adaptation and Comparison to Clinical Fittings.” International Journal of Audiology 56 (7): 521–530. https://doi.org/10.1080/14992027.2017.1302605.
- Hodgetts, W., D. Scott, P. Maas, and L. Westover. 2018. “Development of a Novel Bone Conduction Verification Tool Using a Surface Microphone: Validation With Percutaneous Bone Conduction Users.” Ear and Hearing 39 (6): 1157–1164. https://doi.org/10.1097/AUD.0000000000000572.
- Knölke, N., D. Murawski, N. Wardenga, S. Busch, H. Maier, and T. Lenarz. 2022. “The Hannover Coupler V2: Audiological outcomes of a round window coupler for the Vibrant Soundbridge.” Laryngoscope Investigative Otolaryngology 7 (3): 840–846. https://doi.org/10.1002/lio2.812.
- Mahomed, F., D. W. Swanepoel, R. H. Eikelboom, and M. Soer. 2013. “Validity of Automated Threshold Audiometry: A Systematic Review and Meta-Analysis.” Ear and Hearing 34 (6): 745–752. https://doi.org/10.1097/01.aud.0000436255.53747.a4.
- Mertens, G., J. Desmet, A. F. M. Snik, and P. Van de Heyning. 2014. “An Experimental Objective Method to Determine Maximum Output and Dynamic Range of an Active Bone Conduction Implant: The Bonebridge.” Otology & Neurotology: official Publication of the American Otological Society, American Neurotology Society [and] European Academy of Otology and Neurotology 35 (7): 1126–1130. https://doi.org/10.1097/MAO.0000000000000347.
- Müller, M., R. Salcher, N. Prenzler, T. Lenarz, and H. Maier. 2018. “Redesign of the Hannover Coupler: Optimized Vibration Transfer from Floating Mass Transducer to Round Window.” BioMed Research International 2018: 3701954–3701958. https://doi.org/10.1155/2018/3701954.
- Persson, A.-C., B. Håkansson, M. Caveramma Mechanda, W. Bill Hodgetts, K.-J. Fredén Jansson, M. Eeg-Olofsson, and S. Reinfeldt. 2022. “A Novel Method for Objective In-Situ Measurement of Audibility in Bone Conduction Hearing Devices - A Pilot Study Using a Skin Drive BCD.” International Journal of Audiology 62 (4): 357–361.
- Rahne, T., and S. K. Plontke. 2022. “Systematic and Audiological Indication Criteria for Bone Conduction Devices and Active Middle Ear Implants.” Hearing Research 421: 108424. https://doi.org/10.1016/j.heares.2021.108424.
- Rajan, G. P., P. Lampacher, R. Ambett, G. Dittrich, J. Kuthubutheen, B. Wood, A. McArthur, and R. Marino. 2011. “Impact of Floating Mass Transducer Coupling and Positioning in Round Window Vibroplasty.” Otology & Neurotology: Official Publication of the American Otological Society, American Neurotology Society [and] European Academy of Otology and Neurotology 32 (2): 271–277. https://doi.org/10.1097/MAO.0b013e318206fda1.
- Reinfeldt, S., C. Rigato, B. Håkansson, K.-J. Fredén Jansson, and M. Eeg-Olofsson. 2019. “Nasal Sound Pressure as Objective Verification of Implant in Active Transcutaneous Bone Conduction Devices.” Medical Devices (Auckland, NZ) 12: 193–202. https://doi.org/10.2147/MDER.S197919.
- Schmuziger, N., R. Probst, and J. Smurzynski. 2004. “Test-Retest Reliability of Pure-Tone Thresholds from 0.5 to 16 kHz Using Sennheiser HDA 200 and Etymotic Research ER-2 Earphones.” Ear and Hearing 25 (2): 127–132. https://doi.org/10.1097/01.aud.0000120361.87401.c8.
- Snik, A. F. M., J. Noten, and C. Cremers. 2004. “Gain and Maximum Output of Two Electromagnetic Middle Ear Implants: Are Real Ear Measurements Helpful?” Journal of the American Academy of Audiology 15 (3): 249–257. https://doi.org/10.3766/jaaa.15.3.7.
- Wardenga, N., V. Diedrich, B. Waldmann, T. Lenarz, and H. Maier. 2020. “Hearing Aid Treatment in Patients with Mixed Hearing Loss. Part I: Expected Benefit and Limitations after Stapes Surgery.” Audiology & Neuro-Otology 25 (3): 125–132. https://doi.org/10.1159/000502994.
- Winter, M., B. P. Weber, and T. Lenarz. 2002. “Measurement Method for the Assessment of Transmission Properties of Implantable Hearing Aids.” Biomedizinische Technik. Biomedical Engineering 47 Suppl 1 Pt 2: 726–727. https://doi.org/10.1515/bmte.2002.47.s1b.726.
- Zahnert, T., H. Löwenheim, D. Beutner, R. Hagen, A. Ernst, H.-W. Pau, T. Zehlicke, H. Kühne, N. Friese, A. Tropitzsch, et al. 2016. “Multicenter Clinical Trial of Vibroplasty Couplers to Treat Mixed/Conductive Hearing Loss: First Results.” Audiology & Neuro-Otology 21 (4): 212–222. https://doi.org/10.1159/000444616.
- Zwartenkot, J. W., A. F. M. Snik, E. A. M. Mylanus, and J. J. S. Mulder. 2014. “Amplification Options for Patients With Mixed Hearing Loss.” Otology & Neurotology: Official Publication of the American Otological Society, American Neurotology Society [and] European Academy of Otology and Neurotology 35 (2): 221–226. https://doi.org/10.1097/MAO.0000000000000258.
- Zwartenkot, J., A. Snik, M. Kompis, and C. Stieger. 2012. “Gain and Maximum Output of Implantable Hearing Devices in Patients with Moderate to Severe Sensorineural Hearing Loss.” Journal of Hearing Science 2 (3): 35–40. https://doi.org/10.17430/883511.