
Abstract
Electronic cigarettes (E-cigarettes) are a potential means of addressing the harm to public health caused by tobacco smoking by offering smokers a less harmful means of receiving nicotine. As e-cigarettes are a relatively new phenomenon, there are limited scientific data on the longer-term health effects of their use. This study describes a robust in vitro method for assessing the cytotoxic response of e-cigarette aerosols that can be effectively compared with conventional cigarette smoke. This was measured using the regulatory accepted Neutral Red Uptake assay modified for air–liquid interface (ALI) exposures. An exposure system, comprising a smoking machine, traditionally used for in vitro tobacco smoke exposure assessments, was adapted for use with e-cigarettes to expose human lung epithelial cells at the ALI. Dosimetric analysis methods using real-time quartz crystal microbalances for mass, and post-exposure chemical analysis for nicotine, were employed to detect/distinguish aerosol dilutions from a reference Kentucky 3R4F cigarette and two commercially available e-cigarettes (Vype eStick and ePen). ePen aerosol induced 97%, 94% and 70% less cytotoxicity than 3R4F cigarette smoke based on matched EC50 values at different dilutions (1:5 vs. 1:153 vol:vol), mass (52.1 vs. 3.1 μg/cm2) and nicotine (0.89 vs. 0.27 μg/cm2), respectively. Test doses where cigarette smoke and e-cigarette aerosol cytotoxicity were observed are comparable with calculated daily doses in consumers. Such experiments could form the basis of a larger package of work including chemical analyses, in vitro toxicology tests and clinical studies, to help assess the safety of current and next generation nicotine and tobacco products.
Introduction
Prolonged exposure to mainstream tobacco smoke is a causative factor in the development of cardiovascular disease, chronic obstructive pulmonary disease and cancer (US Department of Health and Human Services, Citation2010). Cigarette mainstream smoke is a complex aerosol, comprising more than 6000 identified constituents distributed in the particulate, vapor and gas phases (Rodgman & Perfetti, Citation2013). Exposure to both phases and the retention of smoke particles contributes to smoking-related injury and disease, although the role of each component of tobacco smoke in the development of these processes is still unclear (Sangani & Ghio, Citation2011; US Department of Health and Human Services, Citation2010). However, it may also be noted that the e-cigarette aerosol, in contrast, comprises soluble liquid droplets and minimal vapor phase components.
For many years public health policies were dedicated to smoking cessation as a means to reduce tobacco-related disease. As it has become clear that a proportion of smokers remain unable or unwilling to quit, the concept of tobacco harm reduction has been recognized. Tobacco harm reduction is a strategy with the aim of lowering the health risks associated with tobacco use. This could potentially be achieved through reducing cigarette consumption by making available alternative and less harmful sources of nicotine (Rodu & Godshall, Citation2006). With the rising popularity of e-cigarettes, the concept of tobacco harm reduction has moved to feasible reality. Pharmaceutical nicotine-replacement therapy (NRT) products have been used for some time as medicines to aid smoking cessation. They are generally provided with a view to short-term use, although recent reviews by regulatory authorities have recognized their potential for harm reduction through extended use and their availability as over-the-counter (OTC) products (FDA, Citation2013; MHRA, Citation2010). It has been argued that smoking-related harm could be reduced if smokers have access to products that are as readily available as cigarettes and are socially acceptable, as illustrated by the case of snus (Fagerström & Schildt, Citation2003). In general, the delivery of nicotine from NRT products is relatively slow and the pharmacokinetic (PK) profile of nicotine does not fully resemble that of cigarettes (Bullen et al., Citation2010; Digard et al., Citation2013). However, numerous studies have shown that the e-cigarette nicotine PK profile more closely resembles that of a cigarette (Caldwell et al., Citation2012; Hajek et al., Citation2015; Schroeder & Hoffman, Citation2014; St Helen et al., Citation2016) and this effective nicotine delivery has been improved further by the development of new-generation devices (Farsalinos et al., Citation2014). E-cigarettes also provide some of the familiar sensory and behavioral aspects of the act of cigarette smoking that are further consistent with their greater potential to serve as successful cigarette substitutes. E-cigarettes therefore appear to deliver nicotine sufficiently to be considered as a potential tobacco harm reduction product and while their relative safety has been questioned, many public health bodies, such as Public Health England, are now advocating their use as a safer alternative to cigarette smoking (Public Health England, Citation2015).
The last decade has seen the dramatic emergence and increasingly widespread use of electronic nicotine delivery systems (ENDS), and e-cigarettes in particular, as alternatives to conventional tobacco cigarettes (Pepper & Brewer, Citation2014). Around 12% of Europeans have tried e-cigarettes at some point, and roughly 2% report continued use (European Commission, Citation2015), which is comparable to US figures of 12.6% and 3.7%, respectively (Schoenborn & Gindi, Citation2015). Smokers have cited a number of reasons for using e-cigarettes, such as to reduce or quit the use of conventional cigarettes (European Commission, Citation2015; Hiscock et al., Citation2014; Palipudi et al., Citation2016). In parallel with this rise in popularity, e-cigarette design has evolved rapidly, resulting in a variety of products, from single-piece cigarette-like products to modular devices with interchangeable parts, and e-liquids available in a wide range of flavors.
Compared with conventional cigarettes, where there is a wealth of information on components, smoking behaviors, and effects at the individual and population levels, the data available for e-cigarettes are still relatively scarce (Callahan-Lyon, Citation2014). Nevertheless, growing evidence suggests that e-cigarettes pose a reduced risk to consumers compared with conventional cigarettes (Public Health England, Citation2015; Royal College of Physicians, Citation2016). Public Health England recently reported that e-cigarettes were likely to be 95% less harmful than tobacco products and could be a means for smokers to quit or reduce their consumption of cigarettes. (Forster et al., Citation2015; Nutt et al., Citation2014; Public Health England, Citation2015; West et al., Citation2015). The evidence was based on the composition and quantities of constituents found in e-cigarette aerosols and the relative risk associated with the main components. By contrast, some groups suggest that e-cigarettes are harmful (Chen, Citation2013; Goniewicz et al., Citation2013). Indeed, e-cigarette aerosol may contain some toxicants, but these are expected to be at much lower levels, perhaps up to 450 times lower, than in cigarette smoke (Goniewicz et al., Citation2014; Varlet et al., Citation2015). In recent studies, we reported the levels of e-cigarette emissions from a commercially available e-cigarette, (Vype ePen, Nicoventures, UK) were 92–99% lower than those from a reference tobacco cigarette (3R4F, University of Kentucky) (Margham et al., Citation2016). Of the 150 chemical measures assessed, only 43 were detectable in Vype ePen: 17 were present at levels too low to be quantified; of the 26 aerosol constituents that could be quantified, 13 were identified as analytical contaminants, and 13 were generated in whole or in part by the e-cigarette. Compounds measured included the major e-liquid constituents (nicotine, propylene glycol (PG) and glycerol (VG)), recognized impurities in pharmacopeia quality nicotine and eight species previously identified as thermal decomposition products of PG or VG. In contrast, around 100 of these measures were detected in mainstream cigarette smoke. Also, while much attention has been paid to nicotine and excipient levels, analysis of other compounds, such as aldehydes, phenols and metals, and of particulate matter are less studied, and the methods applied are varied (Cheng, Citation2014; Williams et al., Citation2013). Although the longer-term human health effects of e-cigarette aerosol consumption are unclear, cumulative evidence to date suggests the risks are less due to the significantly lower chemical complexity of e-cigarette aerosol (Margham et al., Citation2016).
In 2009, the US Food and Drug Administration (FDA) was mandated the authority to approve tobacco products for the US market, and does so on the basis of extensive scientific evidence (FDA, Citation2012). The FDA has recently extended regulation to include e-cigarettes and other unregulated tobacco products (FDA, Citation2016). In Europe, e-cigarettes containing nicotine have recently become regulated as part of a 2014 revision to the Tobacco Products Directive (European Commission, Citation2014). The new EU directive that came into effect on 20 May 2016 introduces numerous rules that e-cigarette manufacturers must follow, including restrictions on nicotine content, safety, quality and packaging. The Directive also obliges manufacturers to provide national authorities with any available data and information on ingredients used and emissions, including toxicological data, nicotine dose and uptake before a new consumer product can be placed on the market.
Non-clinical studies have been used to support the toxicological evaluation of aerosols, including tobacco smoke. In particular, in vitro studies have also been employed to assess the genotoxicity and mutagenicity of tobacco smoke, generally focused on the particulate matter (PM). Major progress has been made in the development of in vitro testing approaches in recent years. Advances in cell culture and exposure techniques have driven and facilitated the use of more physiologically relevant in vitro assessments, which can include a growing number of potential endpoints such as cytotoxicity. However, in vitro tests that adequately reflect the in vivo effects of exposure in humans need to be further developed for cigarettes and e-cigarettes (Neilson et al., Citation2015; Romagna et al., Citation2013). The use of cell cultures for direct aerosol exposure in vitro studies is challenging, but the availability of human tissue models with, for instance lung epithelial cells, goblet cells and fibroblasts, has allowed the study of effects at the air-liquid interface (ALI) of tobacco smoke (Azzopardi et al., Citation2015; Garcia-Canton et al., Citation2014; Iskandar et al., Citation2013) and other airborne pollutants (Gminski et al., Citation2010). Crucial to the accurate and reliable assessment of biological effects after exposure is delivery of the aerosol at the correct and consistent dilution.
Owing to the short time since the introduction of e-cigarettes to the market, methods and instrumentation that are specifically designed, validated and standardized for e-cigarette assessment are still under development. The formation mechanism for e-cigarette aerosol is via condensation of a supersaturated vapor, giving sub-micron droplet diameters and similar concentrations to those formed in cigarette aerosols, but with an overall significantly simpler chemistry. This physical similarity between the aerosols is important as it allows the use of existing exposure systems. This enables some current gaps in the safety assessment of e-cigarettes to be addressed, by allowing testing of their aerosols in a way that is relevant to real-life use. For example, e-cigarette formulation excipients (usually VG and/or PG) are commonly found in food, cosmetics and pharmaceuticals and are considered safe to ingest. However, there are limited data on the safety of these and other e-liquid ingredients when they are inhaled. Also, the potential toxicological consequences of heating flavor components, and the interactions between the various aerosol components requires extensive study (Behar et al., Citation2014). The phenomenon of “dry-wicking” occurs when the wick does not take up adequate e-liquid or is not fully immersed. This may overheat the e-liquid, which can result in the generation of toxicants, namely aldehydes from the PG/VG (Farsalinos et al., Citation2015). However, the consumer can easily detect and avoid the unpleasant associated “dry-wicking” conditions (Farsalinos et al., Citation2015), therefore the risk of extended exposure to these toxicants is low.
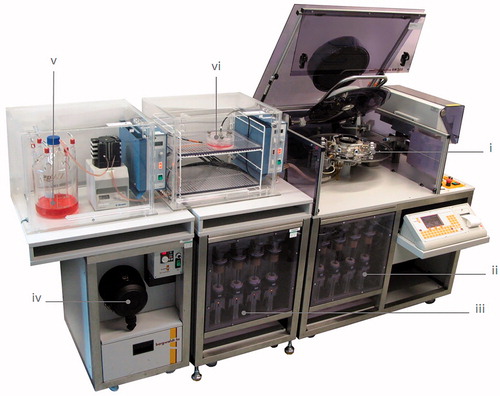
To characterize tobacco smoke, traditional methods have focused on the particulate matter, which can be collected on Cambridge filters (Health Canada, Citation2004) and, to capture water-soluble particulate and vapor components, by bubbling smoke through various media. Ideally, though, to completely understand the biological effects of tobacco smoke on the lung, exposure to the whole aerosol needs to be assessed. In the case of e-cigarette aerosol, the much lower complexity means that whole aerosol exposure is also the most useful and relevant method. This is achievable with commercially available exposure systems, such as the Vitrocell® VC10 (Vitrocell® Systems GmbH, Waldkirch, Germany) and Borgwaldt RM20S (Borgwaldt KC GmbH, Hamburg, Germany; ), which integrate smoking (puffing) machines, dilution capabilities, and exposure chambers, allowing direct exposure of in vitro cell cultures to aerosols at several dilutions in air simultaneously. These systems have been characterized extensively, validated and applied in a range of studies (Adamson et al., Citation2011; Azzopardi et al., Citation2015; Schmid et al., Citation2015; Thorne et al., Citation2015; Unwalla et al., Citation2015). The nature of these systems provides the potential for their adaptation to facilitate the exposure of cells to a variety of gaseous constituents of tobacco smoke (Breheny et al., Citation2014) and to aerosols from other noncombustible products including e-cigarettes (Neilson et al., Citation2015).
Figure 1. Borgwaldt RM20S smoking machine. (i) Cigarette smoke generator. (ii) Original four-syringe system. (iii) Four-syringe extension. (iv) Air-flow controller. (v) Cell culture media maintained at 37 °C. (vi) British American Tobacco’s exposure chamber housed at 37 °C, attached to the smoke diluter and culture media (modified from Adamson et al., Citation2011).
The cultures used in these exposure systems can range from simple immortalized cell lines to more physiologically relevant three-dimensional tissue cultures with several cell types that can be transitioned to the ALI. Thus, cells may be exposed to all of the phases of smoke simultaneously, mimicking exposure in the airway epithelium in vivo (Paur et al., Citation2011). These ALI exposure systems overcome some of the limitations of submerged culture systems, which include the potential for dose being dependent upon test article solubility and transport rates of different particles, the absence of gas phase components, cross-reactions/interference between the analytes in the test system and the unrealistic nature of submerged culture for primary culture organs such as in the lung (Paur et al., Citation2011).
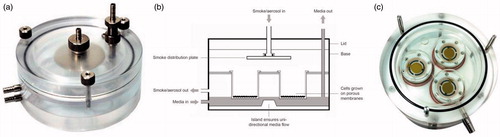
Dosimetry measurements are crucial to accurate biological assessment of the effects of aerosol exposure. In order for the dose delivered to be correct and consistent, the aerosol generation machines, delivery method, the aerosol itself and the exposure interface must all be carefully characterized. Much work has been done on dosimetry and system characterization in the past few years (Adamson et al., Citation2014; Kaur et al., Citation2010; Majeed et al., Citation2014). One of the most extensively and successfully used method is the measurement of deposited particulate matter with the quartz crystal microbalance (QCM), which is typically placed inside a cell exposure chamber at the cell–aerosol interface (). QCMs can detect changes in mass within the nanogram range for particle sizes 150–500 nm, and allow measurement of deposited mass per surface area (μg/cm2) in real time (Adamson et al., Citation2012). The understanding gained about deposition allows direct comparison of mass-based dose versus biological responses to aerosols, which is important for toxicity and safety assessment studies.
Figure 2. British American Tobacco’s standard exposure chamber used for in vitro exposures to aerosol at the air–liquid interface (a; Adamson et al., Citation2011 and b; Thorne & Adamson, Citation2013). Modifications to accommodate the three quartz crystal microbalance units (lid removed) (c; Adamson et al., Citation2013).
Internationally approved and recognized smoking regimens have been used for decades to allow standardization of the analysis of tobacco product smoke chemistry and in vitro and in vivo toxicological assessments (Bombick et al., Citation1997; Brunnemann et al., Citation1977; Flick et al., Citation1985; Hoffmann & Wynder, Citation1967; Rickert et al., Citation2007). The choice of smoking regimen has a profound effect on the initial aerosol concentration and composition (Azzopardi et al., Citation2015; Colard et al., Citation2014; Purkis et al., Citation2013). The International Organization for Standardization (ISO) and Health Canada Intense (HCI) smoking regimens produce very divergent toxicant deliveries, and this wide range encompasses the majority of smokers puffing profiles across the exposure spectrum; the ISO regimen is generally recognized as underestimating the constituent yields obtained by smokers (Burns et al., Citation2008; Côté et al., Citation2011; Jackson et al., Citation2016), whereas HCI overestimates yields for the majority of smokers (Côté et al., Citation2011; Jackson et al., Citation2016). Importantly, the WHO Study Group on Tobacco Product Regulation (TobReg) recommends using both ISO and HCI machine-smoking methods to obtain the range of toxicant deliveries under extreme conditions (WHO, Citation2008). Even though topography of e-cigarette use varies drastically among users and between devices, shown by a range in average topographies from several studies, it is possible that these standard regimens could be applied to some next-generation nicotine and tobacco products and the commonality of testing regimens would aid cross-category comparison.
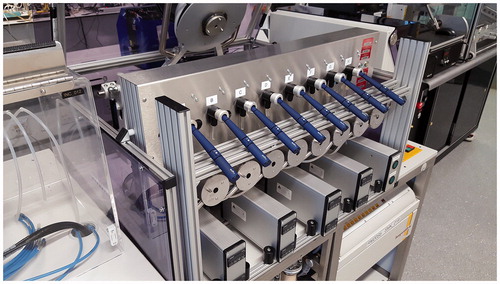
On the basis of our existing knowledge on Borgwaldt RM20S exposure system and cigarette and e-cigarette aerosol composition, we hypothesize that e-cigarettes may provide different deposition and toxicological profiles from conventional cigarettes. Here, we describe a study where first we investigated whether an adapted Borgwaldt RM20S exposure system () could generate and deliver various dilutions of e-cigarette aerosols from two different commercially available products (Vype eStick and ePen) to our in vitro exposure chamber (). A dosimetric analysis method using QCMs was employed to detect the aerosol dilutions entering the exposure chamber and allowed the comparison of deposited mass between the two e-cigarettes and a reference Kentucky 3R4F cigarette. We then investigated whether a differential cytotoxic response could be elicited from exposure of an in vitro human bronchial epithelial model to aerosols generated from the higher delivery Vype ePen e-cigarette and 3R4F cigarette. Exposure conditions were relatively extreme compared to real-life human exposure; the 60-minute exposure delivered particulate doses comparable to estimates of those received by consumers of cigarettes or e-cigarettes over the course of a day or more. These conditions were used to enable the elicitation of a cytotoxic response from the e-cigarette aerosol that would allow the products to be compared using EC50 values.
Figure 3. Vype ePen e-cigarettes are attached to the adapted Borgwaldt RM20S by bypassing the cigarette smoke generator.
Methods
Chemicals and reagents
All chemicals and reagents used were obtained from Fisher Scientific (Loughborough, UK) unless otherwise stated. All chemicals were of analytical grade with a purity of ≥99%.
Cell culture
NCI-H292 human bronchial epithelial cells, cell number CRL-1848 (American Type Culture Collection (ATCC), Middlesex, UK), were cultured in RPMI-1640 medium supplemented with 10% FBS, 2 mM L-glutamine, 50 U/mL penicillin and 50 μg/mL streptomycin at 37 °C, with 5% CO2 in a humidified atmosphere. Forty-eight hours before exposure, cells were seeded on the apical side of 12 mm porous Transwell® culture inserts, in sterile 12-well plates, at a density of 2 × 10⁵ cells/mL in 0.5 mL of supplemented RPMI-1640. For each culture insert, 1 mL supplemented RPMI-1640 was also placed in the basal compartment of each well. Twenty-four hours before exposure, the apical and basal culture media were replaced with 0.5 mL and 1 mL of UltraCULTURE™ (Lonza, Basel, Switzerland) containing 2 mM L-glutamine, 50 U/mL penicillin and 50 μg/mL streptomycin respectively.
Test products
Three products were utilized in the dosimetric assessment of the adapted Borgwaldt RM20S: 3R4F reference cigarettes (University of Kentucky, Citation2016) and two commercially available e-cigarettes, the Vype eStick and a Vype ePen (Nicoventures, Blackburn, UK; www.govype.com). The 3R4F tobacco cigarette is a US-blended king-sized product with a cellulose acetate filter and a 9.4 mg International Organization for Standardization [ISO] tar yield. Vype eStick is puff-activated cigarette-like product and Vype ePen is a button-activated “closed-modular” system consisting of two modules, a rechargeable battery section and a replaceable liquid (“e-liquid”) containing cartridge (“cartomizer”). The Vype ePen has two voltage settings of 3.6 and 4.0 V, the higher of which was used in this study. The 3R4F cigarette and higher delivery Vype ePen e-cigarette were utilized for the subsequent cytotoxicity assessment.
Prior to analysis, 3R4F cigarettes were conditioned for at least 48 h at 22 ± 1 °C and 60 ± 3% relative humidity in accordance with ISO 3402 (ISO, Citation1999). E-cigarettes were fully charged and loaded with fresh cartomisers for each exposure. Product specifications are detailed in .
Table 1. Specification of products and parameters.
Generation of aerosols
The Borgwaldt RM20S smoking machine (serial number 0508432), previously described (Adamson et al., Citation2011; Thorne & Adamson, Citation2013; ), was modified so that the tobacco smoke generator was bypassed for e-cigarette exposures. 3R4F cigarettes and Vype eStick or ePen e-cigarettes were “puffed” in the smoking machine and a range of aerosol dilutions ranging from 1:5000 to 1:30 and 1:100 to 1:2 (aerosol:air, vol:vol), respectively, were delivered to cell cultures or QCMs (Vitrocell® Systems GmbH, Waldkirch, Germany) housed within purpose-built exposure chambers (). Lower dilutions for e-cigarettes were used to enable the delivery of the highest possible dose to try and elicit a toxicological dose response and to enable sufficient generation, deposition, extraction and extrapolation of material for mass and nicotine comparisons. Vype ePen was held at a −45° angle (mouthpiece up) reflecting observed consumer use of the product.
3R4F cigarettes were smoked under the Health Canada intense (HCI) regimen (puff volume, duration and frequency of 55 mL, 2 s and 30 s (55/2/30); Health Canada, Citation1999) to the butt mark (length of overwrap +3 mm), according to ISO 4387 (ISO, Citation2000), with filter ventilation blocked (typically 10 puffs). Filter ventilation was designed to reduce the yields of mainstream cigarette smoke components by diluting the smoke and influencing a number of mechanisms important in smoke generation, including the combustion processes, filtration of the smoke aerosol particles and gaseous diffusion (Baker & Lewis, Citation2001). Ventilation zone blocking whilst smoking may have the effect of increasing the yields of smoke components relative to those obtained from unblocked cigarettes (Baker & Lewis, Citation2001). In practice, for 3R4F, yields of both particle and vapor phase components increase by a factor of ∼3 for the HCI regime (Eldridge et al., Citation2015).
E-cigarettes were “puffed” under modified industry-recognized regimens, (i) ISO 3308 (ISO, Citation2012; 35/2/60 with a bell shaped puff profile modified to a rectangular profile (mISO), and with one second pre-coil activation for ePen; and 35/3/60 with no pre-activation for eStick) and (ii) HCI (modified from 55/2/30 with a bell-shaped profile to a rectangular profile, and with one second pre-coil activation for ePen (CORESTA, Citation2015)), to maximize aerosol production and better reflect real-world consumer behavior. The different puffing regimens used in this study are summarized in .
Table 2. Specification of Regimens and experimental parameters.
To minimize aerosol cross-contamination, the 3R4F cigarettes and each of the e-cigarettes were “puffed” on dedicated independent syringes. All exposures were performed in a test atmosphere of 60 ± 5% relative humidity, at 22 ± 2 °C (ISO, Citation1999). All QCM exposures were 15 min (15 puffs at ISO and 30 puffs at HCI) and cytotoxicity exposures were 60 min (120 puffs).
Quantification of deposited aerosol mass at the exposure interface
To assess and quantify the delivery of e-cigarette aerosols, a range of dilutions (1:40–1:5) were created and delivered to the exposure chambers, each of which housed 3 six-well plate compatible QCMs (ø = 2.54 cm) in positions normally occupied by cells. This method is described in detail by Adamson et al. (Citation2013). In brief, the aerosol input and exhaust tubing were attached to the QCM chambers, but no culture media was included and, therefore, the medium in and out ports were blocked (). The QCM chambers were maintained at 37 °C and readings were allowed to stabilize before each exposure commenced. During exposure, mass values were recorded every 2 s to allow deposition to be monitored in real time, although only the final mass values at 15 min were analyzed. After exposure the quartz crystals were cleaned in situ by wiping the surfaces with soft lint-free tissues and 70% ethanol, and any residual ethanol was removed with compressed air.
To allow conversion of aerosol dilutions to deposited mass per unit area, the aerosol mass delivered by each product was measured using QCMs for each dilution used in the cytotoxicity assessment. The process described above was repeated for 3R4F under the HCI regimen at dilutions of 1:5000–1:30. For Vype ePen, the modified HCI range was expanded to include 1:2 and 1:100 aerosol dilutions. As in-house studies have shown no significant difference in the deposition rate over time for 3R4F and Vype ePen (unpublished data), the aerosol mass delivered during the 60 min cytotoxicity assessment was estimated by multiplying the 15 min results by four based on the assumption that deposition was linear over time. Each QCM experiment yielded three readings and was conducted 4–6 times.
Quantification of deposited nicotine at theexposure interface
Nicotine depositions were assessed in parallel with QCM mass assessments using ultra-high performance liquid chromatography triple quad mass spectrometry (UPLC-MS/MS), based on the methods described by Onoue et al. (Citation2011) and Jin et al. (Citation2012). In brief, the QCM crystal was removed from its housing and transferred into flasks containing 3 mL HPLC grade methanol. An internal standard of d4-nicotine (Sigma-Aldrich, Poole, UK) at a final concentration of 10 ng/mL was added to all standards and QCM samples. Thirty microliters of d4-nicotine was added to each flask (10 μl/mL sample) and agitated for at least 30 min at 160 rpm to remove the deposited nicotine from the quartz crystal surface. One milliliter of the crystal extract was removed and condensed with an Eppendorf Concentrator 5301 (Eppendorf, Rotselaar, Belgium) for 80 min at 30 °C. The condensed extracts were resuspended in 1 mL of 5% acetonitrile (vol:vol) in water and 1 mL of this sample transferred into a GC vial. Nicotine was quantified using a Waters Acquity UPLC (Waters, Milford, MA) connected to an AB Sciex 4000 Qtrap MS/MS using Analyst software (Sciex, Warrington, UK). An Acquity UPLC HSS C18 column (particle size 1.7 μm, column size 2.1 × 50 mm) was used and the column temperature was maintained at 40 °C. The standards and samples were resolved using a gradient mobile phase consisting of 5 mM ammonium acetate and acetonitrile with a flow rate of 0.5 mL/min. The accuracy was evaluated by comparing the sample peak heights to a calibration curve of known nicotine concentrations ranging from 1 to 1000 ng/mL internal standard. The acceptance criteria for the accuracy of the calibration curve was 100 ± 20%. The LOD and LOQ were determined from standard deviation values of the signal to noise ratio of the calibration curve greater than or equal to 3:1 and 10:1, respectively. Absolute values of nicotine were calculated by multiplying the results in ng/mL by 3 (extraction volume). These values were divided by the crystal’s visible surface area (3.8 cm2) and by a further 1000 to present nicotine per puff per area (μg/cm2).
Cell exposure to tobacco smoke and e-cigarette aerosols
Cells were transitioned to the ALI by removing the medium covering the apical side of the cell culture. Three culture inserts were then transferred into each aerosol exposure chamber () and exposed for 60 min per dilution. During exposure, cell cultures were maintained at 37 °C and maintained basally with DMEM containing 50 U/mL penicillin and 50 μg/mL streptomycin, at a flow rate of 2 mL/min.
As an ALI control, cultures were returned to the incubator after removal of the medium on the apical side. As an air control, cultures were exposed to an intermittent flow of filtered laboratory air in an exposure chamber, at a frequency and volume identical to those for aerosol exposure. An incubator control was included in which cells remained submerged in the culture medium at 37 °C with 5% CO2 throughout the exposure.
Following exposure, cell culture inserts were transferred back to fresh 12-well culture plates containing 1 mL supplemented UltraCULTURE™ pre-warmed to 37 °C, with 0.5 mL supplemented UltraCULTURE™ added to the apical surface of each culture insert. The cells were incubated for a further 24 h at 37 °C with 5% CO2 in a humidified atmosphere. Each exposure was conducted 6–8 times with three culture inserts per experiment.
Cell viability assessment
Cell viability was measured with the neutral red uptake assay 24 h after aerosol exposure. The neutral red uptake assay protocol has been described previously (Azzopardi et al., Citation2015) and was based on the guidelines set out by the National Institute of Environmental Health Sciences and National Institutes of Health (2001). In brief, culture medium was removed and the cells on culture inserts were washed twice with PBS. On the apical side, 0.5 mL neutral red dye (0.05 g/L in UltraCULTURE™; Sigma-Aldrich, Poole, UK) was added to the culture inserts and 1 mL was added to the basal side. The cells were incubated for 3 h at 37 °C with 5% CO2 in a humidified atmosphere to allow active uptake of the dye into viable cell lysosomes. To remove unincorporated dye, the cells were washed twice with PBS and any residual PBS was removed. Neutral red was eluted from cells by incubation with 500 μL destain solution (50% ethanol, 49% distilled water and 1% glacial acetic acid [vol:vol:vol; Sigma-Aldrich, Poole, UK]) and shaken gently for 10 min at 300 rpm. Two 100 μL aliquots of each Transwell® eluate were transferred to a 96-well plate and read on a microplate spectrophotometer at 540 nm (OD540) using a reference filter of 630 nm. Background OD540 measurements from blank culture inserts were subtracted from the OD540 values of the untreated and treated cells. Cell viability levels of treated cultures were expressed as a percentage of that in the air control.
Statistical analysis
The relationship between aerosol concentration and particulate deposition QCM data was studied using a linear model in SAS version 9.3 (SAS Institute Inc., Cary, NC). Slopes of the responses for different products and regimes were compared using ANOVA with the MIXED procedure and accounting for heteroscedasticity among products through the GROUP option. Concentration was inversely transformed to favor linearity. Graphs were generated using JMP version 11 (SAS). Data are reported as means and 95% confidence intervals of the fit, represented by the shaded region. Experiments were represented in the graphs by the individual points.
Cell viability data were modeled using a four-parameter sigmoid dose–response curve with a variable slope, and the half maximum effective concentration (EC50) values determined. Comparisons between groups’ EC50 were undertaken using the F-test. Sigmoid dose–response curves and EC50 values were generated using GraphPad Prism version 6.01 (GraphPad Software, La Jolla, CA). Cell viability of 3R4F mainstream smoke and ePen aerosol with respect to aerosol dilution, deposited mass and nicotine were also studied by comparing the slopes of the linear regions of their responses using ANOVA. Linear regions were achieved by logarithmic transformation of the independent variables and sequentially removing higher doses by product. Graphs of the linear regions were generated using JMP version 11. A significance level of p < .05 was used across all statistical tests.
Results
Generation of e-cigarette aerosol and delivery to the in vitro exposure chamber
We were able to generate and deliver e-cigarette aerosols using different regimens and different products by employing an exposure system that is traditionally used to generate smoke from conventional cigarette products. displays the mass deposited on the QCMs from the Vype eStick and ePen e-cigarettes tested at both modified ISO and CORESTA (CORESTA, Citation2015) puffing regimens, at dilutions between 1:40 and 1:5 over a 15 min exposure.
Figure 4. Deposited mass concentration of Vype eStick and Vype ePen e-cigarette aerosol generated over 15 minutes under two different regimens and various dilutions between 1:40 and 1:5 aerosol:air vol:vol, as quantified by quartz crystal microbalances within the in vitro exposure chamber. Data are represented as means and 95% confidence intervals of the fit, represented by the shaded region. Experiments were represented in the graphs by the individual points (n = 4 – 6 exposures per dilution). Abbreviations – HCI: Health Canada intense; ISO: International Organization for Standardization.
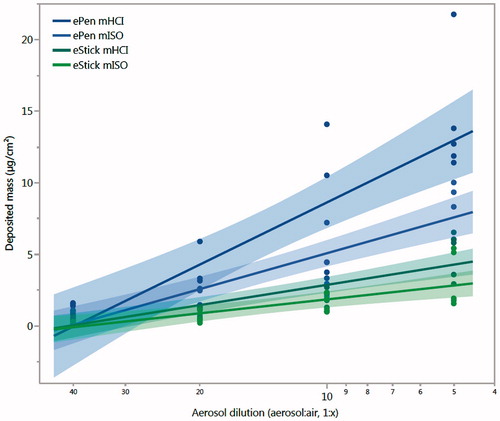
A dose–response was observed for all products, with deposition increasing as dilutions reduced. More aerosol was deposited with the modified HCI regimen than with the modified ISO regimen for both products. All slopes differed significantly from each other except those for the Vype eStick-modified ISO and modified HCI (p = .06). displays the range of mass deposition for eStick and ePen over the 15 min exposure period.
Table 3. Deposited eStick and ePen aerosol mass generated from a 15 minute exposure using modified ISO and HCI puffing regimens.
Quantification of deposited mass and nicotine at the exposure interface
To enable the cytotoxicity data to be expressed on a deposited mass and nicotine basis, the mass delivered to the cells over the 60 min exposure period was estimated by measuring the deposited 3R4F aerosol mass at dilutions 1:2500–1:30 and Vype ePen at 1:100 and 1:2 (to expand the 1:40–1:5 range) under the modified HCI regimen. displays the deposited mass for these dilutions and for the 3R4F exposure at dilutions of 1:2500–1:30. There was a statistical difference between the ePen and 3R4F slopes (p < .0001). The 15 min 1:5000 3R4F dilution deposited mass measurement was outside the detection range of the QCM and, therefore, an estimate of the deposited mass was used in the analysis. Estimates were calculated based on the relationship between deposited mass and aerosol concentration (inverse of dilution ratio) using a linear fit model (R2 = .99), which yielded an estimated 0.77 μg/cm2.
Figure 5. Estimated mass (a) and nicotine (b) deposition of Vype ePen e-cigarette aerosol and 3R4F reference cigarette smoke generated over 60 minutes under modified and standard HCI regimens and various dilutions between 1:100 – 1:2 aerosol:air, vol:vol and 1:2500 – 1:30 smoke:air, vol:vol, respectively, as quantified by quartz crystal microbalances within the in vitro exposure chamber. Experiments are represented by the individual points (n = 4–6). Abbreviation – HCI: Health Canada Intense.
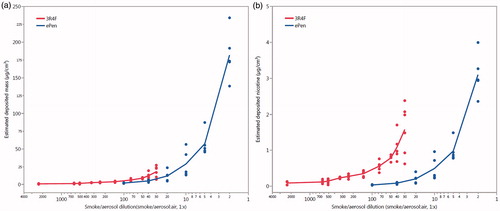
QCM and nicotine deposition data at dilutions 1:40, 1:20, 1:10 and 1:5 ( (ePen); other data not shown) were used to calculate the percentage of deposited nicotine to deposited mass. The average calculated deposited nicotine for 3R4F and ePen was 8.7 ± 1.5% and 1.7 ± 0.8%, respectively, of the total mass delivered to the QCM surface. This approximates well to the 7.5% nicotine (based on nicotine free dry particulate matter mass) for 3R4F smoked under HCI conditions (Eldridge et al., Citation2015) and 1.8% nicotine of the Vype ePen formulation (). The calculated percentages were applied to the 60 min deposited mass values to estimate deposited nicotine over the exposure period (). There was a statistical difference between the ePen and the 3R4F slopes (p < .0001). These data allowed the cytotoxicity results to be expressed as estimated deposited nicotine. displays the estimated range of mass and nicotine deposition for 3R4F and ePen over the 60 min cytotoxicity exposures.
Table 4. Estimated deposited 3R4F and ePen smoke/aerosol and nicotine mass generated using the standard and modified HCI regimens respectively.
Cell viability assessment
The NCI-H292 cells showed significantly reduced viability after direct exposure to 3R4F aerosol at the ALI compared with that after exposure to Vype ePen aerosol (). On an aerosol dilution basis (), the Vype ePen aerosol was significantly (97%) less cytotoxic than 3R4F aerosol (EC50 1:5 vs. 1:153 aerosol:air, vol:vol).
Figure 6. Changes in NCI-H292 cell viability (% of the air control) after exposure to various dilutions (Smoke/aerosol:air, vol:vol) of Vype ePen e-cigarette aerosol (n = 6 exposures per dilution) and 3R4F cigarette smoke (n = 8 exposures per dilution). Data are expressed according to (a) aerosol dilution (ePen EC50 = 1:5, 3R4F EC50 = 1:153 smoke/aerosol:air, vol:vol), (c) estimated deposited mass (ePen EC50 = 52.1, 3R4F EC50 = 3.1 μg/cm2) and (e) estimated deposited nicotine (ePen EC50 = 0.89, 3R4F EC50 = 0.27 μg/cm2). Data are represented as means (circles) and standard deviations (bars). Regression fit of the linear regions of Vype ePen e-cigarette (n = 6) and 3R4F cigarette aerosols (n = 8) NCI-H292 cell viability curves expressed according to (b) aerosol dilution, (d) estimated deposited mass and (f) estimated deposited nicotine. Data are represented as means and 95% confidence intervals of the fit, represented by the shaded region. Experiments are represented by the individual points.
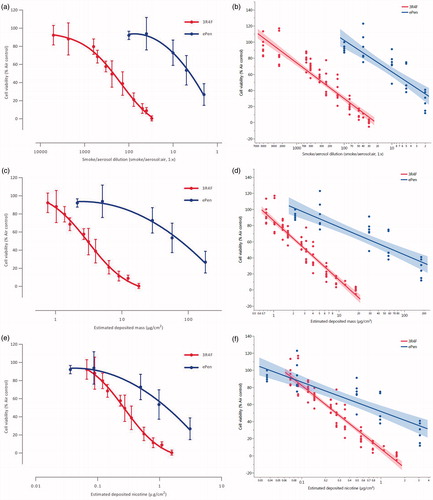
When expressed for deposited mass (), Vype ePen aerosol was significantly (94%) less cytotoxic than 3R4F aerosol (60 min deposited mass EC50 52.1 vs. 3.1 μg/cm2). Based on the estimated deposited nicotine (), the Vype ePen aerosol was significantly (70%) less cytotoxic than 3R4F aerosol (60 min estimated deposited nicotine EC50 0.89 vs. 0.27 μg/cm2). displays the 3R4F and ePen EC50 values expressed as aerosol dilution, estimated deposited aerosol mass and nicotine.
Table 5. 3R4F and ePen EC50 values expressed as smoke/aerosol dilution respectively, estimated deposited mass and estimated deposited nicotine.
The regression fit of the linear regions of dilutions, estimated deposited mass and estimated deposited nicotine by product (3R4F and ePen) are displayed in . There was no statistically significant difference between the 3R4F and ePen slopes when we expressed on an aerosol dilution basis (p = .2045), i.e. they exhibited similar trends in the response (), however, the magnitude of the response was significantly different (p < .0001) showing increased cytotoxicity for 3R4F across all dilutions. For mass and nicotine deposition, the slopes of 3R4F and ePen were statistically significant with a more pronounced cytotoxic effect for 3R4F than for ePen () as the concentration of deposited mass and nicotine increase (p < .0001).
Discussion
The adapted Borgwaldt RM20S that we used in this study had been well-characterized for in vitro exposure to combustible cigarette mainstream smoke. However, it also performed well for exposure to e-cigarette aerosols, as supported by the QCM study. The QCM results illustrated that aerosol delivery of the e-cigarettes was consistent and that dose–responses in deposited mass of different magnitudes from the two e-cigarettes “puffed” under each smoking regimen could be clearly distinguished. This was shown by significant differences between slopes of different product and regimen combinations, with the exception of the Vype eStick, where in general a trend for higher deposition from the more intense HCI regimen was observed, as would be expected based on the increased frequency of puffs with HCI. The accuracy of QCM measurement also means that we can have increased confidence that cells have been successfully exposed to test aerosols in experiments where we see negative biological results or minimal biological response to aerosol exposure. Such a scenario might be expected with next-generation nicotine delivery products, which typically have lower levels of toxicants than tobacco smoke (Margham et al., Citation2016). QCMs are a useful tool for the development and characterization of an exposure system. However, focusing on specific aerosol markers, such as nicotine or priority toxicants, for further characterization or when normalizing and interpreting biological data might further enhance insights into exposure effects. The use of dosimetry methods could facilitate the comparison of in vitro inhalation aerosol data from different laboratories and/or different aerosol generation and exposure methods.
Exposure of human bronchial epithelial cells using an in vitro ALI exposure system demonstrated that Vype ePen e-cigarette aerosol was significantly less cytotoxic than 3R4F mainstream smoke. The e-cigarette aerosol remained significantly less cytotoxic than cigarette aerosol, irrespective of whether expressed as deposited mass or estimated deposited nicotine. However, the profile and proximity of the curves changed and/or shifted ().
Our in vitro viability findings indicate similar trends to those of some other groups, which showed little or no cytotoxicity after in vitro e-cigarette exposures when compared to conventional cigarette exposures (Misra et al., Citation2014; Neilson et al., Citation2015; Romagna et al., Citation2013). Vype ePen e-cigarette aerosol was found to be significantly less cytotoxic than reference 3R4F cigarette smoke, which supports and corresponds to our e-cigarette emissions study (Margham et al., Citation2016). Margham et al. report the levels of ePen e-cigarette emissions were 92–99% lower than those from the reference 3R4F tobacco product. These measured emissions included the major e-liquid constituents nicotine, PG and VG, recognized impurities in pharmacopeia quality nicotine and eight species previously identified as thermal decomposition products of PG or VG. However, there are currently no standards for the assessment of aerosol emissions in vitro (Scheffler et al., Citation2016) and methods varied across studies. The cell type, exposure system and exposure duration can all have important effects on the results.
Dosimetry data may be used to compare results of similar in vitro biological endpoints that have been assessed under different exposure conditions. For example, it is possible to compare cytotoxicity data from our study to one previously published by Majeed et al. (Citation2014), which also included dosimetry information, despite using a different exposure method (SM 2000 smoking machine coupled with the Vitrocell® 24/48 exposure system) and cell type (BEAS-2B and A549). We estimated the % 3R4F smoke concentrations that elicited ∼50% cytotoxicity for the exposed BEAS-2B and A549 cells to be a∼10% and 15%, respectively. The corresponding TPM deposition values at 10% and 15% 3R4F smoke (i.e. the approximate EC50 values) could be calculated using the linear regression formula of their TPM deposition data. This gave approximate TPM EC50 values of 6.9 μg/cm2 and 11.9 μg/cm2, respectively, for BEAS-2B and A549 cells. These values are comparable to those observed in our study (TPM EC50 value of 3.1 μg/cm2). This example demonstrates the value of presenting deposition data with biological studies as this can facilitate the comparison of whole aerosol studies where different exposure systems and/or protocols are used.
The NCI-H292 continuous cell line used in this study does not differentiate or show many of the characteristics seen in primary cells. However, these primary cell attributes are not necessarily a requirement for cytotoxicity testing (Polosa et al., Citation2016) and NCI-H292 cells have the advantages of being relatively easy to culture, a prolonged lifespan and allow standardization across a study. This makes them an effective cell system for certain biological endpoints such as cytotoxicity. Genotoxic and inflammatory responses have been shown in this cell line, such as upregulation of oxidative DNA damage, MUC5AC and secretion of the inflammatory mediators, interleukins 6 and 8 and MMP-1 (Phillips et al., Citation2005; Thorne et al., Citation2009). These are endpoints that can easily be studied in response to e-cigarette aerosol exposures in the in vitro exposure system presented in this study.
Finally, using this in vitro exposure system, we were able to generate and deliver extreme quantities of e-cigarette aerosols to cell cultures that were likely to exceed local airway doses from daily average human consumption. This was achieved using a relatively long-exposure duration (60 minutes), an intensive regimen, low dilutions of aerosol, and a smoking machine that has the potential to deliver more aerosol than those systems that take sub-samples of the aerosol by applying a vacuum. This, although an extreme scenario, enabled us to draw an EC50 across the products tested and resulted in some cytotoxicity with e-cigarettes.
Other studies have shown some cytotoxicity or biological activity from e-cigarettes (Scheffler et al., Citation2015; Schweitzer et al., Citation2015; Yu et al., Citation2016). It is important to contextualize these results, especially when exposure duration and doses may provide nicotine exposure well above that received from typical human exposure. The use of appropriate comparators is also important, especially when assessing potential differences in risk between products from different categories. In this study, the inclusion of cigarettes allows the relative response to be presented and not just the absolute response of the e-cigarette. Negative air controls are equally important in in vitro inhalation studies of e-cigarettes as these provide context to the range of the response. In addition, it is important for the parameters, such as puff volume, duration and interval, to allow optimum performance and/or mimic real-life usage. Of importance to the accuracy of testing is that products are used in appropriate ways. Methods are well-established for conventional cigarettes, but with e-cigarettes and other next-generation products, some features might mean that aerosol is not optimally produced.
The delivery protocol used in this study aimed to elicit a response that would enable the production of a dose–response allowing the comparison of EC50 values and/or the response slopes. Thus, the cell cultures were exposed to aerosol doses much higher than would be received by human smoking over a similar period. There are limited regional deposition data for lung deposition in smokers. Ishikawa et al. (Citation2016) and Armitage et al. (Citation2004) both used exhaled smoke capture after a pre-defined cigarette smoke inhalation volume to assess regional deposition to the extra-thoracic (ET), bronchial/bronchiolar (BB/bb) and alveolar-interstitial regions of the lung as defined in ICRP Publication 66. Both studies used solanesol (C45H74O) as a particle phase marker for cigarette smoke, with Armitage et al. (Citation2004) also using nicotine. Armitage used inhalation volumes of 0, 75, 250, 500 and 1000 mL with Ishikawa using fixed volumes of 0 and 150 mL and “normal” inhalation (∼500–1000 mL (Bernstein, Citation2004)).
For the bronchial (BB/bb) region of most physiological interest, regional deposition fractions are 0.224 (150 mL depth – Ishikawa et al., Citation2016) and 0.238 (75 mL depth – Armitage et al., Citation2004) for tar and 0.434 for nicotine. Average mouth level exposure to tar and nicotine has been measured by a number of authors, most comprehensively by Mariner et al. (Citation2011) in an 8-country survey using over 80,000 cigarette filters from 5581 subjects. Mean mouth level exposures were 13.9 mg per cigarette and 261 mg per day for tar and 1.31 mg per cigarette and 24.7 mg per day for nicotine.
Assuming a bronchial/bronchiolar deposition fraction of 0.231 for tar and 0.434 for nicotine with a surface area of 2690 cm2 (ICRP, Citation1994), we can calculate predicted tar and nicotine dose. Thus, predicted tar dose equals 1.19 μg/cm2 per cigarette and 22.4 μg/cm2 per day, consistent with the in vitro test dose range of 0.82–18.1 μg/cm2 measured in this study. Similarly, predicted nicotine dose equals 0.21 μg/cm2 per cigarette and 4.0 μg/cm2 per day, consistent with the in vitro test dose range of 0.07–1.58 μg/cm2 measured in this study.
Airway doses for e-cigarette aerosol are more challenging. Experimentally, the exhale capture technique used for cigarette smoke will under-predict particle mass losses as the aerosol accretes significant masses of water due to hygroscopic growth, and will over-predict particle number loss, as most of these losses occur during early coagulation in the mouth (Pichelstorfer et al., Citation2016). St Helen et al. (Citation2016) measured total lung deposition in 13 volunteers using a different e-cigarette with median deposition fractions of 0.948, 0.983 and 0.996 for glycerol, propylene glycol and nicotine respectively; no regional deposition data were available. Modeled predictions (Manigrasso et al., Citation2015; Sahu et al., Citation2013; Sosnowski & Kramek-Romanowska, Citation2016) of regional deposition are also subject to large uncertainties as they cannot currently account for the dynamic behavior.
Dautzenberg & Bricard (Citation2015) analyzed e-cigarette puffing behavior from 185 users across 116 days using a different e-cigarette from those used in this study but reported a median and 85%ile usage of 140 and 300 puffs per day respectively. Applying these data and an aerosol mass per puff of 2–5 mg at 2% nicotine inclusion suggests median daily mouth level exposures of 280–700 mg aerosol mass and 5.6–14 mg nicotine.
In the absence of data for regional deposition fraction, assuming a worst case bronchial/bronchiolar deposition fraction of 1.0 for aerosol mass and nicotine with a surface area of 2690 cm2 (ICRP, Citation1994), we can calculate predicted total aerosol and nicotine doses. Thus, predicted aerosol dose equals 104–260 μg/cm2 per day, consistent with the in vitro test dose range of 2.0–182 μg/cm2 measured in this study. Similarly, predicted nicotine dose equals 2.1–5.2 μg/cm2 per day, consistent with the in vitro test dose range of 0.04–3.1 μg/cm2 measured in this study. However, it is highly likely that the regional deposition fraction would be significantly lower than 1.0.
The approach used in this study of using extreme exposure conditions for next-generation nicotine products potentially enables the comparison of different products, especially between those with a disparity in their biologically active ranges. The use of extreme conditions increases the likelihood of eliciting a response, potentially allowing for small effects to be observed that would otherwise be missed or represented as no result and also allowing comparisons to combustible cigarettes via EC50 values. When using this approach, however, experimental exposure condition should be contextualized to real-life usage.
To further understand exposure during real-life smoking and vaping, for which behaviors differ substantially from person to person, studies must be undertaken to investigate the effects of vaping topography (Behar et al., Citation2015; Farsalinos et al., Citation2013). These studies are also important as they allow suitable puffing regimens to be determined for in vivo and in vitro testing of next-generation nicotine products, and the constant evolution of these products are important for the ongoing assessment of the appropriateness of these regimens.
While this initial study only focused on one biological endpoint, it demonstrated the usefulness and versatility of this exposure system for the assessment of new product types, a greater understanding of e-cigarette aerosols and gives a good indication of e-cigarette aerosol toxicity relative to tobacco smoke. Further in vitro studies incorporating aerosol exposures, harnessing the advancement of tissue engineering, use of 3D tissue models, fluidics and/or 3D printing incorporated with multi-endpoint analysis incorporating other biological endpoints such as protein and gene expression, and broader global omics approaches can provide researchers with invaluable data to support the assessment of novel vapor products. Our cytotoxicity approach and other in vitro endpoints may require further evaluation to confirm fit-for-purpose, supported by method standardization and harmonization approaches to ensure robustness and rigor in support of a weight-of-evidence approach. These in vitro tests, along with chemical analyses (Margham et al., Citation2016), could provide results that would form the basis of a larger package of tests, including clinical studies, to help assess the safety of current and next generation nicotine and tobacco products.
Conclusions
It was possible to adapt an exposure system that is traditionally used to generate aerosols from conventional cigarette products to successfully generate, dilute and deliver e-cigarette aerosols to cell cultures. In addition, by measuring both deposited mass and nicotine, we have been able to assess and compare these dosimetric parameters for both aerosols, and to use these data to further interpret and contextualize the cytotoxicity assay results. Under the conditions tested, Vype ePen e-cigarette aerosol was significantly less cytotoxic than reference 3R4F cigarette smoke, which supports and corresponds to our e-cigarette emissions study (Margham et al., Citation2016). The cytotoxicity that was seen, however, must be considered in the context of the exposure conditions of this study (cell type, exposure duration, machine regimens and aerosol dilutions). We only saw cytotoxicity from the e-cigarette aerosol when we used the lowest possible aerosol dilutions and an intensive puffing regimen which generated doses comparable to estimates of those received by consumers over the course of a day. The conservative approach we took suggests that it is unlikely that normal vaping use would yield cytotoxic effects near to those reported here.
Acknowledgements
We would like to thank Rachel Ashton for her assistance in editing the paper, Damien Breheny for reviewing the paper, Eleni Mavropoulou for her assistance with statistical analysis, Carl Vas for his guidance with e-cigarette science and technology, Andrew Baxter for his technical input specifically on the nicotine method and Mark Barber of Borgwaldt KC GmbH for his technical knowledge of the Borgwaldt RM20S exposure system.
Disclosure statement
The authors are employees of British American Tobacco (BAT). Nicoventures Ltd., UK, is a wholly-owned subsidiary of British American Tobacco.
Funding
This study was funded by BAT.
References
- Adamson J, Azzopardi D, Errington G, et al. (2011). Assessment of an in vitro whole cigarette smoke exposure system: the Borgwaldt RM20S 8-syringe smoking machine. Chem Cent J 5:50–60.
- Adamson J, Hughes S, Azzopardi D, et al. (2012). Real-time assessment of cigarette smoke particle deposition in vitro. Chem Cent J 6:98.
- Adamson J, Thorne D, Errington G, et al. (2014). An inter-machine comparison of tobacco smoke particle deposition in vitro from six independent smoke exposure systems. Toxicol In Vitro 28:1320–8.
- Adamson J, Thorne D, McAughey J, et al. (2013). Quantification of cigarette smoke particle deposition in vitro using a triplicate quartz crystal microbalance exposure chamber. Biomed Res Int 2013:685074.
- Armitage AK, Dixon M, Frost BE, et al. (2004). The effect of inhalation volume and breath-hold duration on the retention of nicotine and solanesol in the human respiratory tract and on subsequent plasma nicotine concentrations during cigarette smoking. Beitr Tabakforsch Int 4:240–9.
- Azzopardi D, Haswell LE, Foss-Smith G, et al. (2015). Evaluation of an air-liquid interface cell culture model for studies on the inflammatory and cytotoxic responses to tobacco smoke aerosols. Toxicol In Vitro 29:1720–8.
- Baker RR, Lewis LS. (2001). A review of the incidence and consequences of cigarette filter vent blocking among smokers. Beitr Tabakforsch Int 4:209–28.
- Behar RZ, Davis B, Wang Y, et al. (2014). Identification of toxicants in cinnamon-flavored electronic cigarette refill fluids. Toxicol In Vitro 28:198–208.
- Behar RZ, Hua M, Talbot P. (2015). Puffing topography and nicotine intake of electronic cigarette users. PLoS One 10:e0117222.
- Bernstein DM. (2004). A review of the influence of particle size, puff volume, and inhalation pattern on the deposition of cigarette smoke particles in the respiratory tract. Inhal Toxicol 16:675–89.
- Bombick DW, Bombick BR, Ayres PH, et al. (1997). Evaluation of the genotoxic and cytotoxic potential of mainstream whole smoke and smoke condensate from a cigarette containing a novel carbon filter. Fundam Appl Toxicol 39:11–7.
- Breheny D, Cunningham F, Kilford J, et al. (2014). Application of a modified gaseous exposure system to the in vitro toxicological assessment of tobacco smoke toxicants. Environ Mol Mutagen 55:662–72.
- Borgwaldt, Smoking Machine RM20S. Available from: http://borgwaldt.hauni.com/en/instruments/smoking-machines/rotary/smoking-machine-rm20s.html [last accessed 1 June 2016].
- Brunnemann KD, Yu L, Hoffmann D. (1977). Assessment of carcinogenic volatile n-nitrosamines in tobacco and in mainstream and sidestream smoke from cigarettes. Cancer Res 37:3218–22.
- Bullen C, McRobbie H, Thornley S, et al. (2010). Effect of an electronic nicotine delivery device (e cigarette) on desire to smoke and withdrawal, user preferences and nicotine delivery: randomised cross-over trial. Tob Control 19:98–103.
- Burns DM, Dybing E, Gray N, et al. (2008). Mandated lowering of toxicants in cigarette smoke: a description of the World Health Organization TobReg proposal. Tob Control 17:132–41.
- Caldwell B, Sumner W, Crane J. (2012). A systematic review of nicotine by inhalation: is there a role for the inhaled route? Nicotine Tob Res 14:1127–39.
- Callahan-Lyon P. (2014). Electronic cigarettes: human health effects. Tob Control 23:ii36–40.
- Chen IL. (2013). FDA summary of adverse events on electronic cigarettes. Nicotine Tob Res 15:615–6.
- Cheng T. (2014). Chemical evaluation of electronic cigarettes. Tob Control 23:ii11–17.
- Colard S, Verron T, Julien R, et al. (2014). Relationship between cigarette yields and smoking time under different machine smoking regimes. Beitr Tabakforsch Int 26:4–18.
- CORESTA. (2015). CORESTA recommended method No 81. Routine analytical machine for e-cigarette aerosol generation and collection – Definitions and Standard Conditions. CRM No 81. Available from: https://www.coresta.org/sites/default/files/technical_documents/main/CRM_81.pdf [last accessed 20 July 2016].
- Côté F, Létourneau C, Mullard G, Voisine R. (2011). Estimation of nicotine and tar yields from human-smoked cigarettes before and after the implementation of the cigarette ignition propensity regulations in Canada. Reg Tox Pharm 61:S51–S9.
- Dautzenberg B, Bricard D. (2015). Real-time characterization of e-cigarettes use: the 1 million puffs study. J Addict Res Ther 6:2.
- Digard H, Proctor C, Kulasekaran A, et al. (2013). Determination of nicotine absorption from multiple tobacco products and nicotine gum. Nicotine Tob Res 15:255–61.
- Eldridge A, Betson TR, Vinicius Gama M, McAdam K. (2015). Variation in tobacco and mainstream smoke toxicant yields from selected commercial cigarette products. Regul Toxicol Pharmacol 71:409–27.
- European Commission. (2015). Special Eurobarometer 429: attitudes of Europeans towards tobacco and electronic cigarettes. Brussels: European Commission, 2015. Available from: http://ec.europa.eu/public_opinion/archives/ebs/ebs_429_en.pdf [last accessed 1 June 2016].
- European Commission. (2014). Directive 2014/40/EU of the European Parliament and of the Council. Available from: http://ec.europa.eu/health/tobacco/docs/dir_201440_en.pdf [last accessed 1 June 2016].
- Fagerström KO, Schildt EB. (2003). Should the European Union lift the ban on snus? Evidence from the Swedish experience. Addiction 98:1191–5.
- Farsalinos KE, Romagna G, Tsiapras D, et al. (2013). Evaluation of electronic cigarette use (vaping) topography and estimation of liquid consumption: implications for research protocol standards definition and for public health authorities' regulation. Int J Environ Res Public Health 10:2500–14.
- Farsalinos KE, Spyrou A, Tsimopoulou K, et al. (2014). Nicotine absorption from electronic cigarette use: comparison between first and new-generation devices. Sci Rep 4:4133.
- Farsalinos KE, Voudris V, Poulas K. (2015). E-cigarettes generate high levels of aldehydes only in 'dry puff' conditions. Addiction 110:1352–6.
- Flick DA, Gonzalez-Rothi RJ, Ocie Harris J, Gifford GE. (1985). Rat lung macrophage tumor cytotoxin production: impairment by chronic in vivo cigarette smoke exposure. Cancer Res 45:5225–9.
- Food and Drug Administration (FDA). (2012). Guidance for industry and FDA staff: “harmful and potentially harmful constituents” in tobacco products as used in Section 904(e) of the Federal Food, Drug, and Cosmetic Act. Federal Register, Vol. 77, No. 64. Available from: http://www.fda.gov/downloads/TobaccoProducts/Labeling/RulesRegulationsGuidance/UCM297981.pdf [last accessed 1 June 2016].
- Food and Drug Administration (FDA). (2013). Section 918 Report to Congress: innovative products and treatments to achieve abstinence from tobacco use, reductions in consumption of tobacco, and reductions in the harm associated with continued tobacco use. Available from: http://www.fda.gov/downloads/drugs/guidancecomplianceregulatoryinformation/ucm348930.pdf [last accessed 12 July 2016].
- Food and Drug Administration (FDA). (2016). Deeming tobacco products to be subject to the Federal Food, Drug, and Cosmetic Act, as Amended by the Family Smoking Prevention and Tobacco Control Act; Restrictions on the sale and distribution of tobacco products and required warning statements for tobacco products; Final Rule. Federal Register, Vol. 81, No. 90. Available from: https://www.gpo.gov/fdsys/pkg/FR-2016-05-10/pdf/2016-10685.pdf [last accessed 1 June 2016].
- Forster M, Liu C, Duke MG, et al. (2015). An experimental method to study emissions from heated tobacco between 100-200 °C. Chem Cent J 9:20.
- Garcia-Canton C, Errington G, Anadon A, Meredith C. (2014). Characterisation of an aerosol exposure system to evaluate the genotoxicity of whole mainstream cigarette smoke using the in vitro γH2AX assay by high content screening. BMC Pharmacol Toxicol 15:41.
- Gminski R, Tang T, Mersch-Sundermann V. (2010). Cytotoxicity and genotoxicity in human lung epithelial A549 cells caused by airborne volatile organic compounds emitted from pine wood and oriented strand boards. Toxicol Lett 196:33–41.
- Goniewicz ML, Knysak J, Gawron M, et al. (2014). Levels of selected carcinogens and toxicants in vapour from electronic cigarettes. Tob Control 23:133–9.
- Goniewicz ML, Lingas EO, Hajek P. (2013). Patterns of electronic cigarette use and user beliefs about their safety and benefits: an internet survey. Drug Alcohol Rev 32:133–40.
- Hajek P, Goniewicz ML, Phillips A, et al. (2015). Nicotine intake from electronic cigarettes on initial use and after 4 weeks of regular use. Nicotine Tob Res 17:175–9.
- Health Canada. (1999). Official Method T-115 – Determination of “tar”, nicotine and carbon monoxide yields in mainstream smoke. Ottawa, QC: Health Canada. Available from: http://www.qp.gov.bc.ca/stat_reg/regs/health/oic_94.pdf [last accessed 1 June 2016].
- Health Canada. (2004). Official method T-503 – in vitro micronucleus assay for mainstream tobacco smoke. Ottawa, QC: Health Canada.
- Hiscock R, Goniewicz ML, McEwen A, et al. (2014). E-cigarettes: online survey of UK smoking cessation practitioners. Tob Induc Dis 12:13.
- Hoffmann D, Wynder EL. (1967). The reduction of the tumorigenicity of cigarette smoke condensate by addition of sodium nitrate to tobacco. Cancer Res 27:172–4.
- International Commission on Radiological Protection (ICPR). (1994). ICRP publication 66: human respiratory tract model for radiological protection; Elsevier health sciences. Ann ICRP 24:1–3.
- Ishikawa S, Suzuki T, Nagata Y. (2016). Analysis of cigarette smoke deposition within an in vitro exposure system for simulating exposure in the human respiratory tract. Beitr Tabakforsch Int 27:20–9.
- Iskandar AR, Martin F, Talikka M, et al. (2013). Systems approaches evaluating the perturbation of xenobiotic metabolism in response to cigarette smoke exposure in nasal and bronchial tissues. BioMed Res Int 2013:512086.
- ISO. (1999). International Standard ISO 3402. Tobacco and tobacco products – Atmosphere for conditioning and testing. Geneva, Switzerland: International Organization for Standardization. Available from: http://www.iso.org/iso/catalogue_detail.htm?csnumber=28324 [last accessed 1 June 2016].
- ISO. (2000). International Standard ISO 4387. Cigarettes – Determination of total and nicotine-free dry particulate matter using routine analytical smoking machine. Geneva, Switzerland: International Organization for Standardization. Available from: http://www.iso.org/iso/iso_catalogue/catalogue_tc/catalogue_detail.htm?csnumber=28323 [last accessed 1 June 2016].
- ISO. (2012). International Standard ISO 3308. Routine analytical cigarette-smoking machine – Definitions and standard conditions. Geneva, Switzerland: International Organization for Standardization. Available from: http://www.iso.org/iso/iso_catalogue/catalogue_tc/catalogue_detail.htm?csnumber=60404 [last accessed 1 June 2016].
- Jackson KJ, Schroeder MJ, Hoffman AC. (2016). Mouth level exposure and similarity to machine-smoked constituent yields. Tob Regul Sci 2:3–8.
- Jin M, Earla R, Shah A, et al. (2012). A LC-MS/MS method for concurrent determination of nicotine metabolites and role of CYP2A6 in nicotine metabolism in U937 macrophages: implications in oxidative stress in HIV + smokers. J Neuroimmune Pharmacol 7:289–99.
- Kaur N, Lacasse M, Roya J-P, et al. (2010). Evaluation of precision and accuracy of the Borgwaldt RM20S(®) smoking machine designed for in vitro exposure. Inhal Toxicol 22:1174–83.
- Medicines and Healthcare products Regulatory Agency (MHRA). (2010). Nicotine replacement therapy and harm reduction. Drug Safety Update 3:6. Available at: https://www.gov.uk/drug-safety-update/nicotine-replacement-therapy-and-harm-reduction [last accessed 12 July 2016].
- Majeed S, Frentzel S, Wagner S, et al. (2014). Characterization of the Vitrocell® 24/48 in vitro aerosol exposure system using mainstream cigarette smoke. Chem Cent J 8:62.
- Manigrasso M, Buonanno G, Stabile L, et al. (2015). Particle doses in the pulmonary lobes of electronic and conventional cigarette users. Environ Pollut 202:24–31.
- Margham J, McAdam K, Forster M, et al. (2016). Chemical composition of an e-cigarette aerosol ? a quantitative comparison with cigarette smoke. Chem Res Toxicol. doi: 10.1021/acs.chemrestox.6b00188.
- Mariner DC, Ashley M, Shepperd CJ, et al. (2011). Mouth level smoke exposure using analysis of filters from smoked cigarettes: a study of eight countries. Regul Toxicol Pharmacol 61:S39–S50.
- Misra M, Leverette RD, Cooper BT, et al. (2014). Comparative in vitro toxicity profile of electronic and tobacco cigarettes, smokeless tobacco and nicotine replacement therapy products: e-liquids, extracts and collected aerosols. Int J Environ Res Public Health 11:11325–47.
- Neilson L, Mankus C, Thorne D, et al. (2015). Development of an in vitro cytotoxicity model for aerosol exposure using 3D reconstructed human airway tissue; application for assessment of e-cigarette aerosol. Toxicol In Vitro 29:1952–62.
- Nutt DJ, Phillips LD, Balfour D, et al. (2014). Estimating the harms of nicotine-containing products using the MCDA approach. Eur Addict Res 20:218–25.
- Onoue S, Yamamoto N, Seto Y, Yamada S. (2011). Pharmacokinetic study of nicotine and its metabolite cotinine to clarify possible association between smoking and voiding dysfunction in rats using UPLC/ESI-MS. Drug Metab Pharmacokinet 26:416–22.
- Palipudi KM, Mbulo L, GATS Collaborative Group, et al. (2016). Awareness and current use of electronic cigarettes in Indonesia, Malaysia, Qatar, and Greece: findings from 2011-2013 global adult tobacco surveys. Nicotine Tob Res 18:501–7.
- Paur H-R, Cassee FR, Teeguarden J, et al. (2011). In vitro cell exposure studies for the assessment of nanoparticle toxicity in the lung—a dialog between aerosol science and biology. J Aerosol Sci 42:668–92.
- Pepper J, Brewer N. (2014). Electronic nicotine delivery system (electronic cigarette) awareness, use, reactions and beliefs: a systematic review. Tob Control 23:375–84.
- Phillips J, Kluss B, Richter A, Massey ED. (2005). Exposure of bronchial epithelial cells to whole cigarette smoke: assessment of cellular responses. Altern lab Anim 33:239–48.
- Pichelstorfer L, Hofmann W, Winkler-Heil R, et al. (2016). Simulation of aerosol dynamics and deposition of combustible and electronic cigarette aerosols in the human respiratory tract. J Aerosol Sci 99:125–32.
- Polosa R, Caruso M, Guarino F. (2016). Comments on Scheffler et al. cytotoxic evaluation of e-liquid aerosol using different lung derived cell models. Int J Environ Res Public Health 13:108.
- Public Health England. (2015). E-cigarettes: an evidence update: a report commissioned by Public Health England. Available from: https://www.gov.uk/government/uploads/system/uploads/attachment_data/file/457102/Ecigarettes_an_evidence_update_A_report_commissioned_by_Public_Health_England_FINAL.pdf [last accessed 1 June 2016].
- Purkis SW, Troude V, Hill CA. (2013). Effect of puffing intensity on cigarette smoke yields. Regul Toxicol Pharmacol. 66:72–82.
- Rickert WS, Trivedi AH, Momin RA, et al. (2007). Effect of smoking conditions and methods of collection on the mutagenicity and cytotoxicity of cigarette mainstream smoke. Toxicol Sci. 96:285–93.
- Rodgman A, Perfetti TA. (2013). The chemical components of tobacco and tobacco smoke. 2nd ed. Boca Raton, (FL): CRC Press.
- Rodu B, Godshall WT. (2006). Tobacco harm reduction: an alternative cessation strategy for inveterate smokers. Harm Reduct J 3:37.
- Romagna G, Allifranchini E, Bocchietto E, et al. (2013). Cytotoxicity evaluation of electronic cigarette vapor extract on cultured mammalian fibroblasts (ClearStream-LIFE): comparison with tobacco cigarette smoke extract. Inhal Toxicol 25:354–61.
- Royal College of Physicians. (2016). Nicotine without smoke, Tobacco harm reduction, A report by the Tobacco Advisory Group of the Royal College of Physicians, April 28 2016, ISBN 978-1-86016-600-6 eISBN 978-1-86016-601-3. Available from: https://www.rcplondon.ac.uk/sites/default/files/media/Documents/Nicotine%20without%20smoke_0.pdf?token=uV0R0Twz [last accessed 1 June 2016].
- Sahu SK, Tiwari M, Bhangare RC, Pandit GG. (2013). Particle size distribution of mainstream and exhaled cigarette smoke and predictive deposition in human respiratory tract. Aerosol Air Qual Res 13:324–32.
- Sangani RG, Ghio AJ. (2011). Lung injury after cigarette smoking is particle related. Int J Chron Obstruct Pulmon Dis 6:191–8.
- Scheffler S, Dieken H, Krischenowski O, Aufderheide M. (2015). Cytotoxic evaluation of e-liquid aerosol using different lung-derived cell models. Int J Environ Res Public Health 12:12466–74.
- Scheffler S, Dieken H, Krischenowski O, Aufderheide M. (2016). Response to Polosa et al. Comments on Scheffler et al. Cytotoxic Evaluation of E-Liquid Aerosol Using Different Lung Derived Cell Models. Int. J. Environ. Res. Public Health, 2015, 12, 12466-12474. Int J Environ Res Public Health 13:109. doi: 10.3390/ijerph13010109.
- Schmid A, Baumlin N, Ivonnet P, et al. (2015). Roflumilast partially reverses smoke-induced mucociliary dysfunction. Respir Res 16:135.
- Schoenborn CA, Gindi RM. “Electronic Cigarette Use Among Adults: United States, 2014,” National Center on Health Statistics (NCHS) Data Brief, No. 217, October 2015. Available from: http://www.cdc.gov/nchs/data/databriefs/db217.pdf [last accessed 1 June 2016].
- Schroeder MJ, Hoffman AC. (2014). Electronic cigarettes and nicotine clinical pharmacology. Tob Control 23:ii30–5.
- Schweitzer K, Chen S, Law S, et al. (2015). Endothelial disruptive proinflammatory effects of nicotine and e-cigarette vapor exposures. Am J Physiology Lung Cell Mol Physiol 309:175–87.
- Sosnowski TR, Kramek-Romanowska K. (2016). Predicted deposition of e-cigarette aerosol in the human lungs. J Aerosol Med Pulm Drug Deliv 29:299–309.
- St Helen G, Havel C, Dempsey DA, et al. (2016). Nicotine delivery, retention and pharmacokinetics from various electronic cigarettes. Addiction 111:535–44.
- Thorne D, Adamson J. (2013). A review of in vitro cigarette smoke exposure systems. Exp Toxicol Pathol 65:1183–93.
- Thorne D, Dalrymple A, Dillon D, et al. (2015). A comparative assessment of cigarette smoke aerosols using an in vitro air–liquid interface cytotoxicity test. Inhal Toxicol 27:629–40.
- Thorne D, Wilson J, Kumaravel TS, et al. (2009). Measurement of oxidative DNA damage induced by mainstream cigarette smoke in cultured NCI-H292 human pulmonary carcinoma cells. Mutat Res 673:3–8.
- University of Kentucky: 3R4F reference cigarette. Available from: https://ctrp.uky.edu/resources/pdf/webdocs/3R4F%20Preliminary%20Analysis.pdf [last accessed 1 June 2016].
- Unwalla H, Ivonnet P, Dennis JS, et al. (2015). Transforming growth factor-b1 and cigarette smoke inhibit the ability of b2-agonists to enhance epithelial permeability. Am J Respir Cell Mol Biol 52:65–74.
- US Department of Health and Human Services. (2010). Surgeon General’s report – how tobacco smoke causes disease: the biology and behavioral basis for smoking-attributable disease. Washington, (DC): Centers for Disease Control and Prevention.
- Varlet V, Farsalinos K, Augsburger M, et al. (2015). Toxicity assessment of refill liquids for electronic cigarettes. Int J Environ Res Public Health 12:4796–815.
- Vitrocell. VC10 Smoking Robot. Available from: http://www.vitrocell.com/inhalation-toxicology/smoking-machines/vc-10 [last accessed 1 June 2016].
- West R, Hajek P, Mcneill A, et al. (2015). Electronic cigarettes: what we know. A report to UK All Party Parliamentary Groups. Available from: http://www.smokinginengland.info/reports/ [last accessed 1 June 2016].
- World Health Organization. (2008). The scientific basis of tobacco product regulation: second report of a WHO study group. Geneva, Switzerland: World Health Organization Press, WHO Technical Report Series 951. Available from: http://apps.who.int/iris/bitstream/10665/43997/1/TRS951_eng.pdf?ua =1 [last accessed 1 June 2016].
- Williams M, Villarreal A, Bozhilov K, et al. (2013). Metal and silicate particles including nanoparticles are present in electronic cigarette cartomizer fluid and aerosol. PLoS One 8:e57987.
- Yu V, Rahimy M, Korrapati A, et al. (2016). Electronic cigarettes induce DNA strand breaks and cell death independently of nicotine in cell lines. Oral Oncol 52:58–65.