
 ?Mathematical formulae have been encoded as MathML and are displayed in this HTML version using MathJax in order to improve their display. Uncheck the box to turn MathJax off. This feature requires Javascript. Click on a formula to zoom.
Abstract
Disruption of the immune system during embryonic brain development by environmental chemicals was proposed as a possible cause of neurodevelopmental disorders. We previously found adverse effects of di-n-octyltin dichloride (DOTC) on maternal and developing immune systems of rats in an extended one-generation reproductive toxicity study according to the OECD 443 test guideline. We hypothesize that the DOTC-induced changes in the immune system can affect neurodevelopment. Therefore, we used in-vivo MRI and PET imaging and genomics, in addition to behavioral testing and neuropathology as proposed in OECD test guideline 443, to investigate the effect of DOTC on structural and functional brain development. Male rats were exposed to DOTC (0, 3, 10, or 30 mg/kg of diet) from 2 weeks prior to mating of the F0-generation until sacrifice of F1-animals. The brains of rats, exposed to DOTC showed a transiently enlarged volume of specific brain regions (MRI), altered specific gravity, and transient hyper-metabolism ([18F]FDG PET). The alterations in brain development concurred with hyper-responsiveness in auditory startle response and slight hyperactivity in young adult animals. Genomics identified altered transcription of key regulators involved in neurodevelopment and neural function (e.g. Nrgrn, Shank3, Igf1r, Cck, Apba2, Foxp2); and regulators involved in cell size, cell proliferation, and organ development, especially immune system development and functioning (e.g. LOC679869, Itga11, Arhgap5, Cd47, Dlg1, Gas6, Cml5, Mef2c). The results suggest the involvement of immunotoxicity in the impairment of the nervous system by DOTC and support the hypothesis of a close connection between the immune and nervous systems in brain development.
Introduction
Prenatal exposure to chemicals and drugs can lead to disruption of human health. Subtle or delayed effects are difficult to link to prenatal exposure, but the impact can still be considerable and may lead to a number of neurodevelopmental disorders. A possible cause for neurodevelopmental disorders induced by prenatal exposure is immune system disruption during brain development.
Di-n-octyltin dichloride (DOTC) is a tin compound found in polyvinylchloride (PVC) products where it prevents the disintegration of PVC products when they are exposed to heat or ultraviolet light. Dioctyltin compounds are known to cause developmental toxicity, mainly teratogenicity, with effects on fetuses at dose levels near those causing maternal toxicity (NOAEL developmental toxicity: 45 mg/kg bodyweight; NOAEL maternal toxicity: 30 mg/kg bodyweight). Immunotoxicity was reported as well, including reduced thymus weight and altered measures of functional immunotoxicity (NOAEL immunotoxicty: 0.23 mg/kg) (Sherman Citation1995; ATSDR Citation2005; Dobson et al. Citation2006 (WHO report 73); Kishi et al. Citation2006). Previously, we found that DOTC caused aberrations in maternal immune system functioning during the lactation period (Menke et al. Citation2012). In addition, we reported changes in immune system development in rats exposed to DOTC in a regulatory setting of an extended one-generation reproductive toxicity study, according to the Organization for Economic Co-operation and Development test guideline (OECD TG) 443 (OECD Citation2011a; Tonk et al. Citation2011). With regard to the study of potential developmental neurotoxicity, the exposure scenario of an extended one-generation reproductive toxicity study is unique because parental animals are already exposed at least 2 weeks before conception; the offspring is further exposed via the mother during pregnancy and lactation, and exposed directly from weaning until young adulthood.
Unlike effects on the immune system, little is known about the effects of DOTC on the developing nervous system. Interactions between the immune system and the nervous system start early in life: in the embryonic stage. Efficacious neurodevelopment depends on immune cells like microglia, which are involved in maintaining normal brain development and physiology (Kettenmann et al. Citation2011; Harry and Kraft Citation2012; Bilbo and Schwarz Citation2012; Ginhoux et al. Citation2013; Svahn et al. Citation2013; Zhan et al. Citation2014), via synaptic engulfment and pruning (Raiders et al. Citation2021; Buchanan et al. Citation2022). Synaptic pruning by microglia is orchestrated by several genes among which CD47. CD47 protects synapses from excess pruning during development (Raiders et al. Citation2021). Microglia originate from the embryonic yolk sac as primitive macrophages (see Ginhoux et al. Citation2013, for review). At the onset of circulation, these primitive macrophages exit the yolk sac and migrate into the developing brain where they will form microglia. Microglia proliferate during late gestation and post-natal development and at a later stage in the injured adult brain in response to neuronal damage or invading pathogens. In this way, microglia inextricably link the (developing) brain to the immune system.
Given the notion of an affected maternal immune system (Menke et al. Citation2012) and the developing immune system of the offspring in rats (Tonk et al. Citation2011), we hypothesize that DOTC will also affect normal brain development. Therefore, we studied the effects of DOTC on structural and functional brain development in rats according to the OECD TG 443 for an extended one-generation reproductive toxicity study. The developmental processes in the brain differ in speed per brain region and cell-type (Rice and Barone Citation2000; Andersen Citation2003; Tau and Peterson Citation2010; Blakemore Citation2012). Consequently, information ‘over time’ is needed to study the dynamic processes of development and toxicology. In this study, we focused on postnatal day (PND) 21 and 61–70, as these timepoints provide information on the trajectory before weaning and the trajectory between weaning and young adulthood, respectively. To obtain information on functional and structural development of the brain, we used positron emission tomography (PET), magnetic resonance imaging (MRI), and behavioral tests, enabling repeated measurements in the same living animal. These serial measurements were combined with postmortem measures (brain weight and specific gravity) to derive information on the structural composition of the brain. Genome-wide gene expression profiling was used to elucidate the mechanisms underlying the observed effects of DOTC.
Methods
Test substance
Di-n-octyltin dichloride (CAS-number: 3542-36-7) was obtained from ABCR GmbH &Co KG (Karlsruhe, Germany).
Animals and animal husbandry
The in life part of the study was carried out at the animal facilities of TNO, Zeist, the Netherlands. The study was accomplished in the spirit of Good Laboratory Practice (GLP) (OECD Citation1998). For in vivo imaging selected animals were housed in the animal facilities of the University Medical Center Groningen (PET) or Radboud University Medical Center Nijmegen (MRI). Animal care and use were in accordance with Directive 86/609/RCC (European Commission Citation1986), which established the general principles governing the use of animals in experiments of the European communities and with Dutch-specific legislation (The Dutch ‘Experiments on Animals Act 1997’) (Utrecht Animal Welfare Body [CitationOnline]). Positive advice for the use of the animals in this study was obtained from the Animal Experimentation Committee of TNO under DEC nr 2597.
Test system and study design
A regulatory study according to OECD TG 443 for an extended one-generation reproductive toxicity study was carried out (OECD 2011), with some modifications: (1) exposure started 2 weeks prior to mating of the F0-generation; (2) hormonal investigation was not performed; (3) breeding of an F2 generation was not performed; (4) testing of the developing immune system was extended with immune-functioning tests (the results of this part of the study have been published in Tonk et al. Citation2011); and (5) the investigation of the developing nervous system was expanded with in vivo imaging of the male F1 animals (control and 30 mg/kg DOTC dose groups). The cerebrum and cerebellum were analyzed with functional PET imaging and structural MRI. The findings were further substantiated by genome-wide transcriptome analysis (male F1 animals; all dose groups) of the cerebrum and cerebellum separately ().
Figure 1. Experimental design used to study effects of di-n-octyltin dichloride (DOTC) on neurodevelopment of Wistar rats. Rats were exposed to DOTC at a dose of respectively 0, 3, 10 or 30 mg/kg of diet from two weeks before mating of F0-generation to postnatal day (PND) 61–70 of F1-generation, and a limited group of F1-animals up to PND 90** (conform OECD test guideline 443 for an extended one-generation reproductive toxicity study). Acclimatization to the housing conditions started at least a week prior to exposure*. During development, adolescence and adulthood physical, sensory and sexual landmarks were studied, a functional operational battery (FOB) and auditory startle response (ASR) were carried out, nociception and motor activity (MA) were tested, and effects on cognition were investigated performing passive and active avoidance tests (PA and AA, respectively). In addition, cerebrum and cerebellum were sampled for analysis by [18F]FDG PET functional imaging, magnetic resonance structural imaging (MRI), quantitative macroscopy (brain weight and specific gravity (SG)) and microarray gene expression profiling. Microarray gene expression profiling was applied to male offspring only (all dose groups); PET and MRI were limited to male F1-rats of the control and 30 mg/kg DOTC dose groups.
![Figure 1. Experimental design used to study effects of di-n-octyltin dichloride (DOTC) on neurodevelopment of Wistar rats. Rats were exposed to DOTC at a dose of respectively 0, 3, 10 or 30 mg/kg of diet from two weeks before mating of F0-generation to postnatal day (PND) 61–70 of F1-generation, and a limited group of F1-animals up to PND 90** (conform OECD test guideline 443 for an extended one-generation reproductive toxicity study). Acclimatization to the housing conditions started at least a week prior to exposure*. During development, adolescence and adulthood physical, sensory and sexual landmarks were studied, a functional operational battery (FOB) and auditory startle response (ASR) were carried out, nociception and motor activity (MA) were tested, and effects on cognition were investigated performing passive and active avoidance tests (PA and AA, respectively). In addition, cerebrum and cerebellum were sampled for analysis by [18F]FDG PET functional imaging, magnetic resonance structural imaging (MRI), quantitative macroscopy (brain weight and specific gravity (SG)) and microarray gene expression profiling. Microarray gene expression profiling was applied to male offspring only (all dose groups); PET and MRI were limited to male F1-rats of the control and 30 mg/kg DOTC dose groups.](/cms/asset/823e2f2d-8266-4f35-a06b-783625df31c4/itxm_a_2281610_f0001_c.jpg)
Ninety-two nulliparous female and 46 male rats (Wistar outbred (Crl:[WI]Wu BR), aged respectively 9–10 and 10–11 weeks at arrival, were obtained from Charles River (Sulzfeld, Germany). Animals were housed in macrolon cages with sterilized wood shavings as bedding material. Housing conditions were maintained at 22 ± 2 °C with a relative humidity of 30–65%. During quarantine, acclimatization, and after allocation to the various treatment groups, parental animals were housed in groups of 3–4 animals of the same sex. Mating in the study was started when females were 14 weeks of age. For mating two females were placed together with one male. During the mating period, every consecutive morning vaginal smears were prepared and examined for the presence of sperm cells to ascertain copulation. Upon evidence of copulation, females were housed individually (gestational day (GD) 0). Various parameters were recorded to assess the effect of DOTC on fertility and reproduction, such as the percentage of mating F0 females (mating index), the percentage of F0 females that got pregnant (fertility/fecundity index, gestation index), precoital time, gestation time, number of F0 females with implantation loss, implantation loss per animal, number of F0 females with liveborn/stillborn pups, number of pups delivered (live birth index, sex ratio of day 1) and live pups per litter on day 1, 4 and 21 (viability index day 1–4 and day 4–21).
Exposure to DOTC at a dose of 0, 3, 10, or 30 mg/kg of diet started 2 weeks prior to mating of the F0-generation and lasted up to the sacrifice of F1-animals. Consequently, the F1 animals were indirectly exposed via the mother during gestation and lactation. After weaning, the F1-animals were directly exposed via the diet. DOTC doses were based on previous developmental immunotoxicity studies (Smialowicz et al. Citation1988; Tonk et al. Citation2011; Menke et al. Citation2012). Fresh diets were prepared at least every 4–6 weeks and stored at −20 °C until use. All groups had access to food and water ad libitum. Litters were not culled. The pups stayed with their mothers until weaning at PND 21. After weaning F1-animals were housed per sex in groups of 3–4 per cage.
Each animal was observed daily for clinical signs and, if necessary, handled to detect signs of toxicity starting from GD 0 until sacrifice. All abnormalities, signs of ill health or reactions to treatment were recorded. F1-animals were weighed individually twice a week during lactation and once a week after weaning.
Treatment groups, cohorts and subsets
Allocation of the F0 females to the various treatment groups occurred 17 days prior to mating. Exposure groups comprised: group I, Control group (0 mg/kg DOTC): standard commercial rodent diet (Rat & Mouse No. 3 Breeding diet, RM3, SDS Special Diet Services, UK) and experimental groups II, III and IV fed the same diet supplemented with DOTC at concentrations of 3, 10 or 30 mg/kg of diet, respectively. Females mated with the same male were placed in different groups. Groups were subdivided into three cohorts: (A) Neurodevelopment (male and female F1 animals; all four treatment groups); (B) MRI (male F1-animals; control and 30 mg/kg DOTC group); C) PET imaging (male F1-animals; control and 30 mg/kg DOTC group). The number of F1-animals allocated to the different treatment groups, cohorts and subsets are shown in . Reasons for choosing only a limited selection of F1 animals for PET and MRI were logistics and costs.
Table 1. Number of F1-animals in an extended one-generation reproductive toxicity study (OECD TG 443).
F1 animals from cohort A (neurodevelopment) were subjected to conventional guideline testing, i.e. development, behavior, and brain survey (brain weight), and in addition toxicogenomics of cerebrum and cerebellum. The F1 animals of cohort A (neurodevelopment) were subdivided into 2 subsets to perform a limited neuropathology survey and genome wide gene expression profiling/pathway analysis at PND 21 (weaning) and PND 69 ± 1 day (young adulthood), respectively. Cohort B was subjected to MRI on PND 21 and 61 to obtain information on brain structure. Cohort C was repeatedly (PND 17, 21, 35 and 61) subjected to PET imaging of the brain with the tracer 2′-[18F]fluoro-2′-deoxyglucose ([18F]FDG). In the brain, [18F]FDG is converted by the intracellular enzyme hexokinase into [18F]FDG-6-phosphate, which will remain trapped inside the cell. When the brain is activated, its glucose consumption increases, resulting in enhanced [18F]FDG trapping. Thus, [18F]FDG uptake in specific brain regions can be used as a surrogate marker for brain activity. Up to postnatal day 11, litters –dam and pups– of all cohorts were equally handled. The treatment groups in each cohort comprised F1-animals from different litters as near as possible.
Neurodevelopment
Developmental landmarks and behavior (cohort A)
A number of parameters and tests proposed in current guidelines for regulatory developmental neurotoxicity testing were measured/performed (OECD TG 443 (OECD Citation2011a, Citation2011b, Citation2013; ECHA Citation2015); OECD TG 426 (OECD 2007); US EPA OPPTS 870.6300/8600 (US EPA Citation1998, Citation1996):
PND 1–47: Physical, sensory and sexual landmarks (OECD 2007)
PND 23: Sensory functioning was examined in the acoustic startle response (ASR) (Adams et al. Citation1985; Ison Citation1984)
PND 13, 17, 21 and 61 ± 1: Motor activity assessment (MA) (Moser et al. Citation1991, Citation1997; Moser Citation2010, Citation2011)
PND 13, 17, 21 and 61 ± 1: Functional observational battery (FOB) (Moser et al. Citation1991, Citation1997; Moser Citation2010, Citation2011)
PND 21 and 61 ± 1: Nociception (pain receptors): the tail immersion test (Mogil et al. Citation2001; Zhou et al. Citation2014).
PND 30 and 37: Cognitive functioning: passive avoidance (PA)
PND 60 and 67 ± 1: Active avoidance (AA) (Brush and Knaff Citation1959; Brush Citation1962, Citation1971; McAllister and McAllister Citation1971; Quillfeldt Citation2006).
All animals from cohort A were subjected to the tests above. After behavioral testing, the animals were subjected to a neuropathology survey on PND 21 (cohort A, subset 1) or PND 69 ± 1 (cohort A, subset 2). Brain tissues were sampled in such a way that quantitative macroscopic information could be acquired for each brain, and parts of both the cerebrum and cerebellum were available for toxico-genomics analysis.
Neuropathology: quantitative macroscopy (cohort A)
On PND 21 or PND 69 ± 1, animals of cohort A were anesthetized with a CO2/O2 mixture and sacrificed by decapitation. At necropsy, the brains were taken from the skull and dissected along neuro-anatomical landmarks as described by De Groot et al. (Citation2005a, Citation2005b) and weighed. The whole brain, one intact brain half with cerebrum and the cerebellum attached and the other brain half with cerebrum and cerebellum detached were weighed. The split brain half was sampled and processed for toxicogenomics of the cerebrum and cerebellum. Brain specific gravity (SG) was calculated as the ratio of the group means for brain weight (nominator) and brain volume (denominator) since different animals were used for the determination of brain weight (cohort A) and brain volume (cohort B). The standard error of the mean (SEM) of specific gravity was calculated from the individual errors of brain weight and brain volume (Simanek Citation1996). Likewise the SG of cerebrum and cerebellum was calculated.
In vivo imaging
A limited selection of F1 animals were used for PET and MRI due to logistics and costs. For these reasons, F1 animals were redistributed in litters with either only male or only female pups from the same dose group. Litters with only male pubs were used for MRI (cohort B) and for PET imaging (cohort C). On PND 11–13, animals of the control and 30 mg/kg DOTC groups selected for in vivo imaging were placed per litter (dam and pups together) in filter boxes and transported – with the consent of the Animal Experimentation Committees of TNO, the Radboud University Medical Center Nijmegen and the University Medical Center Groningen – from TNO to the imaging facilities, where they were housed and treated until the end of the study. Animals were allowed to acclimatize to the new environment for at least 5 d before a first scan was made. Structural MRI was performed on PND 21 and 61, in line with time-points for the brain structure survey proposed in guidelines for developmental neurotoxicity testing (US EPA OPPTS 870.6300 (US EPA Citation1998); OECD 426 (OECD 2007). Functional [18F]FDG PET scans were made on PND 18, 21, 35, and 61, as near as possible in line with Functional Operational Battery (FOB) and Motor Activity (MA) testing proposed in the developmental neurotoxicity testing guidelines. For ethical reasons, the performance of PET scans below the age of PND 17 was not allowed. PND 35 was arbitrarily included as an extra timepoint for PET. With in-vivo imaging, the volume and metabolic activity were measured in multiple brain regions to assess whether brain regions were equally sensitive to the test compound.
Magnetic resonance imaging (cohort B)
Rats were anesthetized by inhalation of 1.5–2.5% Isoflurane (Abott, Cham, Switzerland) in a 2:1 mixture of oxygen and N2O. Anesthesia was initiated before and continued during the MRI exam of the animals. Breathing was monitored with a pneumatic cushion and kept constant at 60-90 breaths/min and the temperature was monitored with a rectal optical temperature probe and kept constant at 37.5 °C with heated air flow (Small Animal Instruments Inc, NY, USA). For the MRI examination, the animals were placed prone in the horizontal bore of a 7 Tesla magnet interfaced to a clinical console (ClinScan, Bruker BioSpin, Ettlingen, Germany) facilitated with field gradients of maximal 290 mT/m. The head of the rat was fixated by the use of a tooth-bar and earplugs, to prevent unwanted movement. A circular polarized 1H transmit volume coil (200 mm/154 mm outer/inner diameter) was used for excitation, combined with a circular polarized 1H receive surface coil with a shape adapted to the rat head for signal reception. MRI was performed with a Turbo Spin Echo sequence under the following conditions: field of view (FOV): 25 mm (PND 21) or 30 mm (PND 61); matrix: 256 × 256; 22 consecutive, interleaved acquired slices; slice thickness: 0.5 mm; in-plane resolution: 98 μm (PND 21) or 117 μm (PND 61); echo time: 45 ms; repetition time: 4000 ms. All slices were recorded in the transversal orientation of the brain, covering the complete brain, except the olfactory bulb.
To identify and demarcate different brain regions in the MR images (see Supplemental Figure S1(A,B)), an established neuroanatomical atlas of the rat brain (Paxinos and Watson Citation1986) was used. Images were analyzed using Syngo FastView software (www.healthcare.siemens.nl/medical-imaging-it/syngo…/syngo-fastview/; Siemens AG Medical Solutions Citation2009). Regions and sub-regions demarcated in the MR images are summarized in a brain tree (). Once the distinguishable brain regions were defined for the PND 21 and PND 61 old rats, the volumes of the different brain regions were estimated using stereology (Cavalieri’s principle) (http://www.stereology.info/cavalieri-estimator/; Gundersen et al. Citation1999; Roberts et al. Citation1994, Citation2000; McNulty et al. Citation2000; Garcia-Finana et al. Citation2003). Cross-sectional areas of brain structures on the MR images were manually counted with a point counting grid placed over calibrated hard copies of each of the images. The volume of a brain region was calculated as the total number of points of the grid, falling on the brain region of interest (ROI) over all analyzed MR images in which the ROI appears, multiplied by the point-area (122.3 mm2) and the slice thickness (0.5 mm). Since brains on PND 61 were much larger than on PND 21, only one out of every two images of the PND 61 scans was analyzed and therefore the slice thickness was 1.0 mm for this timepoint. This method was based on a pilot study to optimize counting conditions in order to reach maximum reliability with minimum counting effort (Kroustrup and Gundersen Citation1983; Gundersen et al. Citation1999). Volumes of cerebrum were calculated (from anterior to posterior) from the first image in which the neocortex was visible to the first image that showed the cerebellum. The volume of the cerebellum was calculated from all images showing the cerebellum. The volume of the ‘total brain’ was the summation of the volumes of cerebrum and cerebellum. The results of the DOTC group were compared with those of the control group scanned at the same age. Relative ‘growth’ was assessed as the difference in brain region volume between PND 21 (=100%) and PND 61. Relative growth was compared between DOTC and control groups as well.
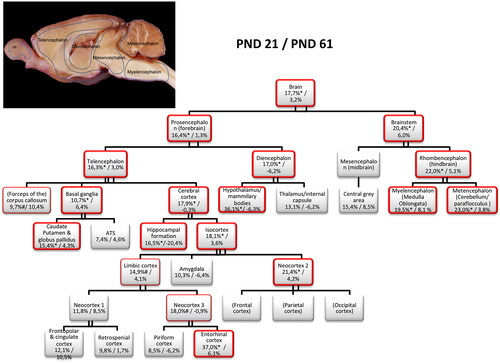
Figure 2. Braintree of Wistar rat, with relative change in volume data upon di-n-octyltin dichloride (DOTC) exposure, estimated from MR images taken on postnatal day (PND) 21 and 61. Insert gives an overview of the original ‘brain vesicles’ in the developing rat brain. The percentages presented per brain region (left: PND 21; right: PND 61) represent the effect of 30 mg/kg of diet DOTC on brain region volume, relative to the control group. Exposure occurred via the diet from 2 weeks pre-mating of F0 animals to PND 61–70 of the F1 generation. A practically overall enlargement of brain volume is seen at developmental/adolescence age (PND 21), which is no more observed at young adulthood (PND 61). Despite the fact that none of the enlargements observed at PND 61 differs significantly from the control group, the trajectories of brain development from early development to PND 21 and from PND 21 to PND 61 differ between control and DOTC groups. Statistical key: ANOVA with Dunnett’s post hoc comparison test: different from control, *p < .05 (thick red border lines); trend, # .05 < p < .1 (thin red border lines). OB: olfactory bulb; ATS: nucleus accumbens, olfactory tubercle, septum; PND: postnatal day.
Positron emission tomography (Cohort C)
Conscious animals were intraperitoneally injected with approximately 20 MBq of [18F]FDG in saline, after which animals were placed in a dark square arena such as used for motor activity testing. After 45 min, the animals were anesthetized via inhalation of 1.5–2.5% Isoflurane in medicinal air. Fifty minutes after [18F]FDG injection, the anesthetized rat was placed in the supine position in a dedicated small animal PET camera (MicroPET Focus 220, Siemens/Concorde). The brain of the animal was positioned in the center of the field-of-view of the camera. First, a 20 min emission scan was acquired. Subsequently, a transmission scan was acquired for correction of attenuation of radiation by tissue and the camera bed (De Vries et al. Citation2008; Van Waarde Citation2008).
The PET acquisition data were reconstructed using an iterative reconstruction algorithm (two-dimensional ordered-subsets expectation maximization). The final datasets consisted of 95 ‘slices’ with a slice thickness of 0.8 mm, and an in-plane image matrix of 128 × 128 pixels with a size of 1 × 1 mm. Datasets were corrected for radioactive decay, random coincidences, scatter, and attenuation. For data analysis, 3-dimensional volumes of interest (VOIs) were drawn on a template scan, using AsiPro software (version 6.6.2.0; Siemens CTI Concorde Microsystems). Only major brain regions were selected that were large enough to be reliably measured with a small animal PET camera (resolution ca. 1.4 mm) and thus where less prone to partial volume effects. The selected VOIs for analysis were: (1) frontopolar cortex, (2) frontal cortex, (3) temporal/occipital/parietal cortex, (4) entorhinal/visual cortex, (5) striatum, (6) thalamus, (7) midbrain, (8) hippocampus, (9) cerebellum (see Supplemental Figure S2). Regions were identified with the aid of information on the microscopic anatomy of the rat brain (Paxinos and Watson Citation1986). Individual PET scans were co-registered with the template scan and the VOIs were copied from the template to the co-registered scans. For each VOI, the [18F]FDG uptake was generated and corrected for injected tracer dose and body weight to obtain a standardized uptake value (SUV), according to the following formula:
It is assumed that 1 mL of brain tissue corresponds to 1 gram.
Genome wide gene expression profiling (cohort A)
To support possible neurodevelopmental defects of DOTC and uncover underlying mechanisms, both the cerebellum and cerebrum of male F1-rats exposed to 0, 3, 10, or 30 mg/kg DOTC were sampled at weaning (PND 21) and adulthood (PND 69 ± 1). Brain tissues from at least five male F1 animals from different litters were sampled per group. The RNA was isolated and hybridized to Affymetrix Rat230-2.0 Genome Gene-chips as previously described (Radonjic et al. Citation2013). Quality control microarray data were performed using simple affy and affyplm packages from the R/Bioconductor project through the Management and Analysis Database for MicroArray eXperiments (MADMAX) analysis pipeline (Radonjic et al. Citation2009). After quality control, 124 arrays were used for further analysis. Normalization of microarray data per tissue was performed through the same analysis pipeline, using the library GC-RMA and employing the empirical Bayes approach for background correction followed by quantile normalization. The approach followed for Genome-wide gene expression profiling is schematically presented in Supplemental Figure S3.
The custom MBNI CDF-file (CustomCDF_rn230rnentrezg_v December2009), available at (http://brainarray.mbni.med.umich.edu/Brainarray/Database/CustomCDF/CDF_download_v9) was used to re-annotate the probes to new probe sets, remove poor quality probes and derive unique signal values for different probe sets representing the same gene. This resulted in gene expression values for 11,427 genes with unique identifiers. Data was additionally filtered based on expression signals. To pass the filtering criteria, gene expression was required to have a value above 5 in at least 1 of the experiments, resulting in 11,207 genes in the cerebellum and 11,189 genes in the cerebrum.
Statistics
Statistical analyses were performed using the statistical software packages SPSS (version 16) and SAS (version 9.1.3). For brain (region) volume (MRI), brain weight (macroscopy) and [18F]FDG PET, arithmetic means and standard errors of the mean are given where applicable. Tests are performed as two-sided tests with results taken as significant where the probability (p) of the results is <0.05. Since numerous variables are subjected to statistical analysis, the overall false positive rate (Type I errors) is greater than suggested by a probability level of 0.05. Therefore, the final interpretation of results is based not only on statistical analysis, but also on other considerations, such as whether the results are significant in light of other biological and pathological findings.
Homogeneity of the variances was tested according to Levene. When equal variances were present, a one-way analysis of variance (ANOVA) was performed followed by Dunnett’s post hoc test. Unequal variances were further evaluated using a Kruskal and Wallis test, followed by a Williams unpaired T-test. Clinical findings were evaluated by Fisher’s exact probability test. The proportions of animals recorded each day with developmental landmarks were analyzed by Fisher’s Exact test and the observed days for the developmental landmarks were analyzed by one-way ANOVA followed by Dunnett’s multiple comparison tests. Bodyweight, ASR (average voltage), and MA (total distance moved) were also analyzed with one-way ANOVA with Dunnett’s post hoc comparison; habituation of MA and ASR with repeated measures ANOVA on time blocks (motor activity: 5 time blocks per session; ASR: 10 blocks per session). Functional observational battery and nociception were analyzed with one-way ANOVA with Dunnett’s post hoc comparison (continuous data), Kruskal–Wallis non-parametric analysis of variance followed by multiple comparison tests (rank order data) or Pearson chi-square analysis (categorical data).
Statistical analysis of microarray data was performed as previously described (Radonjic et al. Citation2009, Citation2013). Briefly, differentially expressed genes were identified by applying a linear model and moderated t-statistics that implement empirical Bayes regularization of standard errors as implemented in the limma package. Gene expression under each DOTC dose treatment was compared to the control treatment (dose zero) per tissue (cerebrum and cerebellum) and developmental stage (PND 21 and PND 69 ± 1). To be considered statistically significant, fold change of gene expression was required to be either >1.5 or < −1.5 and to have a p-value <.01. Identification of overrepresented functional categories among differentially expressed genes in brain tissue was performed using the limma package of the R/Bioconductor (Radonjic et al. Citation2013).
Results
Effects of DOTC on fertility and reproduction were marginal at most
Effects of DOTC on fertility and reproduction –at the dosages used- were marginal and most of the times statistically not significant. The effects of DOTC observed are summarized in the Supplemental Table S1.
Mild effects on bodyweight, motor activity and auditory startle response appear restricted to the male offspring
The effects of DOTC on clinical signs, bodyweight, and physical/sensory/sexual landmarks, as well as on the functional observational battery, nociception, and cognitive behavior, are summarized in Supplemental Tables S2 and S3. Only small dose-related effects of DOTC on bodyweight in male offspring were observed. These effects were significant (p < .05) for the 30 mg/kg of diet dose on PND 8, 10, and 13 (Supplemental Table S4). Motor activity was tested on PND 13, 17, 21, and 61 ± 1, but only a tendency toward increased activity was measured on PND 61 (.05 < p < .1) in the male F1-rats exposed to the 30 mg/kg of diet dose (). Interestingly, the auditory startle response test on PND 23 showed hyper-responsiveness, but only in male F1-rats exposed to 30 mg DOTC/kg of diet, which was statistically significant in the first interval (p < .05; ). Since DOTC had some effect on bodyweight, the startle results were corrected for bodyweight.
Figure 3. Motor activity of male rat offspring (N = 10/group) after exposure to di-n-octyltin dichloride (DOTC), 0 (control diet) or 30 mg/kg of diet DOTC from 2 weeks premating (F0-generation) up to postnatal day (PND) 61–70 (F1-generation). Motor activity was measured as the total distance moved (cm) during 30 min of motor activity testing on PND 13, 17, 21 and 61 ± 1. A tendency toward hyperactivity upon DOTC exposure is observed on PND 61 ± 1. Statistical key: ANOVA with Dunnett’s posthoc comparison: # .05 < p < .1.
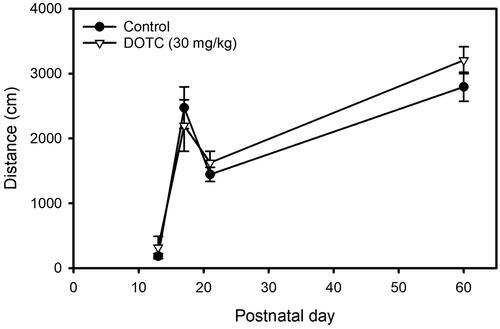
Figure 4. Auditory startle response (ASR) of male offspring (N = 10/group) after exposure to 0 (control) or 30 mg/kg of diet di-n-octyltin dichloride (DOTC) from 2 weeks premating (F0-generation) up to postnatal day (PND) 61–70 (F1-generation). The ASR was tested on PND 23 and expressed as the average voltage (V) per time-block. Hyper-responsiveness is observed at the start of testing. Statistical key: ANOVA with Dunnett’s posthoc comparison: * p < .05.
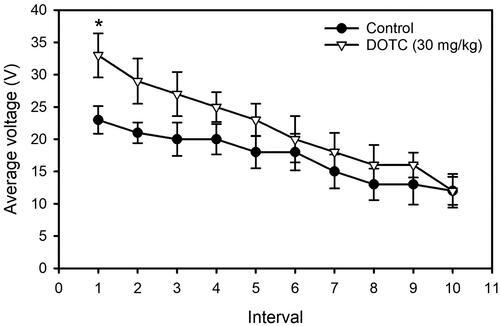
Table 2. Effect of exposure of male F1-rats to di-n-octyltin dichloride (30 mg/kg of diet) on brain volume, brain weight and specific gravity.
Table 3. Effect of exposure of male F1-rats to di-n-octyltin dichloride (30 mg/kg of diet) on volume of forebrain, midbrain and hindbrain regions estimated from magnetic resonance images using stereology (Cavalieri principle).
Brain weight was not affected upon DOTC exposure
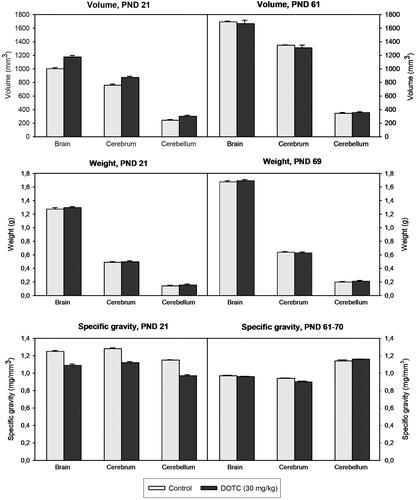
The weights of total brain, cerebrum, and cerebellum of control and 30 mg/kg DOTC exposed male F1-animals on PND 21 and 69 ± 1 are presented in and . In control animals, an increase in total brain weight of about 30% was observed between weaning (PND 21: 1.256 ± 0.012 g) and adulthood (PND 69 ± 1: 1.639 ± 0.016 g). Growth of the cerebrum was about 22% (PND 21: 1.020 ± 0.012 g; PND 69 ± 1: 1.240 ± 0.014 g), whereas growth of cerebellum was 42% (PND 21: 0.280 ± 0.012 g; PND 69 ± 1: 0.398 ± 0.012 g). Brain weight was not affected by DOTC in the dosing regimen used, neither on PND 21 nor on PND 61.
Figure 5. Brain volume (top panels; N = 4–6/group), brain weight (mid panels; N = 10/group) and specific gravity (bottom panels; N = 4–6/group) of male offspring after exposure to 0 (control) or 30 mg/kg of diet di-octyltin-di-chloride (DOTC) from 2 weeks premating (F0-generation) up to PND 61–70 (F1-generation). Brains are weighed at necropsy (postnatal day (PND) 21 or 69 ± 1) immediately after removal from the skull; brain (region) volumes are calculated from MRI scans taken in the living animal on PND 21 or 61, using stereology (Cavalieri principle). The weight of the brain represents the group mean of the sum weight of both hemispheres, whereas the weight of cerebrum and cerebellum represent the group mean of the weight in one hemisphere only (left/right chosen randomly). Statistical key: ANOVA with Dunnett’s post hoc comparison: * p < .05 different from control.
DOTC exposure time-dependently changes the volume of cerebellum, hypothalamus/mammillary bodies, hippocampal formation and entorhinal cortex
The total brain volume in the control group, as calculated from a stereological analysis of MRI scans, clearly increased by about 68% between PND 21 (1002 ± 16 mm3) and PND 61 (1683 ± 6 mm3), as shown in and . Volume growth of the cerebrum is about 76% (PND 21: 759 ± 17 mm3; PND 61: 1334 ± 8 mm3), whereas volume growth of the cerebellum is 43% (PND 21: 245 ± 10 mm3; PND 61: 349 ± 7 mm3). Exposure to 30 mg/kg DOTC caused a significant enlargement of the volumes of the whole brain (17%), cerebrum (15%), and cerebellum (23%) on PND 21 with respect to controls (p < .05). This enlargement was no longer significant on PND 61.
Effects of DOTC on the volumes of the different brain regions –relative to the control group (%)– are presented in and . The volume of a number of brain regions was significantly increased in the DOTC-exposed offspring at weaning (PND 21; early adolescence), in particular the hindbrain and forebrain. The enlargement of the midbrain was not statistically significant. Within the hindbrain, the cerebellum (metencephalon) was most markedly affected by DOTC (23%, p < .05). In the forebrain, the volume enlargement in the diencephalon (17%, p < .05) is most pronounced, in particular in the region of the hypothalamus/mammillary bodies (36%, p < 0.05). In the telencephalon, especially the cerebral cortex (18%, p < .05) is affected (hippocampal formation: 17%, p < .05; isocortex: 18%, p < .05). Within the isocortex, the entorhinal cortex (37%, p < .05) in neocortex 3 (18%) as part of the limbic cortex (15%) shows a remarkable enlargement. The differences observed on PND 21 did not persist into adulthood (PND 61). Consequently, the changes in the volume of the total brain and cerebrum (but also the cerebral cortex and the sub-regions hippocampal formation and isocortex) over time (PND 21–61) are significantly smaller in the DOTC exposed group (p < .05) than in the control group (). Taken together, the results of brain volume suggest a time-dependent effect of DOTC on brain structure development.
Table 4. Effect of exposure of male F1-rats to di-n-octyltin dichloride (30 mg/kg of diet) on volume of cerebral cortex (hippocampal formation and isocortex) subregions estimated from magnetic resonance images using stereology (Cavalieri principle).
Changes in brain specific gravity upon DOTC exposure suggest time-dependent changes in brain structure development
In control animals, brain SG is on average 1.254 g/ml on PND 21 and 0.974 g/ml on PND 61-70, implying a reduction in SG over time of about 22% (; ). On PND 21, SG of total brain was 13% smaller after 30 mg/kg DOTC exposure (not significant) than in controls. SG of the cerebrum was significantly smaller (12%, p < .05) in DOTC exposed rats than in the control group, whereas SG of the cerebellum was 15% smaller (p = .109). On PND 61–70, SG of the different brain regions is no significantly different between groups ( and ; ). Consequently, changes in SG over time from PND 21 to 61–70 are smaller for DOTC-exposed animals than for controls (p = .083, ).
Brain activity measured with [18F]FDG PET seems to concur with the changes in brain volume and specific gravity upon DOTC exposure
show the results of [18F]FDG brain uptake as a marker for brain activity for control and 30 mg/kg DOTC male F1-animals. The control group shows an uptake pattern over time (PND 18, 21, 35, 61), which is similar for the total brain and for the different brain regions studied. In absolute terms, however, the uptake differs between the 9 different brain regions, with the highest uptake in the striatum and thalamus and the lowest uptake in the frontal and frontopolar cortex at all timepoints. Tracer uptake in the 30 mg/kg DOTC group shows a tendency toward increased activity on PND 18 and 21 and decreased activity on PND 35, as compared to controls. On PND 61, activity approaches control values. These activity changes – although not statistically significant as a result the small number of individuals tested – seem to concur with the results of brain volume and brain specific gravity measured on PND 21 and 61–70 (note that tracer uptake is corrected for brain volume), and support the suggestion of a time-dependent effect of DOTC on neural development.
Figure 6. [18F]FDG brain uptake (SUV) in nine regions of interest in male F1-rats (N = 3–5/group) upon exposure to 0 (control) or 30 mg/kg of diet di-n-octyltin dichloride (DOTC) from 2 weeks premating (F0-generation) up to PND 61–70 (F1-generation). [18F]FDG PET was performed on postnatal day (PND) 17, 21, 35, 61. The trajectories of brain development from birth to adolescence and from adolescence to adulthood differ between the two groups, but no between-group differences were observed at any timepoint (Kruskal–Wallis with Newman Keuls post-hoc comparison).
![Figure 6. [18F]FDG brain uptake (SUV) in nine regions of interest in male F1-rats (N = 3–5/group) upon exposure to 0 (control) or 30 mg/kg of diet di-n-octyltin dichloride (DOTC) from 2 weeks premating (F0-generation) up to PND 61–70 (F1-generation). [18F]FDG PET was performed on postnatal day (PND) 17, 21, 35, 61. The trajectories of brain development from birth to adolescence and from adolescence to adulthood differ between the two groups, but no between-group differences were observed at any timepoint (Kruskal–Wallis with Newman Keuls post-hoc comparison).](/cms/asset/39b334bf-aee6-4bab-afb1-f98873e20490/itxm_a_2281610_f0006_b.jpg)
DOTC affects genes involved in the development of the brain and immune system
Cerebellar and cerebral RNA extracts of the control and DOTC-exposed F1-animals were subjected (PND 21 and 69 ± 1) to microarray gene expression profiling. To identify molecular mechanisms underlying the effects of DOTC on rat (brain) development and neural function, differentially expressed genes in the cerebrum and cerebellum were subjected to pathway analyses. The largest difference in gene expression (all dose groups) is determined by tissue type (cerebellum > cerebrum), followed by developmental phase (PND 21 > PND 69 ± 1) (Supplemental Figure S4). DOTC had an effect on developmental pathways and immune system development (). shows the networks that are significantly (p < .05) altered by DOTC exposure. Relevant genes affected by at least one of the DOTC doses were Nrgn, Shank3, Igf1r, Cck, Apba2, Foxp2 (involved in neurodevelopment and neural function), and LOC679869, Itga11, Arhgap5, Cd47, Dlg1, Gas6, Cml5, Mef2c (involved in cell size, cell proliferation and organ development, including immune system development). Especially Mef2c and Gas6 are key regulators of microglia functioning. For neither of the above-described genes, a dose dependent effect was observed in both brain regions (Supplemental Figure S5). However, especially in the cerebellum a difference in expression was observed between day 21 and day 70. For the cerebellum the strongest effect was seen for LOC679869 (β = −0.02, p = 4.0·10−5), Cml5 (β = 0.01, p = 7.3·10−5) and Nrgn (β = −0.03, p = 1.8·10−3). For the cerebrum, this was the case for Cml5 (β = 0.02, p = 4.3·10−10), Cd47 (β = 0.01, p = 3.2·10−8), Shank3 (β = 0.01, p = 1.6·10−5). Heatmaps of differentially expressed genes are provided in Supplemental Figure S6.
Figure 7. Biological process categories significantly overrepresented among 52 differentially expressed genes upon di-n-octyltin dichloride (DOTC) treatment (male F1-animals; all doses and time points; p < .05 is at value of 1.3). exposure to DOTC at a dose of 0, 3, 10 or 30 mg/kg of diet occurred from 2 weeks premating (F0-generation) up to postnatal day 61–70 (F1-generation).
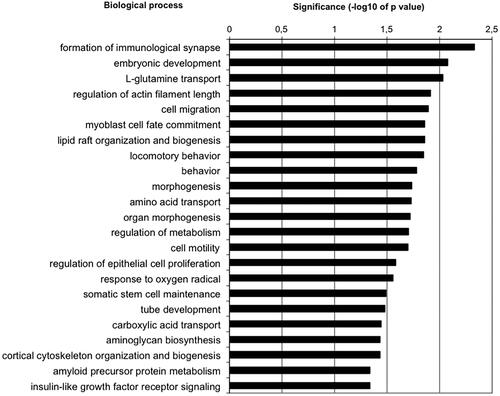
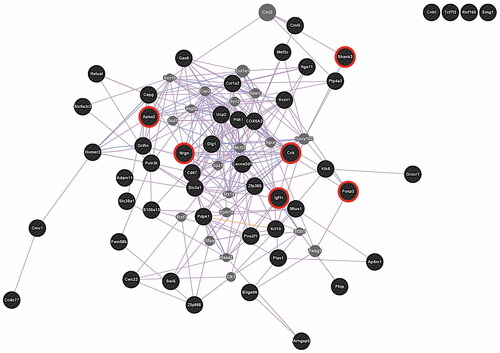
Figure 8. Network of 52 differentially expressed genes upon di-n-octyltin dichloride treatment (male F1-animals; all doses and time points). red circles mark genes involved in processes of neurodevelopment/neural function, and/or are associated with autism. Exposure to DOTC at a dose of 0, 3, 10 or 30 mg/kg of diet occurred from 2 weeks premating (F0-generation) up to postnatal day 61–70 (F1-generation).
Discussion
The aim of this study was to explore the effect of DOTC exposure on structural and functional brain development in rats in an extended one-generation reproductive toxicity study, according to OECD TG 443 (OECD Citation2011a, Citation2011b, Citation2013; ECHA Citation2015). In the OECD TG 443 scenario, exposure starts before conception (F0-generation) and lasts up to PND 69 ± 1 (F1-generation) with regard to the rats selected for developmental neurotoxicity testing. Given the notion of an affected maternal (Menke et al. Citation2012) and developing immune system (Smialowicz et al. Citation1988; Tonk et al. Citation2011), we hypothesized that normal brain development is also disturbed by the immunotoxicant DOTC, because there is increasing evidence that the immune system plays a crucial role in brain development – especially at embryonic age (Ginhoux et al. Citation2010, Citation2013; Paolicelli et al. Citation2011; Schlegelmilch et al. Citation2011; Bilbo and Schwarz Citation2012; Harry and Kraft Citation2012; Harry Citation2013; Nayak et al. Citation2014; Ueno and Yamashita Citation2014). The results of the present study confirmed our hypothesis of altered neurodevelopment under the given DOTC exposure scenario of OECD TG 443. Key findings were a transiently enlarged brain region volume (PND 21) derived from MRI and altered SG calculated from brain volume and weight. [18F]FDG PET imaging and auditory startle response suggest a compromised brain function. Microarray gene expression profiling corroborates a time-dependent effect of DOTC on structural brain development and identifies key regulators of these processes.
Changes in brain structure development may originate from alterations in (1) apoptosis (peak on PND 1, strong decrease during the first week after birth, followed by mild decrease thereafter (White and Barone Citation2001), (2) myelin formation (start PND 10-12, peak on PND 20 and slow continuous and prolonged increase thereafter) and (3) neuropil development (start embryonic day 13 and prolonged increase thereafter) (Rice and Barone Citation2000; Quarles et al. Citation2006). The neuropil –the total mass of axonal, dendritic, and glial processes– accounts for about 50% of the brain’s grey matter, cell bodies, and interstitial space for about 20% each, and vasculature for only 5% (Thomas et al. Citation2012). DOTC –in the dose and exposure scenario used– might have altered the amount of neuropil through effects on one of the mechanisms involved in dendrite morphogenesis (Jan and Jan Citation2010). Myelin formation is not likely to directly contribute to the volume changes, since this involves processes occurring during later time windows. A contribution of disturbed apoptosis to the volume changes, however, cannot be ruled out. During embryonic neurogenesis, an excess of neuronal cells are produced. The excess of neurons that do not form functional synaptic connections are eliminated by neuronal apoptosis during normal brain development. Interference of DOTC with apoptotic pruning of dysfunctional neurons might be a plausible explanation for the larger brain volume observed in this study. In rat brain, SG increases up to PND 21 (Johansson and Linder Citation1982). In the neonatal human brain, the water content reduces from about 90% at birth to about 82% after one year, and remains more or less stable or reduces extremely slowly thereafter, implying normal brain SG increases at an early age (Dobbing and Sands Citation1973). The lower brain SG seen in DOTC exposed animals at PND 21 suggests an increased water content, which in turn may reflect delayed brain development. The transiently enlarged brain volume and reduced SG were supported by transient brain hyper-metabolism as suggested by [18F]FDG PET. The abnormalities in brain development concurred with hyper-responsiveness in auditory startle response and a tendency toward hyperactivity in the DOTC-exposed young adult animals. Gene expression profiling showed more differentially affected genes on PND 21 than on PND 69 ± 1, and more in cerebellum than in cerebrum, supporting the observed transient alterations in brain development. Gene expression profiling also supported the hypothesis of a disrupted interaction between the immune system and normal brain development as possible cause of the observed alterations.
How to explain these findings given the fact that the nervous system was not reported as prime target organ for DOTC-induced toxicity before (ATSDR Citation2005; Dobson et al. Citation2006)? The extra parameters used here will have contributed to the sensitivity of the study. Moreover, the unique OECD TG 443 exposure scenario may have revealed the adverse effects of DOTC on normal brain development as a result of impairment of the (maternal) immune system. In parallel studies, Menke et al. (Citation2012) studied pregnancy and lactation as critical windows of vulnerability of the immune system for chemical exposure, and reported maternal toxicity at the same dose level of 30 mg/kg of diet DOTC. In the lactating females a number of parameters characterizing immune system activation were affected, demonstrating that differences in physiological condition can contribute to the susceptibility of the immune system for the toxic potential of a chemical. Smialowicz et al. (Citation1988) found that DOTC exposure (5–15 mg/kg of diet; 3 times per week) of rats between the age of 3 and 24 d transiently reduced the T-cell mitogen-induced proliferation of splenocytes 7 weeks after the last exposure. Tonk et al. (Citation2011), focusing on the effects of DOTC on the developing immune system with the same dose levels and exposure scenario, found a disturbed immune balance in the offspring on PND 21, 42 and 70. As the largest effects occurred on PND 42, the authors pointed at the relevance of studying several distinct test ages. The immune system, like the nervous system, continues to develop after birth and the different compartments of immune development have distinct critical windows of development (Landreth Citation2002). In our study, [18F]FDG PET imaging, auditory startle response and microarray gene expression profiling corroborated such a time-dependent effect of DOTC on structural brain development and compromised brain function. In fact, gene profiling identified key regulators of these processes, such as Nrgn, Shank3, Igf1r, Cck, Apba2, Foxp2, Cd47, Dlg1, Mef2c involved in neurodevelopment and neural function (Morozov and Freund Citation2003; Lai et al. Citation2003; Numakawa et al. Citation2004; Scorza et al. Citation2008; Zhang et al. Citation2009; Hiraoka et al. Citation2010; Grabrucker et al. Citation2011; Hami et al. Citation2014; Ryoo et al. Citation2015). Other affected genes, like LOC679869, Itga11, Arhgap5, Cd47, Dlg1, Gas6, Cml5, Mef2c, Foxp2, are known to be involved in cell size, cell proliferation and organ development (Chakravarty et al. Citation2000; Popsueva et al. Citation2001; Carroll Citation2005; Sabio et al. Citation2005; Muñoz et al. Citation2009; Figeac et al. Citation2010; Ji et al. Citation2011; Haase et al. Citation2013).
It is tempting to speculate on the underlying mechanisms responsible for the DOTC-related neurotoxicity and to raise possible concerns for man. By now, it is generally accepted that normal development of the immune system is key to healthy brain development, and disruption of the development of the immune system has been suggested as possible cause of certain neurodevelopmental disorders (Easson and Woodbury-Smith Citation2014). Amongst them is autism spectrum disorder (Gottfried et al. Citation2015), for which early transient brain overgrowth (Hardan et al. Citation2001; Aylward et al. Citation2002; Courchesne and Pierce Citation2005; Hazlett et al. Citation2011; Lewis et al. Citation2013), effects on startle response (Takahashi et al. Citation2014), altered motor skills (Memari et al. Citation2014; Sacrey et al. Citation2014) and involvement of genes like Shank 3, Igf1r, Cck, Apba2 and Foxp2 have been described (Muhle et al. Citation2004; Babatz et al. Citation2009; Persico and Napolioni Citation2013; Zhu et al. Citation2014; Hevner Citation2015; Iourov et al. Citation2015; Yoo Citation2015).
We conclude that the immunotoxicant DOTC induced both neurodevelopmental and immunodevelopmental abnormalities under the OECD TG 443 scenario. However, most effects of DOTC appear transient, as they were observed on PND21, but not anymore on PND61. Yet, long-term effects cannot be excluded, since it is known that delayed neuronal development can have effects later in life. Neurodevelopmental impairment by DOTC was likely detected in this study, because the exposure started before fertilization, and additional parameters were used to study neurodevelopment, including imaging and genetics. Indeed, imaging showed enlarged regions (MRI) and altered metabolism ([18F]FDG PET) in DOTC-exposed brains. This matched with hyper-responsiveness in the startle response and in hyperactivity in young adult rats. Several genes, which act as key regulators in the development and function of the neural as well as the immune system, were activated. Neurodevelopmental impairment seems to be associated with alterations in the immune system, which would support the existence of a relationship between the immune and nervous systems in normal development and maintenance of health.
Supplemental Material
Download MS Word (8.9 MB)Acknowledgements
The authors like to thank Marijana Radonjic and Rob Stierum for assistance in the analysis and interpretation of the genomics data, and helpful discussions; Gerard van Beek and Lidy van Oostrum for technical support on animal care and necropsy; Linda van der Horst-Groeneveld and Marlies Otto for behavioral testing and histotechnical support; Anja Dijkstra for study assistance and archiving; Jurgen Sijbesma for his support in the PET imaging studies. Special thanks go to postgraduate, graduate and undergraduate students participating on different aspects of the study: Anke Wesselius (neurodevelopment study and PET), Jasper Swierstra, Luc Blaauw, Lianne Damptsteeg, Lotte Houtepen and Martje de Groot (neurodevelopment study); Nadine Jetten and Maria Berk (MRI); Bart Voet and Mark Boogaard (PET); Fariza Boualala (graphics). The fruitful discussions with our partners from the National Institute for Public Health and the Environment (RIVM, Bilthoven, The Netherlands) Elisa C.M. Tonk, Aldert H. Piersma and Henk van Loveren, are gratefully acknowledged.
Disclosure statement
No potential conflict of interest was reported by the author(s).
Data availability statement
The data that support the findings of this study are available from the corresponding author, DMGdG, upon reasonable request.
Additional information
Funding
References
- Adams J, Buelke-Sam J, Kimmel CA, Nelson CJ, Reiter LW, Sobotka TJ, et al. 1985. Collaborative behavioral teratology study: protocol design and testing procedure. Neurobehav Toxicol Teratol. 7:579–586.
- Aylward E, Minshew N, Field K, Sparks B, Singh N. 2002. Effects of age on brain volume and head circumference in autism. Neurology. 59(2):175–183. doi: 10.1212/wnl.59.2.175.
- Andersen SL. 2003. Trajectories of brain development: point of vulnerability or window of opportunity? Neurosci Biobehav Rev. 27(1–2):3–18. doi: 10.1016/s0149-7634(03)00005-8.
- ATSDR (Agency for Toxic Substances and Disease Registry). 2005. Toxicological profile for tin and tin compounds. http://www.atsdr.cdc.gov/toxprofiles/tp55.pdf.
- Babatz TD, Kumar RA, Sudi J, Dobyns WB, Christian SL. 2009. Copy number and sequence variants implicate APBA2 as an autism candidate gene. Autism Res. 2(6):359–364. doi: 10.1002/aur.107.
- Bilbo SD, Schwarz JM. 2012. The immune system and developmental programming of brain and behavior. Front Neuroendocrinol. 33(3):267–286. doi: 10.1016/j.yfrne.2012.08.006.
- Blakemore SJ. 2012. Imaging brain development: the adolescent brain. Neuroimage. 61(2):397–406. doi: 10.1016/j.neuroimage.2011.11.080.
- Brush FR. 1962. The effects of intertrial interval on avoidance learning in the rat. J Comp Physiol Psychol. 55(5):888–892. doi: 10.1037/h0045131.
- Brush FR. 1971. Retention of aversively motivated behavior. In: Brush FR, editor. Adverse conditioning and learning. New York: Academic Press; p. 401–465.
- Brush FR, Knaff PR. 1959. A device for detecting and controlling automatic programming of avoidance-conditioning in a shuttle-box. Am. J. Psychol. 72(2):275–278. doi: 10.2307/1419377.
- Buchanan J, Elabbady L, Collman F, Jorstad NL, Bakken TE, Ott C, Glatzer J, Bleckert AA, Bodor AL, Brittain D, et al. 2022. Oligodendrocyte precursor cells ingest axons in the mouse neocortex. Proc Natl Acad Sci USA. 119(48):e2202580119. doi: 10.1073/pnas.2202580119.
- Carroll SB. 2005. Evolution at two levels: on genes and form. PLOS Biol. 3(7):e245. doi: 10.1371/journal.pbio.0030245.
- Chakravarty G, Roy D, Gonzales M, Gay J, Contreras A, Rosen JM. 2000. P190-B, a Rho-GTPase-activating protein, is differentially expressed in terminal end buds and breast cancer. Cell Growth Differ. 11(7):343–354.
- Courchesne E, Pierce K. 2005. Brain overgrowth in autism during a critical time in development: implications for frontal pyramidal neuron and interneuron development and connectivity. Int J Dev Neurosci. 23(2–3):153–170. doi: 10.1016/j.ijdevneu.2005.01.003.
- de Groot DMG, Bos-Kuijpers MHM, Kaufmann WSH, Lammers JHCM, O'Callaghan JP, Pakkenberg B, Pelgrim MTM, Waalkens-Berendsen IDH, Waanders MM, Gundersen H-JJ. 2005a. Regulatory developmental neurotoxicity testing: a model study focussing on conventional neuropathology endpoints and other perspectives. Environ Toxicol Pharmacol. 19(3):745–755. doi: 10.1016/j.etap.2004.
- de Groot DMG, Hartgring S, van de Horst L, Moerkens M, Otto M, Bos-Kuijpers MHM, Kaufmann WSH, Lammers JHCM, O'callaghan JP, Waalkens-Berendsen IDH, et al. 2005b. 2D and 3D assessment of neuropathology in rat brain after prenatal exposure to methylazoxymethanol, a model for developmental neurotoxicty. Reprod Toxicol. 20(3):417–432. doi: 10.1016/j.reprotox.2005.04.006.
- De Vries EFJ, Doorduin J, Dierckx RA, van Waarde A. 2008. Evaluation of [11C]rofecoxib as PET tracer for cyclooxygenase 2 overexpression in rat models of inflammation. Nucl Med Biol. 35(1):35–42. doi: 10.1016/j.nucmedbio.2007.07.015.
- Dobbing J, Sands J. 1973. Quantitative growth and development of human brain. Arch Dis Child. 48(10):757–767. doi: 10.1136/adc.48.10.757.
- Dobson S, Howe PD, Floyd P. 2006. Mono- and disubstituted methyltin, butyltin, and octyltin compounds. Geneva: World Health Organization. http://www.inchem.org/documents/cicads/cicads/cicad73.pdf.
- Easson A, Woodbury-Smith M. 2014. The role of prenatal immune activation in the pathogenesis of autism and schizophrenia: a literature review. Res Autism Spectr Disord. 8(3):312–316. doi: 10.1016/j.rasd.2013.12.007.
- ECHA (European Chemicals Agency). 2015. Guidance on information requirements and chemical safety assessment chapter R.7a: endpoint specific guidance (Version 4.0 July 2015; Reference: ECHA-15-G-04-EN; ISBN: 978-92-9247-411-9) Section R.7.6 Reproductive toxicity: 352-433. http://echa.europa.eu/documents/10162/13632/information_requirements_r7a_en.pdf.
- European Commission. 1986. Council Directive 86/609/EEC of 24 November 1986 on the approximation of laws, regulations and administrative provisions of the Member States regarding the protection of animals used for experimental and other scientific purposes. Official Journal L 358:1–28.
- Figeac F, Uzan B, Faro M, Chelali N, Portha B, Movassat J. 2010. Neonatal growth and regeneration of beta-cells are regulated by the Wnt/beta-catenin signaling in normal and diabetic rats. Am J Physiol Endocrinol Metab. 298(2):E245–56. doi: 10.1152/ajpendo.00538.2009.
- Garcia-Finana M, Cruz-Orive LM, Mackay CE, Pakkenberg B, Roberts N. 2003. Comparison of MR imaging against physical sectioning to estimate the volume of human cerebral compartments. Neuroimage. 18(2):505–516. doi: 10.1016/s1053-8119(02)00021-6.
- Gottfried C, Bambini-Junior V, Francis F, Riesgo R, Savino W. 2015. The impact of neuroimmune alterations in autism spectrum disorder. Front Psychiatry. 6:121. doi: 10.3389/fpsyt.2015.00121.
- Grabrucker AM, Knight MJ, Proepper C, Bockmann J, Joubert M, Rowan M, Nienhaus GU, Garner CC, Bowie JU, Kreutz MR, et al. 2011. Concerted action of zinc and ProSAP/Shank in synaptogenesis and synapse maturation. Embo J. 30(3):569–581. doi: 10.1038/emboj.2010.336.
- Gundersen, H J, Jensen, E B, Kiêu, K, Nielsen J. (1999). The efficiency of systematic sampling in stereology - reconsidered.J Microsc, Pt 3. 193: 199–211. doi: 10.1046/j.1365-2818.1999.00457.x.
- Kroustrup JP, Gundersen HJ. 1983. Optimizing sampling efficiency of stereological studies in biology: or 'do more less well!. J Microsc. 132(Pt 1):43–55. doi: 10.1111/j.1365-2818.1981.tb01199.x.
- Ginhoux F, Greter M, Leboeuf M, Nandi S, See P, Gokhan S, Mehler MF, Conway SJ, Ng LG, Stanley ER, et al. 2010. Fate mapping analysis reveals that adult microglia derive from primitive macrophages. Science. 330(6005):841–845. doi: 10.1126/science.1194637.
- Ginhoux F, Lim S, Hoeffel G, Low D, Huber T. 2013. Origin and differentiation of microglia. Front Cell Neurosci. 7:45. doi: 10.3389/fncel.2013.00045.
- Haase TN, Rasmussen M, Jaksch CAM, Gaarn LW, Petersen CK, Billestrup N, Nielsen JH. 2013. Growth arrest specific protein (GAS) 6: a role in the regulation of proliferation and functional capacity of the perinatal rat beta cell. Diabetologia. 56(4):763–773. doi: 10.1007/s00125-012-2821-9.
- Hami J, Kheradmand H, Haghir H. 2014. Gender differences and lateralization in the distribution pattern of insulin-like growth factor-1 receptor in developing rat hippocampus: an immunohistochemical study. Cell Mol Neurobiol. 34(2):215–226. doi: 10.1007/s10571-013-0005-x.
- Hardan AY, Minshew NJ, Mallikarjuhn M, Matcheri S, Keshavan MD. 2001. Brain Volume in Autism. J Child Neurol. 16(6):421–424. doi: 10.1177/088307380101600607.
- Harry GH. 2013. Microglia during development and aging. Pharmacol Ther. 139(3):313–326. doi: 10.1016/j.pharmthera.2013.04.013.
- Harry GJ, Kraft AD. 2012. Microglia in the developing brain: a potential target with lifetime effects. Neurotoxicology. 33(2):191–206. doi: 10.1016/j.neuro.2012.01.012.
- Hazlett HC, Poe MD, Gerig G, Styner M, Chappell C, Smith RG, Vachet C, Piven J. 2011. Early brain overgrowth in autism associated with an increase in cortical surface area before age 2. Arch Gen Psychiatry. 68(5):467–476. doi: 10.1001/archgenpsychiatry.2011.39.
- Hevner RF. 2015. Brain overgrowth in disorders of RTK–PI3K–AKT signaling: a mosaic of malformations. Semin Perinatol. 39(1):36–43. doi: 10.1053/j.semperi.2014.10.006.
- Hiraoka S, Kajii Y, Kuroda Y, Umino A, Nishikawa T. 2010. The development- and phencyclidine-regulated induction of synapse-associated protein-97 gene in the rat neocortex. Eur Neuropsychopharmacol. 20(3):176–186. doi: 10.1016/j.euroneuro.2009.08.007.
- Iourov IY, Vorsanova SG, Voinova VY, Yurov YB. 2015. 3p22.1p21.31 microdeletion identifies CCK as Asperger syndrome candidate gene and shows the way for therapeutic strategies in chromosome imbalances. Mol Cytogenet. 8(1):82. doi: 10.1186/s13039-015-0185-9.
- Ison JR. 1984. Reflex modification as an objective test for sensory processing following toxicant exposure. Neurobehav Toxicol Teratol. 6(6):437–445.
- Jan Y-N, Jan LY. 2010. Branching out: mechanisms of dendritic arborization. Nat Rev Neurosci. 11(5):316–328. doi: 10.1038/nrn2836.
- Ji H, Long V, Briody V, Chien EK. 2011. Progesterone modulates integrin alpha2 (ITGA2) and alpha11 (ITGA11) in the pregnant cervix. Reprod Sci. 18(2):156–163. doi: 10.1177/1933719110382305.
- Johansson B, Linder L. 1982. Specific gravity of brain tissue during maturation. Acta Neurol Scand. 66(5):575–581. doi: 10.1111/j.1600-0404.1982.tb03145.x.
- Kettenmann H, Hanisch UK, Noda M, Verkhratsky A. 2011. Physiology of microglia. Physiol Rev. 91(2):461–553. doi: 10.1152/physrev.00011.2010.
- Kishi H, Nemoto M, Enomoto M, Shinoda M, Kawanobe T, Matsui H. 2006. Acute toxic effects of dioctyltin on immune system of rats. Environ Toxicol Pharmacol. 22(2):240–247. doi: 10.1016/j.etap.2006.04.007.
- Lai CS, Gerrelli D, Monaco AP, Fisher SE, Copp AJ. 2003. FOXP2 expression during brain development coincides with adult sites of pathology in a severe speech and language dis- order. Brain. 126(Pt 11):2455–2462. doi: 10.1093/brain/awg247.
- Landreth KS. 2002. Critical windows in the development of the rodent immune system. Hum Exp Toxicol. 21(9–10):493–498. doi: 10.1191/0960327102ht287oa.
- Lewis JD, Theilmann RJ, Townsend J, Evans AC. 2013. Network efficiency in autism spectrum disorder and its relation to brain overgrowth. Front Hum Neurosci. 7:845. doi: 10.3389/fnhum.2013.00845.
- McAllister WR, McAllister DE. 1971. Behavioral measurement of conditioned fear. In: FR Brush, editor. Adverse conditioning and learning. New York: Academic Press. p. 105–179.
- McNulty V, Cruz-Orive LM, Roberts N, Holmes CJ, Gual-Arnau X. 2000. Estimation of brain compartment volume from MR Cavalieri slices. J Comput Assist Tomogr. 24(3):466–477. doi: 10.1097/00004728-200005000-00021.
- Menke A, Wolterbeek A, Snel C, Bruijntjes J, de Groot D, van Oostrum L, Waalkens I, Kuper CF. 2012. Potentially increased sensitivity of pregnant and lactating female rats to immunotoxic agents. Toxicol Pathol. 40(2):255–260. doi: 10.1177/0192623311428476.
- Memari AH, Ghanouni P, Shayestehfar M, Ghaheri B. 2014. Postural control impairments in individuals with autism spectrum disorder: a critical review of current literature. Asian J Sports Med. 5(3):e22963. doi: 10.5812/asjsm.22963.
- Mogil JS, Wilson SG, Wan Y. 2001. Chapter 2. Assessing nociception in murine subjects. In: Kruger L, editor. Methods in pain research, frontiers in neuroscience. Boca Raton: CRC Press; p. 11–39.
- Morozov YM, Freund TF. 2003. Postnatal development and migration of cholecystokinin-immunoreactive interneurons in rat hippocampus. Neuroscience. 120(4):923–939. doi: 10.1016/s0306-4522(03)00409-3.
- Moser VC. 2010. Behavioral screening for toxicology. In: McQueen CA, editor. Comprehensive toxicology. 2nd ed. Vol. 13. Oxford: Elsevier Publishers; p. 337–350.
- Moser VC. 2011. Functional assays for neurotoxicity testing. Toxicol Pathol. 39(1):36–45. doi: 10.1177/0192623310385255.
- Moser VC, Becking GC, MacPhail RC, Kulig BM. 1997. The IPCS collaborative study on neurobehavioral screening methods. Fundam Appl Toxicol. 35(2):143–151. doi: 10.1006/faat.1996.2276.
- Moser VC, McDaniel KM, Phillips PM. 1991. Rat strain and stock comparisons using a functional observational battery: baseline values and effects of Amitraz. Toxicol Appl Pharmacol. 108(2):267–283. doi: 10.1016/0041-008x(91)90117-w.
- Muhle R, Trentacoste SV, Rapin I. 2004. The genetics of autism. Pediatrics. 113(5):e472–e486. doi: 10.1542/peds.113.5.e472.
- Muñoz JP, Collao A, Chiong M, Maldonado C, Adasme T, Carrasco L, Ocaranza P, Bravo R, Gonzalez L, Díaz-Araya G, et al. 2009. The transcription factor MEF2C mediates cardiomyocyte hypertrophy induced by IGF-1 signaling. Biochem Biophys Res Commun. 388(1):155–160. doi: 10.1016/j.bbrc.2009.07.147.
- Nayak D, Roth TL, McGavern DB. 2014. Microglia development and function. Annu Rev Immunol. 32(1):367–402. doi: 10.1146/annurev-immunol-032713-120240.
- Numakawa T, Ishimoto T, Suzuki S, Numakawa Y, Adachi N, Matsumoto T, Yokomaku D, Koshimizu H, Fujimori KE, Hashimoto R, et al. 2004. Neuronal roles of the integrin-associated protein (IAP/CD47) in developing cortical neurons. J Biol Chem. 279(41):43245–43253. doi: 10.1074/jbc.M406733200.
- OECD (Organisation for Economic Co-operation and Development). 1998. OECD series on principles of good laboratory practice and compliance monitoring, Number 1, OECD principles on good laboratory practice (as revised in 1997), ENV/MC/CHEM(98)17. http://www.oecd.org/officialdocuments/publicdisplaydocumentpdf/?cote=env/mc/chem(98)17&doclanguage=en.
- OECD (Organisation for Economic Co-operation and Development. 2007. OECD guidelines for the testing of chemicals/section 4: Health Effects Test No. 426: Developmental Neurotoxicity Study. doi: 10.1787/9789264067394.http://www.oecdbookshop.org/oecd/display.asp?K=5L4FG25MNKXS&DS=Test-No.-426-Developmental-Neurotoxicity-Study.
- OECD (Organisation for Economic Co-operation and Development). 2011a. OECD Guidelines for an Extended One-Generation Reproductive Toxicity Study Test No. 443. doi: 10.1787/9789264122550.http://www.oecd-ilibrary.org/docserver/download/9712211e.pdf?expires=1451807588&id=id&accname=guest&checksum=F8C982C7664EF1A08F1BDD18A8F5CB0A.
- OECD (Organisation for Economic Co-operation and Development). 2011b. OECD Guidance Document No 117. Guidance document 117 on the current implementation of internal triggers in the test guideline 443 for an extended one-generation reproductive toxicity study, in the United States and Canada. ENV/JM/MONO(2011)21. http://www.oecd.org/chemicalsafety/testing/seriesontestingandassessmentpublicationsbynumber.htm.
- OECD (Organisation for Economic Co-operation and Development). 2013. OECD Guidance Document No 151. Guidance document supporting OECD test guideline 443 on the extended one-generation reproductive toxicity test. ENV/JM/MONO(2013)10. http://www.oecd.org/chemicalsafety/testing/seriesontestingandassessmentpublicationsbynumber.htm.
- Paolicelli RC, Bolasco G, Pagani F, Maggi L, Scianni M, Panzanelli P, Giustetto M, Ferreira TA, Guiducci E, Dumas L, et al. 2011. Synaptic pruning by microglia is necessary for normal brain development. Science. 333(6048):1456–1458. doi: 10.1126/science.1202529.
- Paxinos G, Watson C. 1986. The rat brain in stereotaxic coordinates. 2nd ed. New York, London: Academic.
- Persico AM, Napolioni V. 2013. Autism genetics. Behav Brain Res. 251:95–112. doi: 10.1016/j.bbr.2013.06.012.
- Popsueva AE, Luchinskaya NN, Ludwig AV, Zinovjeva OY, Poteryaev DA, Feigelman MM, Ponomarev MB, Berekelya L, Belyavsky AV. 2001. Overexpression of camello, a member of a novel protein family, reduces blastomere adhesion and inhibits gastrulation in Xenopus laevis. Dev Biol. 234(2):483–496. doi: 10.1006/dbio.2001.0261.
- Quarles R, Macklin W, Morell P. 2006. Myelin formation, structure and biochemistry. In: Siegel G, Albers RW, Scott D, Brady S, Price D, editors. Basic neurochemistry: molecular, cellular and medical aspects. 7th ed. Amsterdam: Elsevier, Academic Press.
- Quillfeldt JA. 2006. Behavioral methods to study learning and memory in rats. In: Andersen ML, Tufik S, editor. Rodent model as tools in ethical biomedical research. Cham: Springer; p. 271–331.
- Radonjic M, de Haan JR, van Erk MJ, van Dijk KW, van den Berg SAA, de Groot PJ, Müller M, van Ommen B. 2009. Genome-wide mRNA expression analysis of hepatic adaptation to high-fat diets reveals switch from an inflammatory to steatotic transcriptional program. PLOS One. 4(8):e6646. doi: 10.1371/journal.pone.0006646.
- Radonjic M, Cappaert NLM, de Vries EFJ, de Esch CEF, Kuper FC, van Waarde A, Dierckx RAJO, Wadman WJ, Wolterbeek APM, Stierum RH, et al. 2013. Delay and impairment in brain development and function in rat offspring after maternal exposure to methylmercury. Toxicol Sci. 133(1):112–124. doi: 10.1093/toxsci/kft024.
- Raiders S, Han T, Scott-Hewitt N, Kucenas S, Lew D, Logan MA, Singhvi A. 2021. Engulfed by Glia: glial pruning in development, function, and injury across species. J Neurosci. 41(5):823–833. doi: 10.1523/JNEUROSCI.1660-20.2020.
- Rice D, Barone S. 2000. Critical periods of vulnerability for the developing nervous system: evidence from humans and animal models. Environ Health Perspect. 108(Suppl 3):511–533. doi: 10.1289/ehp.00108s3511.
- Roberts N, Garden AS, Cruz-Orive LM, Whitehouse GH, Edwards RHT. 1994. Estimation of fetal volume by MRI and stereology. Br J Radiol. 67(803):1067–1077. doi: 10.1259/0007-1285-67-803-1067.
- Roberts N, Puddephat MJ, McNulty V. 2000. The benefit of stereology for quantitative radiology. Br J Radiol. 73(871):679–697. doi: 10.1259/bjr.73.871.11089458.
- Ryoo K, Hwang SG, Kim KJ, Choi EJ. 2015. RC3/neurogranin negatively regulates extracellular signal-regulated kinase pathway through its interaction with Ras. Mol Cell Biochem. 402(1–2):33–40. doi: 10.1007/s11010-014-2311-0.
- Sabio G, Arthur JSC, Kuma Y, Peggie M, Carr J, Murray-Tait V, Centeno F, Goedert M, Morrice NA, Cuenda A. 2005. p38gamma regulates the localisation of SAP97 in the cytoskeleton by modulating its interaction with GKAP. Embo J. 24(6):1134–1145. doi: 10.1038/sj.emboj.7600578.
- Sacrey LA, Germani T, Bryson SE, Zwaigenbaum L. 2014. Reaching and grasping in autism spectrum disorder: a review of recent literature. Front Neurol. 5:6. doi: 10.3389/fneur.2014.00006.
- Schlegelmilch T, Henke K, Peri F. 2011. Microglia in the developing brain: from immunity to behavior. Curr Opin Neurobiol. 21(1):5–10. doi: 10.1016/j.conb.2010.08.004.
- Scorza CA, Cavalheiro EA, Scorza FA. 2008. Myocyte-specific enhancer binding factor 2C (MEF2C) expression in the dentate gyrus during development and after pilocarpine-induced status epilepticus: a preliminary report. Arq Neuropsiquiatr. 66(3B):731–735. doi: 10.1590/s0004-282x2008000500024.
- Sherman LR. 1995. Organotin toxicology. In: Patai S, Rappoport Z, editor. The chemistry of organic germanium, tin and lead compounds. vol. 1. New York: Wiley.
- Siemens AG Medical Solutions. 2009. Image viewing software ‘singo fastView’ [Online]. www.healthcare.siemens.nl/medical-imaging-it/syngo…/syngo-fastview.
- Simanek DE. 1996. Chapter 3. Propagation of Errors. Quotient rule, equation [3-5]. [Online]. https://www.lhup.edu/∼dsimanek/scenario/errorman/propagat.htm.
- Smialowicz RJ, Riddle MM, Rogers RR, Rowe DG, Luebke RW, Fogelson LD, Copeland CB. 1988. Immunologic effects of perinatal exposure of rats to dioctyltin dichloride. J Toxicol Environ Health. 25(4):403–422. doi: 10.1080/15287398809531220.
- Svahn AJ, Graeber MB, Ellett F, Lieschke GJ, Rinkwitz S, Bennett MR, Becker TS. 2013. Development of ramified microglia from early macrophages in the zebrafish optic tectum. Dev Neurobiol. 73(1):60–71. doi: 10.1002/dneu.22039.
- Takahashi H, Nakahachi T, Komatsu S, Ogino K, Iida Y, Kamio Y. 2014. Hyperreactivity to weak acoustic stimuli and prolonged acoustic startle latency in children with autism spectrum disorders. Mol Autism. 5(1):23. doi: 10.1186/2040-2392-5-23.
- Tau GZ, Peterson BS. 2010. Normal development of brain circuits. Neuropsychopharmacology. 35(1):147–168. doi: 10.1038/npp.2009.115.
- Utrecht Animal Welfare Body. Online. Dutch law ‘Experiments on Animals Act 1997’ / ‘Wet op de Dierproeven (WoD)’. Available at: https://ivd-utrecht.nl/en/infocentre/experiments-on-animals-act, https://wetten.overheid.nl/BWBR0003081/2019-01-01, www.vet.uu.nl/nca/userfiles/other/The_Dutch_Experiments_on_Animals_Act.pdf.
- Thomas AG, Dennis A, Bandettini PA, Johansen-Berg H. 2012. The effects of aerobic activity on brain structure. Front Psychol. 3:86. doi: 10.3389/fpsyg.2012.00086.
- Tonk ECM, de Groot DMG, Penninks AH, Waalkens-Berendsen IDH, Wolterbeek APM, Piersma AH, van Loveren H. 2011. Developmental immunotoxicity of di-octyltin dichloride (DOTC) in an extended one-generation reproductive toxicity study. Toxicol Lett. 204(2-3):156–163. doi: 10.1016/j.toxlet.2011.04.027.
- Ueno M, Yamashita T. 2014. Bidirectional tuning of microglia in the developing brain: from neurogenesis to neural circuit formation. Curr Opin Neurobiol. 27:8–15. doi: 10.1016/j.conb.2014.02.004.
- US EPA (US Environmental Protection Agency). 1996. Health effects test guidelines: OPPTS 870.8600 Developmental neurotoxicity screen (Public Draft). Docket ID: EPA712–C–96–258. http://nepis.epa.gov/Exe/ZyPDF.cgi/P100G6VA.PDF?Dockey=P100G6VA.PDF.
- US EPA (US Environmental Protection Agency). 1998. Health effects test guidelines OPPTS 870.6300 Developmental Neurotoxicity Study. Docket ID: EPA 712–C–98–239. http://nepis.epa.gov/Exe/ZyPDF.cgi/P100IRWO.PDF?Dockey=P100IRWO.PDF.
- Van Waarde A, Doorduin J, de Jong JR, Dierckx AR, Elsinga PH. 2008. Synthesis and preliminary evaluation of (S)-[(11)C]-exaprolol, a novel beta-adrenoceptor ligand for PET. Neurochem Int. 52(4-5):729–733. doi: 10.1016/j.neuint.2007.09.009.
- White L, Barone S. 2001. Qualitative and quantitative estimates of apoptosis from birth to senescence in the rat brain. Cell Death Differ. 8(4):345–356. doi: 10.1038/sj.cdd.4400816.
- Yoo H. 2015. Genetics of autism spectrum disorder: current status and possible clinical applications. Exp Neurobiol. 24(4):257–272. doi: 10.5607/en.2015.24.4.257.
- Zhan Y, Paolicelli RC, Sforazzini F, Weinhard L, Bolasco G, Pagani F, Vyssotski AL, Bifone A, Gozzi A, Ragozzino D, et al. 2014. Deficient neuron-microglia signaling results in impaired functional brain connectivity and social behavior. Nat Neurosci. 17(3):400–406. doi: 10.1038/nn.3641.
- Zhang Y, Wang Y-G, Zhang Q, Liu X-J, Liu X, Jiao L, Zhu W, Zhang Z-H, Zhao X-L, He C, et al. 2009. Interaction of Mint2 with TrkA is involved in regulation of nerve growth factor-induced neurite outgrowth. J Biol Chem. 284(18):12469–12479. doi: 10.1074/jbc.M809214200.
- Zhou Q, Bao Y, Zhang X, Zeng L, Wang L, Wang J, Jiang W. 2014. Optimal interval for hot water immersion tail-flick test in rats. Acta Neuropsychiatr. 26(4):218–222. doi: 10.1017/neu.2013.57.
- Zhu L, Wang X, Li X-L, Towers A, Cao X, Wang P, Bowman R, Yang H, Goldstein J, Li Y-J, et al. 2014. Epigenetic dysregulation of SHANK3 in brain tissues from individuals with autism spectrum disorders. Hum Mol Genet. 23(6):1563–1578. doi: 10.1093/hmg/ddt547.