
Abstract
The surprising results published by FIRE-3 revealed that the overall survival (OS) of RAS wild-type metastatic colorectal cancer (mCRC) patients treated with Cetuximab(Cmab) and FOLFIRI combination was prolonged to 33.1 months. The substantial increase in testing and treatment costs, however, impose a considerable health burden on patients and society. Hence the study was aimed to assess the cost-effectiveness of RAS screening before monoclonal antibodies (mAbs) therapy based on FIRE-3 study. Four groups were analyzed: group 1, patients with KRAS testing treated with Cmab and FOLFIRI; group 2, patients with RAS testing treated with Cmab and FOLFIRI; group 3, patients with KRAS testing treated with bevacizumab(Bmab) and FOLFIRI; group 4, patients with RAS testing treated with Bmab and FOLFIRI. A Markov model comprising 3 health states (progression-free survival, progressive disease and death) was built. The costs were calculated from a Chinese payer perspective, and survival was reported in quality-adjusted life-months (QALMs). Average total lifetime costs ranged from $104,682.44 (RAS-Bmab) to $136,867.44 (RAS-Cmab), while the survival gained varied from 16.88 QALMs in RAS-Bmab to 21.85 QALMs in RAS-Cmab. The cost per QALM was $6,263.86 for RAS-Cmab, $6,145.84 for KRAS-Bmab, $6,201.57 for RAS-Bmab and $6,960.70 for KRAS-Cmab respectively. The KRAS-Cmab strategy was dominated by the other 3 groups. The first-treatment cost of RAS-Cmab was the most influential one to the model. In all, the RAS screening prior to Cmab treatment in mCRC seems to be a cost-effective strategy in the time of monoclonal antibodies (mAbs) therapy with the most gained QALMs.
Abbreviations
| mCRC | = | metastatic colorectal cancer |
| Cmab | = | cetuximab |
| Bmab | = | bevacizumab |
| QALM | = | quality-adjusted life-months |
| OS | = | overall survival |
| PFS | = | progression-free survival |
| PD | = | progression disease |
| AE | = | adverse event |
| CE | = | cost-effectiveness |
| ICERs | = | incremental cost-effectiveness ratios |
| FOLFIRI | = | irinotecan, leucovorin, fluorouracil |
| FOLFOX | = | oxaliplatin, leucovorin, fluorouracil |
| IRI | = | irinotecan |
| 5-Fu | = | fluorouracil |
| WTP | = | willingness to pay |
| ECOG | = | Eastern Cooperative Oncology Group |
| Pmab | = | panitumumab |
| EGFFR | = | epidermal growth factor receptor |
| VEGF | = | vascular endothelial growth factor |
| mAbs | = | monoclonal antibodies. |
Introduction
Colorectal cancer (CRC) is one of the most common malignant neoplasms worldwide, with over one million new cases and more than 600,000 deaths estimated to occur annually.Citation1 Similarly, the prevalence of CRC has recently increased rapidly in China, the incidence growth of which reached 4.2‰ with a high percentage among young patients. The incidence and prevalence of CRC in China are consistent with many other underdeveloped countries.Citation2
To the best of our knowledge, the disease stage of CRC at the time of diagnosis is a significant prognostic factor.Citation3 Nevertheless, more than 50% patients are found metastatic disease when first diagnosed, and approximately 50% will be found metastases with the disease progression.Citation4 Hence, the first-line strategy plays a key role in the whole treatments of metastatic CRC (mCRC). Fortunately, significant developments have been made in the territory of molecularly targeted therapy, for instance, cetuximab(Cmab), a monoclonal antibody of epidermal growth factor receptor(EGFR), and bevacizumab(Bmab) targeting vascular endothelial growth factor (VEGF). Therefore, an improved overall survival (OS) of more than 2 y becomes reality.
Recently, fascinating results of FIRE-3 published in Lancet Oncology which studied FOLFIRI plus Cmab versus FOLFIRI plus Bmab as first-line treatment for patients with mCRC.Citation5 The primary aim of the study was designed to conduct research on mCRC patients with KRAS (exon 2) codon 12/13 wild-type, and the outcome showed that OS was 28.7 months (95% CI 24.0–36.6) in Cmab group compared with 25.0 months (22.7–27.6) in the Bmab group (HR 0.77, 95% CI 0.62–0.96; p = 0.017). Additional, another surprising result of FIRE-3 revealed that OS of RAS wild-type mCRC patients treated with Cmab and FOLFIRI combination was prolonged to 33.1 months, which was a significant milestone for RAS testing prior to Cmab application.Citation5
What's more, to further determine the specific population that benefits the most from the anti-EGFR therapy, similar data related to Cmab efficacy were analyzed retrospectively in the trials of CRYSTAL and OPUS, and the results of both emphasized the importance of extended RAS analysis prior to anti-EGFR therapy.Citation6,7 Consequently, a broader mutation screening of RAS gene (at exons 2, 3, or 4 of both KRAS and NRAS) has been validated for personalization therapy in mCRC, as recommended in the NCCN guidelines (version 1.2015) and the European Medicine Agency.Citation8,9
Although more precise genetic mutation testing will guarantee personalized treatment, which could protect portions of population from unnecessary toxicity and socio-sanitary costs, the substantial supernumerary testing and treatment costs impose a considerable health burden on patients as well as society.Citation10 Hence the cost-effectiveness of RAS screening before anti-EGFR therapy in mCRC is urgently needed.
In the current study, we developed an economic model to explore the costs and effectiveness of RAS screening before monoclonal antibodies (mAbs) therapy in mCRC based on the results of FIRE-3 study.
Results
Effectiveness
The transitions diagram among model states is presented in . Based on the results of FIRE-3, different mutation screenings and treatment strategies were attributed to different clinical outcomes.Citation5 The median PFS was 10.0 months and median OS was 28.7 months in Cmab treatment after KRAS screening group, leading to 19.20 QALMs. In KRAS-Bmab group, the PFS and OS were 10.3 and 25.0 months, respectively, which resulted in 21.17 QALMs. For RAS-Bmab group, the PFS and OS were 10.2 and 25.6 months, respectively, leading to 16.88 QALMs. While in RAS-Cmab group, the PFS and OS were 10.4 and 33.1 months respectively, resulting in 21.85 QALMs, which was the longest among the 4 groups, and achieved gains of 2.65 QALMs compared with KRAS-Cmab strategy, gains of 0.68 QALMs with KRAS-Bmab and gains of 4.97 QALMs with RAS-Bmab, respectively.
Based on the equation mentioned above, monthly transition probability from PFS state to PFS state (pPFS-PFS), from the PFS to progression disease(PD) (pPFS-PD), from PFS to death (pPFS-death), from PD to PD (pPD-PD) and from PD to death (pPD-death) were described in , as well as the clinical outcomes of 4 groups.
Table 1. Efficacies and transition probabilities
Costs
Treatment related costs were evaluated from the Chinese perspective in 2014, and expressed as per month per patient in one transition cycle, which was calculated according to the treatment duration and total treatment cycles collected from the FRIE-3 report. Cost for KRAS screening was $146.34, and the RAS test as $556.10. Treatments of the second-line included Bmab plus FOLFOX, Bmab plus FOLFIRI, Bmab plus 5-Fu, Cmab, Cmab plus FOLFOX, Cmab plus irinotecan, 5-Fu and FOLFOX, the details of which were shown in . Information regarding 3/4AEs analyzed in the model was illustrated in
Table 2. Rates of second-line treatment in the study
Table 3. Incidence of AE (grade 3/4) related to costs collected from the FIRE-3.
The costs for PFS state (first_total), including regimen fees (first_treat), regular examine costs(first_test), adverse events related costs(AE) and KRAS/RAS test charge, were $ 8,347.97 for KRAS-Cmab group, $8,236.64 for RAS-Cmab group, $5,847.82 for KRAS-Bmab group and $5,549.26 for RAS-Bmab group per cycle per month per patient respectively. Meanwhile, PD state(second_total) costs, including regimen fees(second_treat) and regular examine costs(second_test), were $ 2,633.47 for KRAS-Cmab group, $2,169.42 for RAS-Cmab group, $3,255.77 for KRAS-Bmab group and $3,323.60 for RAS-Bmab group per cycle per month per patient respectively. Average total lifetime costs were $104,682.44 (RAS teating with Bmab), $130,093.27(KRAS teating with Bmab), $136,867.44 (RAS teating with Cmab) and $133,723.97 (KRAS treating with Cmab). Detail information was described in
Table 4. Results of the cost-effectiveness analysis
Cost-effectiveness analysis
Evidently, the KRAS-Cmab strategy was dominated by the other 3 groups, which meant KRAS-Cmab strategy was either more costly and/or the less effective compared other 3 strategies, with a cost of $6,963.70 per QALM, followed by $6,263.86 per QALM for RAS-Cmab, $6,201.57 per QALM for RAS-Bmab and $6,145.84 per QALM for KRAS-Bmab.
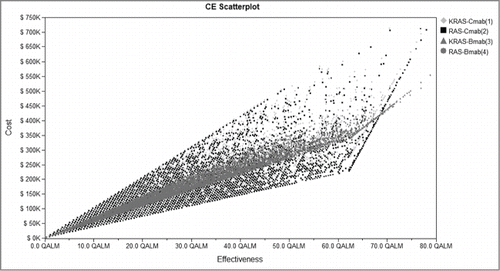
In the base-case analysis, the ICER of RAS-Cmab group compared with RAS-Cmab group was $1,186.22/QALM, $6,475.86/QALM in RAS-Bmab group and $9,962.0/QALM with KRAS-Bmab respectively. The comparison of costs and effects among 4 groups were pictured in , and scatterplot was showed in . With more effectiveness gain and relatively fewer costs, RAS-Cmab was likely to be a more cost-effective option in Cmab used groups. RAS-Bmab seemed as the most cost-effective strategy, but the gained QALM was the shortest. Results of the cost-effectiveness analysis were presented in
Figure 1. Markov model for metastatic colorectal cancer. According to the FIRE-3 profile, 4 groups were analyzed: group 1, patients with KRAS testing treated with Cmab and FOLFIRI; group 2, patients with RAS testing treated with Cmab and FOLFIRI; group 3, patients with KRAS testing treated with Bmab and FOLFIRI; group 4, patients with RAS testing treated with Bmab and FOLFIRI. A Markov model comprising 3 health states (progression-free survival, progressive disease and death) was built. mCRC,metastatic colorectal cancer; Cmab,cetuximab;Bmab,bevacizumab; PD, progression disease; PFS, progression-free survival; AE, adverse event.
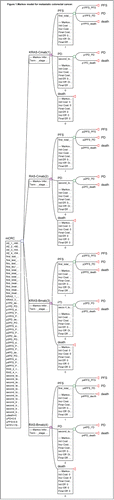
Figure 2. Cost-effectiveness pictured with 4 groups. Four groups were analyzed: group 1, patients with KRAS testing treated with Cmab and FOLFIRI; group 2, patients with RAS testing treated with Cmab and FOLFIRI; group 3, patients with KRAS testing treated with Bmab and FOLFIRI; group 4, patients with RAS testing treated with Bmab and FOLFIRI.The KRAS-Cmab strategy was dominated by the other 3 groups. mCRC, metastatic colorectal cancer; Cmab, cetuximab;Bmab, bevacizumab; QALM, quality-adjusted life-months.
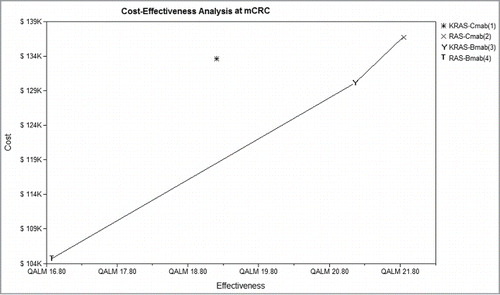
Figure 3. Cost-effectiveness scatterplot of 4 groups. Four groups were analyzed: group 1, patients with KRAS testing treated with Cmab and FOLFIRI; group 2, patients with RAS testing treated with Cmab and FOLFIRI; group 3, patients with KRAS testing treated with Bmab and FOLFIRI; group 4, patients with RAS testing treated with Bmab and FOLFIRI. Cost-effectiveness distribution of 4 groups. CE, Cost-effectiveness; Cmab, cetuximab;Bmab, bevacizumab.
Sensitivity analysis
To provide an insight of responsiveness of the model results to the changes of parameters analyzes in the study and to test the robustness of our results, one-way sensitivity analysis was applied. The variables in the sensitivity analysis varied at a range of ±20 %, and the results of which were shown in the tornado diagram pictured in
Figure 4. Tornado diagram of one-way sensitivity analysis. Tornado diagram summarized the results of one-way sensitivity analysis to identify model variables associated with the 4 strategies in the treatment of mCRC. The influential factors were listed descending with the variation of value. mCRC, metastatic colorectal cancer; AE, adverse event.
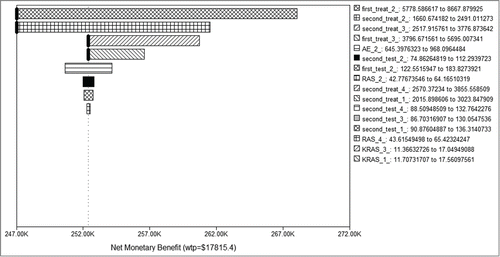
In the sensitivity analysis, changes in costs for chemotherapy of RAS-Cmab group in PFS state (first_treat_2_) had greatest impact on the results of the analysis. As the value of first_treat_2_ changed from $5,778.59 to $8,667.88, cost ranged significantly from $121,225.50 to $ 152,509.38 for RAS-Cmab group, and the cost/effect changed from $5,547.99 to $6,979.72 per QALM. Additionally, the cost-effectiveness analysis was also sensitive to the costs for chemotherapy of RAS-Cmab group in PD state(second_treat_2_), costs for chemotherapy of KRAS-Bmab group in PD state as well as PFS state (second_treat_3_, first_treat_3_). Besides, the cost of AE (ranking forth) and RAS teat (ranking eighth) affected the analysis.
Probabilistic sensitivity analysis (acceptability frontier)
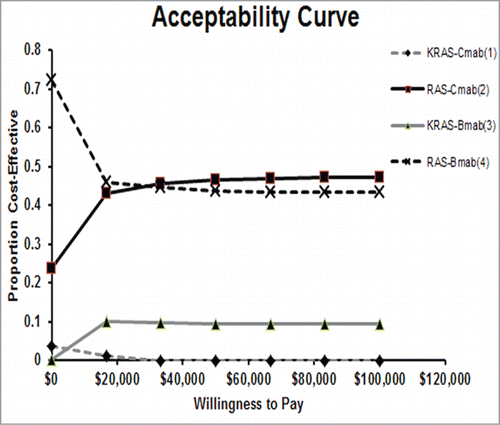
The cost-effectiveness acceptability frontier shows the probabilistic sensitivity analysis-based probability of strategies being cost-effective. For different willingness to pay (WTP) thresholds, different strategies are optimal. With the respect to WTP, as the value varied from $0 to $ 100,000, the acceptable proportion of RAS-Cmab group increased, while RAS-Bmab group decreased, which were shown in
Figure 5. Probabilistic sensitivity analysis (acceptability frontier). The cost-effectiveness acceptability frontier shows the probabilistic sensitivity analysis -based probability of strategies being cost-effective in 4 strategies. For different willingness to pay thresholds, different strategies are optimal. Cmab,cetuximab;Bmab,bevacizumab.
Discussion
Recent years, though we have witnessed a rapid development in the treatment of mCRC, the percentage of CRC patients developing metastases is considerably high.Citation3,11 It must be noted that only 70–80% mCRC patients with first-line treatment have the chance to second line therapy.Citation5 Hence, the first-line treatment should be regarded as the most important phase in the whole treatment of mCRC. The first-line strategy contributes most to the patients' clinical outcome compared with other lines, and influences the efficacies of subsequent treatments.Citation12 Basically, recent developments in the treatment of mCRC are mainly focused on the introduction of mAbs combined with chemotherapy as the first-line or in the subsequent treatment lines.Citation5 Among them, anti-EGFR and anti-VEGFR are wildly used, Cmab, panitumumab(Pmab), and Bmab.Citation13
Notably, the applications of mAbs significantly prolong the OS of mCRC patients. In patients with KRAS wide type, the OS was 28.7 months in Cmab /FOLFIRI compared with 25.0 months in Bmab/FOLFIRI in FIRE-3(p = 0.017), 34.2 months in Pmab/mFOLFOX6 compared with 24.3 months in Bmab/ mFOLFOX6 in PEAK(p = 0.009), and 29.9 months in Cmab /chemotherapy compared with 29.0 months in Bmab/chemotherapy in CALGB/SWOG 80405 (p>0.05).Citation5,14,15 According to the 3 trials, the pooling data favored the anti-EGFR mAbs over the anti-VEGFR mAb with hazard ratio of 0.83 (p = 0.003), which has exerted a profound impact on modern mCRC treatment.
Additionally, the final report of FIRE-3 also revealed that the combination of Cmab and FOLFIRI obviously improved the OS of RAS wild-type patients up to 33.1 months.Citation5 Further results suggested that the incidence of RAS mutation in KRAS wild-type mCRC patients varied from 15% to 20%.Citation5-7 What's worse, patients with additional RAS mutations beyond KRAS exon 2 (i.e. mutations in KRAS exons 3 and 4 and NRAS exons 2, 3, and 4) were lake the response to Cmab, resulting in a shorter OS of 16.4 months in FIRE-3 trial, 18.2 months in CRYSTAL trial, 18.4 months in OPUS trial and 17.1 months in PRIME trial.Citation16-19 Consequently, RAS testing prior to Cmab application is recommended by the NCCN guide lines.Citation9 However the substantial extra testing and treatment costs impose a considerable health burden on patients as well as society.
Until now, there is no cost-effectiveness analysis for the mCRC patients with RAS wild-type, and no head-to-head phase 3 study neither. Generally, whether the combination of mAbs in the treatment of CRC has sparked a spirited debate, and so has the screening for gene mutations, for instance, KRAS and BRAF. Some studies have suggested that mAbs have beneficial influence on patient therapy with cost-effectiveness while several others studies have contend that there is a disadvantage among the other strategies because of the excessive costs.Citation5,11,20-23 And worse still, most studies are outdated because the population analyzed only involves mCRC with KRAS wild-type, and are not based on recent clinical trial with informative head-to-head reports.Citation20
Owing to the situation mentioned above, we developed a cost-effectiveness model for RAS screening before mAbs therapy in mCRC based on the results of FIRE-3, a randomized, open-label, phase 3 trial with 592 KRAS wild-type analyzed. Our results showed that Cmab treatment after RAS screening achieved gains of 2.65 QALMs compared with KRAS-Cmab strategy, gains of 0.68 QALMs with KRAS-Bmab and gains of 4.97 QALMs with RAS-Bmab, respectively. Moreover, the cost per QALM was $6,263.86 for RAS-Cmab, $6,145.84 for KRAS-Bmab, $6,201.57 for RAS-Bmab and $6,960.70 for KRAS-Cmab respectively. Undoubtedly, the KRAS-Cmab strategy was dominated by the other 3 groups. Besides, with the respect to WTP, as the value varied from $0 to $ 100,000, the acceptable proportion of RAS-Cmab group increased, while RAS-Bmab group decreased. Overall, among all the analyzed factors, the first-treatment cost of RAS-Cmab was the most influential one to the model. RAS-Bmab seemed as the most cost-effective strategy, but the gained QALM was the shortest.
Similarly, Behl AS et al. found that though anti-EGFR therapy was more cost-effectiveness before the screening for KRAS and BFAF mutation, it was beyond the WTP.Citation22 Admittedly, the value of cost/effectiveness of each group analyzed in our model was above the generally accepted threshold. But compared with other 3 groups, the RAS-Cmab group enjoyed a gained QALM of 21.85. In the sensitivity analysis, changes in costs for chemotherapy of RAS-Cmab group in PFS state (first_treat_2_) had greatest impact on the results of the analysis.
Additionally, an economic analysis of chemotherapy either with Cmab or Bmab based on CALGB/SWOG 80405 in 2015 ASCO Annual meeting.Citation24 And the results suggested that Bmab was preferable to Cmab for first-line treatment of KRAS wild type mCRC patients from a health economic standpoint, which was, to some extent, consistent with our results that RAS-Bmab seemed as the most cost-effective strategy with the shortest QALMs. However, we still can come to the conclusion safely that the RAS screening prior to Cmab treatment in mCRC seems to be a cost-effective strategy in the time of mAbs therapy based on 2 reasons. On the one hand, result of FIRE-3 seems to be more reliable than CALGB/SWOG 80405 because the OS differences of either KRAS wild or RAS wild type were significant in FIRE-3 with 68.5% RAS-assessable patient, while OS comparison of neither KRAS wild nor RAS wild type did not reach the difference in CALGB/SWOG 80405 with only 59% RAS-testing patients. On the other hand, the total cost and effectiveness may be affected by the second-line therapy. In addition to the first-line cost of Cmab and Bmab, which were very close to the fees reported in CALGB/SWOG 80405 in 2015 ASCO Annual meeting, we analyzed the second-line therapy based on the detail of FIRE-3 (, ).
However, our research may also carry potential drawbacks. First, the analysis was based on the information of FIRE-3, which was not a patient-level data. Nevertheless, our study embraces the latest CRC treatment findings, and paves the road for further research in RAS testing application. Second, 4 groups shared the same utilities in the states of PFS and PD, which may influence the calculation of QALMs. Thus, with the examination of utility weights with both KRAS and RAS wild-type biomarkers from the PRIME trial, little difference was found among the groups. Anyway, data of EQ-5D should be collected to keep the accuracy. Third, the second-line treatments and AE ratios of patients in RAS wild-type groups were calculated according to the same from the KRAS wild-type groups of Cmab and Bmab, which may differ from the actual data because of the limited information published from FIRE-3. Thus studies of randomized trials based on RAS should be analyzed to further confirm the accuracy.
In the final of the analysis, the current study was the first to evaluate the costs and effectiveness of RAS screening before mAbs therapy in mCRC based on the latest results of FIRE-3. Compared with the other 3 groups, RAS screening prior to Cmab treatment in mCRC seems to be a cost-effective strategy in the time of mAbs therapy with a most gained QALMs, which is worthy of consideration for decision makers to take a more comprehensive view of mAbs application in the treatment of mCRC.
Materials and Methods
Patients
The model population analyzed in the current study was based on the FIRE-3 trial, which was a randomized, open-label, phase 3 trial that compared the FOLFIRI plus Cmab with FOLFIRI plus Bmab as first-line treatment for mCRC. Briefly, 592 qualified patients with KRAS exon 2 wild-type stage IV tumors, and histologically confirmed CRC were included in the research; the eligible age ranged from 18 to 75, and an Eastern Cooperative Oncology Group (ECOG) performance status of 0–2. Additionally, second-line treatments were given to 204 (78%) of 260 living patients in the Cmab group and 191 (76%) of 250 living patients in the Bmab group.
The treatments
Two hundred 9seven patients in Cmab group were administrated Cmab (initial dose 400 mg per m2 of body surface area(BAS), then 250 mg per m2 weekly) combined with FOLFIRI (comprising irinotecan, racemic folinic acid and fluorouracil), while 295 patients in Bmab group were administrated Bmab (5 mg per kg of bodyweigh) combined with FOLFIRI. The treatments repeated every 14 d And the efficacy was assessed by CT after 6 and 12 weeks of treatment and then every 10 weeks until the final assessment before the end of treatment. Thereafter, all of the assessments were performed every 3 months in the follow-up period until death of the patient.
Clinical outcomes
The objective response (OR) was 62.0% (95% CI 56.2–67.5) in the Cmab group compared with 58.0% (52.1–63.7) in the Bmab group (p = 0·18). The progression-free survival (PFS) was 10.0 months (95% CI 8.8–10.8) in Cmab group and 10.3 months (9.8–11.3) in the Bmab group (p = 0·55); however, OS was 28.7 months (95% CI 24.0–36.6) in Cmab group compared with 25.0 months (22.7–27.6) in the Bmab group (HR 0.77, 95% CI 0.62–0.96; p = 0.017). Haematotoxicity (25% in the Cmab group vs 21% in Bmab group), skin reactions (26% vs 2%), and diarrhea (11% vs 14%) were the most common grade 3/4 adverse events in both groups.
Overall concept of the Markov model
A Markov decision model was built using Treeage software (Treeage, Williamstown, MA, USA) to evaluate the economic consequences and therapeutic efficacy associated with each testing items and treatment strategy. The time horizon was 10 years, which was nearly life long and the transition cycle length was one month. The costs were calculated from a Chinese payer perspective, and survival was reported in quality-adjusted life-months (QALMs), both of which were involved in the calculation of incremental cost-effectiveness ratios (ICERs) defining as cost per unit of survival, calculated as the difference in costs divided by the difference in effectiveness between a given strategy and the next most cost-effective alternative.
The strategies
According to the profile of FIRE-3, 4 groups were analyzed: group 1, patients with KRAS testing treated with Cmab and FOLFIRI (KRAS-Cmab); group 2, patients with RAS testing treated with Cmab and FOLFIRI (RAS-Cmab); group 3, patients with KRAS testing treated with bevacizumab (Bmab), and FOLFIRI (KRAS-Bmab); group 4, patients with RAS testing treated with Bmab and FOLFIRI (RAS-Bmab).
Markov model structure
In general, 3 health states were analyzed: PFS, progressive disease (PD) and death. Patient was assumed to enter the model at the PFS state, who received either RAS screening or KRAS screening before the treatment combinations as the first-line regimens until the progressions of disease, intolerable toxicities and death. In the PD state, a portion of the patients received second-line treatments. The proportion of the patients receiving second-line and the exact regimes were calculated according to the subsequent report of FIRE-3. Basically, the transition probabilities of health states were estimated based on an equation used previously: P (1 month) = [1-(0.5) ˆ (1/median time to event), which was derived from the equations below: P = 1-e−R and R = - ln[0.5]/(time to event/number of treatment cycles).Citation25,26
The utilities
We calculated the effectiveness data in each group based on the health-related quality of life. Preference-based health states utility scores were derived from previously published studies and the values were set at 0.8 for PFS state, 0.6 for PD state and 0 for death respectively [16]. In the mode, because the patients' PS and the treatments in 4 groups differed little, same utilities values were shared among the groups.
Measurement of costs
Costs were calculated from the perspective of health care system in China. Costs for the first-line therapies as well as second-line treatments were included in the analysis. Accordingly, direct costs and indirect costs were taken into account. Direct costs were associated with costs of drugs, hospitalization and necessary tests for efficacy evaluation during the treatments. Indirect cost included 3/4 adverse events (AEs) related costs. Detailed data on the grade 3/4 adverse events were derived from the records of FIRE3. All costs were expressed in dollars(USD) and an exchange rate of $1 = ¥6.15was applied in our study(November 20th, 2014).
Cost-effectiveness analysis
Based on the data we collected above, a cohort of 100 000 patients was simulated randomly, using the Monte Carlo simulation to imitate the process of mCRC and the model was run until all patients died. Costs and effectiveness were discounted at 3% per year.
Sensitivity analysis
One-way sensitivity analysis was performed to examine the impact of essential factors on our model. And the ranges of the factors analyzed were calculated by increasing or decreasing them by 20%.Citation27 The results of the sensitivity analysis were shown in a tornado diagram. According to World Health Organization (WHO) guidelines for cost-effective analysis, the willingness to pay (WTP) was set to $17,815.40 per QALY, which was 3× per capita GDP of China.Citation28,29
Probabilistic sensitivity analysis
Probabilistic sensitivity
Second-order Monte Carlo simulation was used to estimate different optimal strategies varied with different willingness to pay thresholds.
Disclosure of Potential Conflicts of Interest
No potential conflicts of interest were disclosed.
Funding
The authors declare no funding.
References
- Siegel R, Ma J, Zou Z, Jemal A. Cancer statistics, 2014. CA Cancer J Clin 2014; 64:9-29; PMID:24399786; http://dx.doi.org/10.3322/caac.21208
- Chen WQ, Zeng HM, Zheng RS, Zhang SW, He J. Cancer incidence and mortality in china, 2007. Chin J Cancer Res 2012; 24:1-8; PMID:23359628; http://dx.doi.org/10.1007/s11670-012-0001-6
- Van Cutsem E, Nordlinger B Cervantes A. Advanced colorectal cancer: ESMO Clinical Practice Guidelines for treatment. Ann Oncol 2010; 21 Suppl 5:v93-7; http://dx.doi.org/10.1093/annonc/mdq222
- Kievit J. Follow-up of patients with colorectal cancer: numbers needed to test and treat. Eur J Cancer 2002; 38:986-99; PMID:11978524; http://dx.doi.org/10.1016/S0959-8049(02)00061-8
- Heinemann V, von Weikersthal LF, Decker T, Kiani A, Vehling-Kaiser U, Al-Batran SE, Heintges T, Lerchenmüller C, Kahl C, Seipelt G, et al. FOLFIRI plus cetuximab vs. FOLFIRI plus bevacizumab as first-line treatment for patients with metastatic colorectal cancer (FIRE-3): a randomised, open-label, phase 3 trial. Lancet Oncol 2014; 15:1065-75; PMID:25088940; http://dx.doi.org/10.1016/S1470-2045(14)70330-4
- Ciardiello F LHJ, Köhne CH. Treatment outcome according to tumor RAS mutation status in CRYSTAL study patients with metastatic colorectal cancer (mCRC) randomized to FOLFIRI with/without cetuximab. J Clin Oncol 2014:32:5s, (suppl; abstr 3506) 2014; http://meetinglibrary.asco.org/content/127862-144.
- Bokemeyer C KCH, Ciardiello F. Treatment outcome according to tumor RAS mutation status in OPUS study patients with metastatic colorectal cancer (mCRC) randomized to FOLFOX4 with/without cetuximab. J Clin Oncol 2014;32:5s, (suppl; abstr 3505) 2014; http://meetinglibrary.asco.org/content/127861-144.
- http://www.ema.europa.eu/docs/en_GB/document_library/EPAR_Product_Information/human/000558/WC500029119.pdf. Accessed November, 24, 2014
- https://www.nccn.org/store/login/login.aspx?ReturnURL=http://www.nccn.org/professionals/physician_gls/pdf/colon.pdf. Accessed November, 24, 2014
- Pietrantonio F, Maggi C, Di Bartolomeo M, Facciorusso MG, Perrone F, Testi A, Iacovelli R, Miceli R, Bossi I, Leone G, et al. Gain of ALK gene copy number may predict lack of benefit from anti-EGFR treatment in patients with advanced colorectal cancer and RAS-RAF-PI3KCA wild-type status. PLoS One 2014; 9:e92147; PMID:24691006; http://dx.doi.org/10.1371/journal.pone.0092147
- Lange A, Prenzler A, Frank M, Kirstein M, Vogel A, von der Schulenburg JM. A systematic review of cost-effectiveness of monoclonal antibodies for metastatic colorectal cancer. Eur J Cancer 2014; 50:40-9; PMID:24011538; http://dx.doi.org/10.1016/j.ejca.2013.08.008
- Bennouna J, Sastre J, Arnold D, Osterlund P, Greil R, Van Cutsem E, von Moos R, Viéitez JM, Bouché O, Borg C, et al. Continuation of bevacizumab after first progression in metastatic colorectal cancer (ML18147): a randomised phase 3 trial. Lancet Oncol 2013; 14:29-37; PMID:23168366; http://dx.doi.org/10.1016/S1470-2045(12)70477-1
- Tol J, Punt CJ. Monoclonal antibodies in the treatment of metastatic colorectal cancer: a review. Clin Ther 2010; 32:437-53; PMID:20399983; http://dx.doi.org/10.1016/j.clinthera.2010.03.012
- Schwartzberg LS, Rivera F, Karthaus M, Fasola G, Canon JL, Hecht JR, Yu H, Oliner KS, Go WY. PEAK: a randomized, multicenter phase II study of panitumumab plus modified fluorouracil, leucovorin, and oxaliplatin (mFOLFOX6) or bevacizumab plus mFOLFOX6 in patients with previously untreated, unresectable, wild-type KRAS exon 2 metastatic colorectal cancer. J Clin Oncol 2014; 32:2240-7; PMID:24687833; http://dx.doi.org/10.1200/JCO.2013.53.2473
- Alan P. Venook DN H-JL, Innocenti F, Mahoney MR, Bert H. CALGB/SWOG 80405: Phase III trial of irinotecan/5-FU/leucovorin (FOLFIRI) or oxaliplatin/5-FU/leucovorin (mFOLFOX6) with bevacizumab (BV) or cetuximab (CET) for patients (pts) with KRAS wild-type (wt) untreated metastatic adenocarcinoma of the colon or rectum (MCRC). J Clin Oncol 2014; 32:5s, (suppl; abstr LBA3) 2014; http://dx.doi.org/10.1200/JCO.2013.49.4757
- Stintzing AJ S, Rossius L, Modest DP, Fischer von Weikersthal L, Decker T, Möhler M, Scheithauer W, Kirchner T, Heinemann V. LATE BREAKING ABSTRACT: Analysis of KRAS/NRAS and BRAF mutations in FIRE-3: A randomized phase III study of FOLFIRI plus cetuximab or bevacizumab as first-line treatment for wild-type (WT) KRAS (exon 2) metastatic colorectal cancer (mCRC) patients. European Cancer Congress 2013 2013; Abs:17
- Carsten Bokemeyer CHK, Ciardiello F, Lenz HJ, Heinemann V, Klinkhardt U, Beier F, Duecker K, Tejpar S. Treatment outcome according to tumor RAS mutation status in OPUS study patients with metastatic colorectal cancer (mCRC) randomized to FOLFOX4 with/without cetuximab. ASCO Annual Meeting Abstract 3505 Presented June 2, 2014 2014
- Fortunato Ciardiello HJL, Kohne CH, Heinemann V, Tejpar S, Melezinek I, Beier F, Stroh C, Van Cutsem E. Treatment outcome according to tumor RAS mutation status in CRYSTAL study patients with metastatic colorectal cancer (mCRC) randomized to FOLFIRI with/without cetuximab. ASCO Annual Meeting Abstract 3506 Presented June 2, 2014 2014
- Douillard JY, Rong A, Sidhu R. RAS mutations in colorectal cancer. N Engl J Med 2013; 369:2159-60; PMID:24283232; http://dx.doi.org/10.1056/NEJMoa1305275
- Graham CN, Hechmati G, Hjelmgren J, de Liege F, Lanier J, Knox H, Barber B. Cost-effectiveness analysis of panitumumab plus mFOLFOX6 compared with bevacizumab plus mFOLFOX6 for first-line treatment of patients with wild-type RAS metastatic colorectal cancer. Eur J Cancer 2014; 50:2791-801; PMID:25219451; http://dx.doi.org/10.1016/j.ejca.2014.08.016
- Blank PR, Moch H, Szucs TD, Schwenkglenks M. KRAS and BRAF mutation analysis in metastatic colorectal cancer: a cost-effectiveness analysis from a Swiss perspective. Clin Cancer Res 2011; 17:6338-46; PMID:21807639; http://dx.doi.org/10.1158/1078-0432.CCR-10-2267
- Behl AS, Goddard KA, Flottemesch TJ, Veenstra D, Meenan RT, Lin JS, Maciosek MV. Cost-effectiveness analysis of screening for KRAS and BRAF mutations in metastatic colorectal cancer. J Natl Cancer Inst 2012; 104:1785-95; PMID:23197490; http://dx.doi.org/10.1093/jnci/djs433
- Lawrence D, Maschio M, Leahy KJ, Yunger S, Easaw JC, Weinstein MC. Economic analysis of bevacizumab, cetuximab, and panitumumab with fluoropyrimidine-based chemotherapy in the first-line treatment of KRAS wild-type metastatic colorectal cancer (mCRC). J Med Econ 2013; 16:1387-98; PMID:24102083; http://dx.doi.org/10.3111/13696998.2013.852097
- Deborah Schrag ACD, Naughton MJ, Niedzwiecki D, Earle C, Shaw JD, Grothey A, Hochster HS, Blanke CD, Venook AP. Cost of chemotherapy for metastatic colorectal cancer with either bevacizumab or cetuximab: Economic analysis of CALGB/SWOG 80405. J Clin Oncol 2015; 33(suppl; abstr 6504):2015; PMID:26101248
- Purmonen T, Martikainen JA, Soini EJ, Kataja V, Vuorinen RL, Kellokumpu-Lehtinen PL. Economic evaluation of sunitinib malate in second-line treatment of metastatic renal cell carcinoma in Finland. Clin Ther 2008; 30:382-92; PMID:18343276; http://dx.doi.org/10.1016/j.clinthera.2008.02.013
- Petrou PK, Talias MA. Cost-effectiveness of sorafenib compared to best supportive care in second line renal cell cancer from a payer perspective in Cyprus. Expert Rev Pharmacoecon Outcomes Res 2014; 14:131-8; PMID:24397606; http://dx.doi.org/10.1586/14737167.2014.873703
- Elbasha EH, Messonnier ML. Cost-effectiveness analysis and health care resource allocation: decision rules under variable returns to scale. Health Econ 2004; 13:21-35; PMID:14724891; http://dx.doi.org/10.1002/hec.793
- Murray CJ, Evans DB, Acharya A, Baltussen RM. Development of WHO guidelines on generalized cost-effectiveness analysis. Health Econ 2000; 9:235-51; PMID:10790702; http://dx.doi.org/10.1002/(SICI)1099-1050(200004)9:3%3c235::AID-HEC502%3e3.0.CO;2-O
- Eichler HG, Kong SX, Gerth WC, Mavros P, Jonsson B. Use of cost-effectiveness analysis in health-care resource allocation decision-making: how are cost-effectiveness thresholds expected to emerge? Value Health 2004; 7:518-28; PMID:15367247; http://dx.doi.org/10.1111/j.1524-4733.2004.75003.x