ABSTRACT
Following radiotherapy, bone sarcomas account for a significant percentage of recurring tumors. This risk is further increased in patients with hereditary retinoblastoma that undergo radiotherapy. We analyzed the effect of low and medium dose radiation on mesenchymal stromal cells (MSCs) with inactivated RB1 gene to gain insights on the molecular mechanisms that can induce second malignant neoplasm in cancer survivors.
MSC cultures contain subpopulations of mesenchymal stem cells and committed progenitors that can differentiate into mesodermal derivatives: adipocytes, chondrocytes, and osteocytes. These stem cells and committed osteoblast precursors are the cell of origin in osteosarcoma, and RB1 gene mutations have a strong role in its pathogenesis. Following 40 and 2000 mGy X-ray exposure, MSCs with inactivated RB1 do not proliferate and accumulate high levels of unrepaired DNA as detected by persistence of gamma-H2AX foci. In samples with inactivated RB1 the radiation treatment did not increase apoptosis, necrosis or senescence versus untreated cells. Following radiation, CFU analysis showed a discrete number of cells with clonogenic capacity in cultures with silenced RB1.
We extended our analysis to the other members of retinoblastoma gene family: RB2/P130 and P107. Also in the MSCs with silenced RB2/P130 and P107 we detected the presence of cells with unrepaired DNA following X-ray irradiation. Cells with unrepaired DNA may represent a reservoir of cells that may undergo neoplastic transformation. Our study suggests that, following radiotherapy, cancer patients with mutations of retinoblastoma genes may be under strict controls to evaluate onset of secondary neoplasms following radiotherapy.
Introduction
One major concern associated with radiotherapy is how to avoid or minimize early and late side effects associated with treatment. This can be achieved by steep dose gradients between the target volume and the surrounding normal tissues. Organs and tissues surrounding the target area of a radiotherapy treatment may receive a radiation dose that is lower than the target but is still capable of producing negative outcomes. Scatter exposure to the organs and tissues surrounding tumor can amount to a dose of several gray and contributes to the overall risk of a secondary cancer, such as sarcomas.Citation1-5
Mesenchymal stem cells and osteoblasts are subpopulations of mesenchymal stromal cells (MSCs) that are resident within bone marrow.Citation6 These cells may undergo unwanted radiation exposure during radiotherapy sessions for cancer treatment and this may lead to secondary tumors such as osteosarcomas (OS) that is malignant form of bone cancer.Citation2,4,7-9 For this reason we decided to study the effect of low and medium dose radiation on MSC biology. The choice of low and medium dose treatment aimed to mimic scatter radiation exposure to tissues surrounding target area, which receives instead high dose radiation. We extended our analysis on MSCs with inactivated RB1 gene since 70% of OS cases show RB1 gene mutations.Citation7,10,11 The rationale was that this gene is implied in OS onset but also results in a significant risk of a secondary cancer for patients with hereditary retinoblastoma, which is enhanced by radiotherapy.Citation5
Retinoblastoma gene family has 2 other members (RB2/P130 and P107), besides RB1. To have a complete picture of molecular mechanisms that can induce second malignant OS, we broaden our study and analyzed the effect of radiation on MSC lacking one of these genes. The interest resides on the fact that the role of RB1, RB2/P130 and P107 in cell physiology is complex. They have only partially overlapping tasks and exert specific functions, which depends on several parameters including the animal model, cell type, and cell status (stem cell, progenitor, differentiated cell).Citation12
Results
We silenced RB1, RB2/P130 and P107 genes in MSC by lentiviral transductions of specific shRNAs similar to previous work.Citation12 The shRNAs were effective in silencing and induced a decrease in target mRNAs and proteins (Suppl. File 1). Cell expressing shRNAs against RB1, RB2/P130 and P107 mRNAs were indicated as shR1, shR2 and sh107, respectively. Cells expressing scrambled control shRNAs were indicated as shSCR.
In many biological systems, RB1 inactivation leads to increased cell proliferation and resistance to cell cycle exit.Citation13,14 On the contrary, our previous findings demonstrated that MSC lacking RB1 expression showed a decline in proliferation and accumulation of DNA damage. This impairs stem cell properties with an increase in senescence. In addition, MSCs with a silenced RB2/P130 showed a reduced degree of DNA damage, apoptosis and senescence with increase in the proliferation rate and self-renewal properties.Citation12
In this scenario, we evaluated how radiation exposure could affect the biology of MSCs lacking expression of retinoblastoma gene family members. According to a widely accepted definition, very high doses of radiation are over 15 Gy; high doses range between 5 and 15 Gy; medium doses between 0.5 and 5 Gy; and low doses between 0.05–0.5 Gy.Citation15 Adjuvant therapy is performed by treating patients with very high/high radiation doses, which are divided into multiple smaller doses given over a period of one to 2 months.Citation16 Non-target areas of therapy may receive a lower amount of radiation that is not easily quantified. On this premise, we treated MSCs with 2000 mGy and 40 mGy to model medium and low doses that reach the non-target region.
Silencing of RB1 and P107 delays exit from cell cycle following irradiation
We performed Ki67 immunostaining to detect the percentage of cycling (G1; S; G2/M) and resting cells (G0) that are Ki67 positive and negative, respectively. As expected, control MSCs showed a reduction in cycling cells following treatment with 40 mGy and 2000 mGy both at 6 and 48 hours post-irradiation (). This trend was partially altered in shR1-irradiated cells. Six hours post 2000 mGy radiation, we detected an increase in Ki67 positive cells vs. non-irradiated samples. Nevertheless, 48 hours post-treatment, the percentage of cycling cells in shR1 cells is lower than the matched control. Resistance to cell cycle exit following radiation treatment is also present in shR2 and sh107. We detected a reduction in the cycling cells versus non-irradiated samples with 2000 mGy and 48 hours post-treatment.
Figure 1. Cell cycle analysis. Panel A – The graph shows the percentage of cycling (Ki67+) cells either in basal conditions or 6 and 48 hours post-irradiation.. Panel B -The picture shows a representative FACS analysis of irradiated (40 and 2000 mGy) and untreated MSCs. The assays were carried out 6 and 48 hours post-irradiation. Experiments were conducted in triplicate for each condition. The percentage of different cell populations (G1, S and G2/M) is indicated. Data are expressed with standard deviations. shR1, shR2 and sh107 cells were tested vs. control MSCs (shSCR, #p < 0.05). In each silenced condition (shSCR, shR1, shR2 and sh107), we compared irradiated versus unirradiated cells (*p < 0.05). The shSCR wild type MSCs; shR1, shR2 and sh107 are MSCs with silenced RB1, RB2/P130 and P107, respectively.
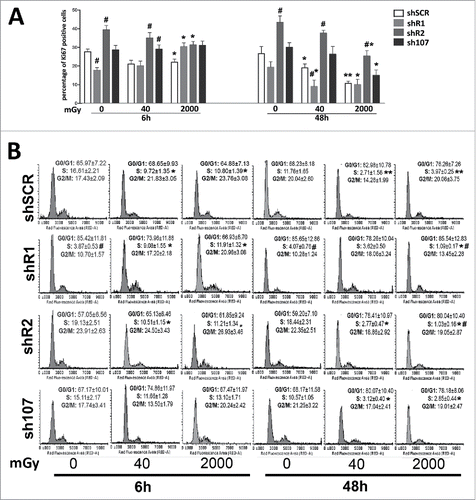
Changes in the number of cycling cells post-irradiation are associated with modifications of cell cycle profiles (). Control MSCs showed a significant reduction in the number of cells in S-phase following treatment with 40 mGy and 2000 mGy both at 6 and 48 hours post-irradiation. On the contrary, shR1 cells showed an increase of S-phase 6 hours post irradiation with a decline at 48 hours. Of note, in samples with silenced RB1, the percentage of cells in S-phase is lower than the unirradiated wild type MSCs. Cells lacking P107 gene expression showed a reduction in S-phase cells only at 48 hours after irradiation. The shR2 samples show a decrease in cells with replicating DNA. This is clear both at 6 and 48 hours post irradiation. These results suggest that RB1 or RB2/P130 or P107 silencing impairs and/or delays the cell cycle exit induced by DNA damage.
Irradiated MSCs show persistent unrepaired DNA foci and a lack of RB1 exacerbated the phenomenon
Following irradiation, we investigated the degree of DNA damage in our cells by looking at gamma-H2AX foci, which are markers of damaged DNA that are undergoing repair. The enduring presence of these foci following damaging events indicates the presence of unrepaired DNA in cells.Citation17 In control MSCs, the X-ray treatment induced a significant increase in the number of cells with several gamma-H2AX foci that persisted even 48 hours post treatment (). DNA damage foci were observed mainly in resting cells (Ki67-) suggesting that cycling cells may have a more effective DNA repair system.
Figure 2. Gamma H2AX staining. Fluorescence photomicrographs show the merging of cells stained with anti-H2AX (green), anti Ki-67 (red) and DAPI (blue). Representative microscopic fields are shown. The graph shows the degree of H2AX phosphorylation. This was evaluated by counting the number of gamma-H2AX immunofluorescent foci per cell. Foci number was determined for 200 cells. Each dot represents an individual cell. Horizontal bars indicate mean value for each category. shR1, shR2 and sh107 cells were tested vs. control MSCs (shSCR, #p < 0.05). In each silenced condition (shSCR, shR1, shR2 and sh107), we compared irradiated versus unirradiated cells (*p < 0.05; **p < 0.01). The shSCR wild type MSCs; shR1, shR2 and sh107 are MSCs with silenced RB1, RB2/P130 and P107, respectively.
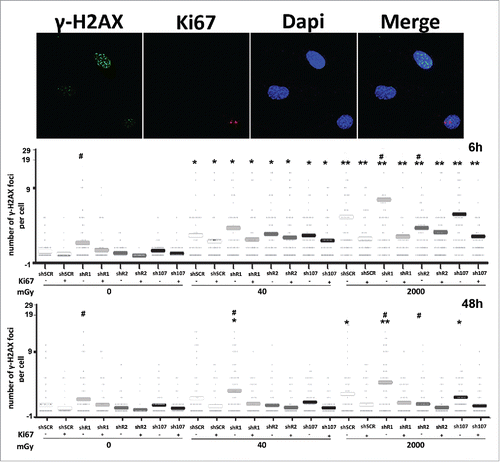
Unirradiated shR1 cells showed a higher level of DNA damage than untreated control, while unirradiated shR2 and sh107 were not statistically different from control samples (). This implies that cells lacking RB1 may be more prone to accumulating DNA damage. This hypothesis was confirmed by the fact that after X-ray treatment, the resting cells (Ki67-) with silenced RB1 showed further increases in H2AX-positive cells vs. controls (shSCR cells). DNA damage persisted unrepaired 48 hours post-irradiation.
DNA damage foci were also detected in irradiated cells with silenced RB2/P130 but their levels revert to values observed in not irradiated controls (shSCR) both in cycling and resting cells. The trend in DNA damage foci observed here for MSCs lacking P107 overlapped that observed in irradiated controls ().
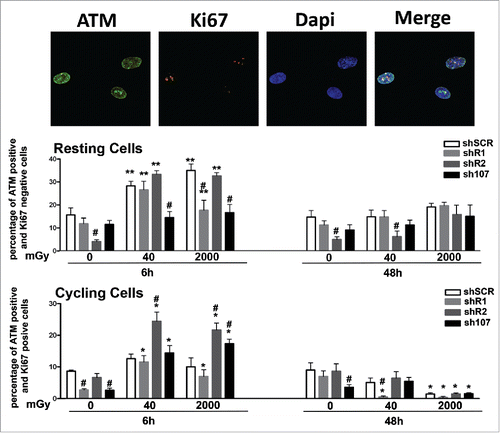
The presence of high levels of unrepaired DNA in shR1 cells prompted us to evaluate if the DNA repair system was impaired in these cells. One of the first events ensuing DNA damage is the induction of ATM autophosphorylation. This kinase triggers a complex cascade of processes leading to DNA repair, which is then dephosporylated and activity of the repair system returns to basal levels.Citation18 Both in resting and cycling shSCR cells, we observed a significant number of ATM-positive cells 6 hours after irradiation. Then, 48 hours post-treatment, the number of ATM-positive cells decreased to levels observed in non-irradiated cultures (). In resting cells with silenced RB1, we detected an ATM increase 6 hours post-irradiation that persisted to at least 48 hours. In cycling shR1 cells, the ATM activation trend was very similar to that observed in shSCR with upregulation of ATM signal at 6 hours and a decline later on (). The ATM activation profiles observed in shR2 and sh107 samples were similar to those observed in the corresponding resting and cycling shSCR cells (). In sum, these results suggest that in spite of DNA repair activation following DNA injury, some damage remains unrepaired. This is particularly clear in MSCs lacking RB1 given the elevated presence of unrepaired DNA in basal conditions and its further increase after genomic damage.
Figure 3. Analysis of DNA damage and repair. Fluorescence photomicrographs shows cells stained with anti-ATM (green) and Ki67 (red). Nuclei were counterstained with DAPI (blue). Representative microscopic fields are shown. For each silenced condition, the upper graph shows mean percentage of ATM(+) Ki67(−) resting cells either in basal conditions or 6 and 48 hours post-irradiation. The lower graph shows mean percentage of ATM(−) Ki67(+) cycling cells. Data are expressed with standard deviation. shR1, shR2 and sh107 cells were tested vs. control MSCs (shSCR, #p < 0.05). In each silenced condition (shSCR, shR1, shR2 and sh107), we compared irradiated versus unirradiated cells (*p < 0.05; **p < 0.01). The shSCR wild type MSCs; shR1, shR2 and sh107 are MSCs with silenced RB1, RB2/P130 and P107, respectively.
Cells with DNA damage can be eliminated either by apoptosis or senescence depending on cell type, intensity, duration and class of genotoxic agent. Six hours post-treatment, we detected an increase in apoptosis in all experimental conditions, but the apoptosis rate dropped below the control level at 48 hours (). This suggests that in MSCs, the apoptosis is an acute reaction to genotoxic stress, while long-lasting effects may be associated with other phenomena. Indeed, irradiation of wild-type MSCs increased the percentage of senescent cells. A similar pattern was observed in cells lacking RB2 or P107. In detail, the cells with silenced RB2 showed a degree of senescence lower than controls in basal conditions following X-ray treatment. Unirradiated shR1 MSC had a significant percentage of senescent cells. Of note, 6 and 48 hours after 40 mGy irradiation, the percentage of senescent cells did not increase, while 48 hours after 2000 mGy X-ray exposure, the level of senescent cells decreased. Irradiated MSC cultures with silenced RB1 showed high levels of DNA damage, but paradoxically they also show only a temporary augmentation of apoptosis and even of necrosis phenomena as detected by annexin V/propidium iodide staining and trypan blue assay (; some data not shown).
Figure 4. Evaluation of senescence and apoptosis. For each silenced condition, the upper graph shows the mean percentage of β-galactosidase positive cells either in basal conditions or 6 and 48 hours post-irradiation. The lower graph shows the mean percentage of Annexin V positive cells. Data are expressed with standard deviation. shR1, shR2 and sh107 cells were tested vs. control MSCs (shSCR, #p < 0.05). In each silenced condition (shSCR, shR1, shR2 and sh107), we compared irradiated versus unirradiated cells (*p < 0.05). The shSCR wild type MSCs; shR1, shR2 and sh107 are MSCs with silenced RB1, RB2/P130 and P107, respectively.
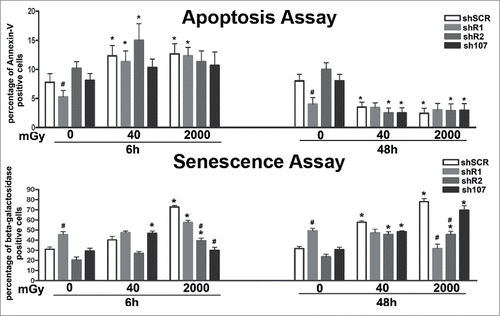
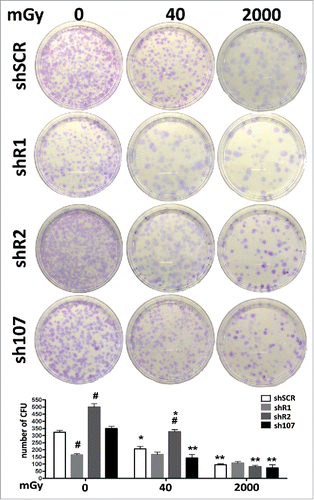
Figure 5. Stemness analysis by CFU assay. For each silenced condition, the pictures show representative crystal violet staining of clones obtained after 14 d of incubation. The graph shows the mean number of clones per 1,000 cells plated in a 100-mm dish. Data are expressed with standard deviations. shR1, shR2 and sh107 cells were tested vs. control MSCs (shSCR, #p < 0.05). In each silenced condition (shSCR, shR1, shR2 and sh107), we compared irradiated versus unirradiated cells (*p < 0.05; **p < 0.01). The shSCR wild type MSCs; shR1, shR2 and sh107 are MSCs with silenced RB1, RB2/P130 and P107, respectively.
What is the fate of MSCs lacking RB1 and with heavy DNA damage?
CFU assays can evaluate clonogenicity—that is, the capacity of a cell culture to expand at a single-cell level. In stem cell biology this assay is used to test self-renewing properties of either normal or transformed stem cells. In control MSCs, the irradiation produced a reduction in the number of clones suggesting that X ray exposure greatly affect the stemness of MSC cultures. Basal condition cells lacking RB2 showed a high number of CFU clones versus controls. This number declined progressively following treatment with 40 mGy and 2000 mGy. This agrees with the very low levels of senescence in unirradiated cultures and its progressive increase following radiation treatment. Cells without P107 followed the pattern of control MSCs. In cells with down-regulated RB1, we observed a significant reduction of clones in basal condition vs. controls. This agrees with the high levels of DNA damage and senescence. Nevertheless, MSCs lacking RB1 showed a peculiarity—following low and medium doses of irradiation they showed no further reduction in CFU clones. This may indicate a lack of RB1, which allowed the selection of clones that are resistant to senescence and/or apoptosis induced by DNA damage.
Do MSCs with silenced RB1 undergo transformation following irradiation?
Transformed cells can grow independently of a solid surface. This feature is a hallmark of carcinogenesis and is evaluated by the soft agar colony formation assay. Cells lacking RB1, RB2/P130 or P107 either in basal conditions or after irradiation did not show anchorage-independent growth (Supplementary file 2).
Discussion
Radiation therapy may induce onset of secondary tumors that can develop years after the end of therapy. In children undergoing radiotherapy, OS is one of most frequent secondary tumors. This tumor arises from mesenchymal stem cells and osteocyte progenitors. It is associated with mutations in the RB1 gene and other genes. For these reasons, we evaluated the effect of low and medium X-ray treatment on MSCs lacking expression of RB1 or of the other 2 components of the retinoblastoma gene family.
Silencing of RB1 in MSCs induced accumulation of DNA damage and reduced the proliferation and onset of senescence. This is in contrast with reports of other cell types including fibroblasts that showed strong resistance to cell cycle exit and uncontrolled proliferation following RB1 ablation.Citation13,14 Nevertheless, there are findings showing that RB1 may be dispensable for cell cycle exit and control of cell growth because it occurs in cardiomyocytes and pancreatic ß-cells.Citation19,20 Altogether these studies clearly show that RB1 function is context dependent, in some settings RB1, RB2/P130, and P107 can compensate for each other. A functional compensation may occur when one protein is capable of a function usually performed by the other but in normal circumstances does not exercise such a function. This seems to occur in MSCs lacking RB1 that express high levels of RB2/P130.Citation12
At first sight this data may suggest that inactivation of RB1 has an ancillary role in inducing transformation of mesenchymal stem cells and/or osteocyte progenitors, while mutations of other tumor suppressor genes and/or oncogenes could play a key role in OS development. Effects of radiations on MSCs with silenced RB1 suggest a different conclusion. Irradiation of cells lacking RB1 expression induced a further increase in DNA damage that may be the result of impaired DNA repair machinery. Moreover, increases in damaged DNA foci may derive from disturbances in the balance between mitogenic signaling, temporally programmed initiation of DNA replication, progression through S-phase, and mitosis that occurs in cells lacking RB1. These events are a major source of DNA damage. They prematurely terminate DNA replication forks and induce DNA double strand breaks.Citation21
Of great interest, in cells with silenced RB1 the increase in DNA damage following irradiation did not induce further senescence or apoptosis versus untreated cells. This suggests that cells with damaged DNA were not properly eliminated. They may represent the “optimal” source for mutations leading to transformation. The fact that soft agar assay did not evidence any malignant transformation of irradiated MSC with silenced RB1 does not rule out our hypothesis. Indeed, onset of OS requires years. This in vitro model may not be suitable. Our hypothesis is strengthened by the fact that irradiation of MSCs lacking RB1 promoted the selection of CFU clones that are resistant to radiation treatment. These clones have self-renewal abilities that are a feature of normal and cancer stem cells. It is reasonable to hypothesize that most of the damaged DNA is clonogenic and is prone to neoplastic transformation. Data on cells lacking RB2/P130 or P107 also shows an increase in DNA damage following irradiation. Nevertheless, this phenomenon is associated with increases in senescence and may be less harmful than when the RB1 gene is silenced.
In conclusion, MSCs lacking RB1 are susceptible to DNA damage after even low doses of radiation. This may result in malignant transformations. This suggests that all patients with retinoblastoma that received adjuvant radiotherapy should be carefully monitored for secondary cancers following treatment.
Materials and methods
Silencing
shRNAs targeting the human RB1, RB2/P130, and P107 mRNA, as well as scrambled control shRNAs, were designed following the procedure described by the RNAi consortium of Broad Institute (Cambridge, MA, USA), we used the following pLKO.1 vectors to express the shRNAs, available at the RNAi consortium: clone TRCN0000010418 to silence RB1 (NCBI Reference Sequence: NM_000321.2); clone TRCN0000039923 to silence RB2/P130 (NCBI Reference Sequence: NM_005611.3); clone TRCN0000040022 to silence P107 (NCBI Reference Sequence: NM_183404.1). To generate knock down cells, lentiviral particles were produced as described (http://www.broadinstitute.org/genome_bio/trc/publicProtocols.html); see also our previous research.Citation12
MSC cultures
Bone marrow was obtained from healthy donors after informed consent. We separated cells on a Ficoll density gradient (GE Healthcare, Italy), and the mononuclear cell fraction was collected and washed in PBS. We seeded 1–2.5 × 10⁵ cells/cm2 in α-MEM containing 10% FBS and bFGF (growth medium). After 72 hours, non-adherent cells were discarded, and adherent cells were further cultivated to confluency. Cells were then further propagated for the assays reported below. All cell culture reagents were obtained from Euroclone Life Sciences (Italy).
Irradiation
Exponentially growing cells were irradiated with 40 and 2000 mGy X-ray at room temperature. X-rays were administered via a Mevatron machine (Siemens Italy) operating at 6 MeV. Following irradiation, cells were further cultivated for 6 and 48 hours.
Cell cycle analysis and cell proliferation assay
For each assay, cells were collected and fixed in 70% ethanol, followed by PBS washes, and finally were dissolved in a hypotonic buffer containing propidium iodide. Samples were acquired on a Guava EasyCyte flow cytometer (Merck Millipore Italy) and analyzed with a standard procedure using EasyCyte software.
Nexin V assay
Apoptotic cells were detected using a fluorescein-conjugated Annexin V kit on a Guava EasyCyte flow cytometer, following the manufacturer's instructions. The kit utilizes 2 separate dyes (Annexin V and 7AAD) to identify a broad spectrum of apoptotic and non-apoptotic cells. Annexin V (red) binds to phosphatidylserine on the external membrane of apoptotic cells, while 7AAD (blue) permeates and stains DNA of late-stage apoptotic and dead cells. Staining allows the identification of 3 cell populations: non-apoptotic cells (Annexin V- and 7AAD-); early apoptotic cells (annexin V+ and 7AAD-); late-apoptotic or dead cells (Annexin V+ and 7AAD+). In our experimental conditions, early and late apoptotic cells were grouped together.
In situ senescence-associated β-galactosidase assay
Cells were fixed using a solution of 2% formaldehyde and 0.2% glutaraldehyde. After this, cells were washed with phosphate-buffered saline and then incubated at 37 1C for at least 2 h with a staining solution (citric acid/phosphate buffer (pH 6), K4Fe(CN)6, K3Fe(CN)6, NaCl, MgCl2, X-Gal). The percentage of senescent cells was calculated by the number of blue, β-galactosidase-positive cells out of at least 500 cells in different microscope fields, as already reported.Citation22
Colony forming unit (CFU) assay
MSC cultures were obtained from bone marrow as described above. Cultures were expanded to 70–80% confluency. On these cells (passage 0), we carried out CFU assay as reported.Citation22 Briefly, we plated 1,000 cells in every 10 cm culture dish and incubated for 14 d in growth medium. Subsequently, medium was discarded and colonies were fixed with 100% methanol for 10 minutes at −20°C. Colonies were then stained 0.01% (w/v) crystal violet in dH2O for 30–60 minutes. For every experimental condition, we counted the number of colonies in culture dishes at light microscope.
Immunocytochemistry for detection of, ATM, gamma-H2AX and Ki67
ATM (mouse monoclonal antibody - ab31842 of Abcam; diluted 1:1000), gamma-H2AX (rabbit polyclonal antibody – 9718 of Cell Signaling Technology; diluted 1:600) and Ki67 (goat polyclonal antibody – sc7844 of Santa Cruz Biotechnology; diluted 1:50) were detected according to manufacturers' protocols. Hoechst 33342 staining was performed, and then cells were observed through a fluorescence microscope (Leica Italia, Italy). The percentage of ATM-, gamma-H2AX- and Ki67-positive cells was calculated by counting at least 500 cells in different microscope fields.
Western blotting
Cells were lysed in a buffer containing 0.1% Triton for 30 minutes at 4°C. 10–40 µg of each lysate was electrophoresed in a polyacrylamide gel, and electroblotted onto a nitrocellulose membrane. All the primary antibodies were used according to the manufacturers' instructions. Immunoreactive signals were detected with a horseradish peroxidase–conjugated secondary antibody (SantaCruz, CA, USA) and reacted with ECL plus reagent (GE Healthcare, Italy).
Statistical analysis
Statistical significance was evaluated using ANOVA analysis followed by Student's t and Bonferroni's tests. We used mixed-model variance analysis for data with continuous outcomes. All data were analyzed with a GraphPad Prism version 5.01 statistical software package (GraphPad, CA, USA).
Disclosure of potential conflicts of interest
No potential conflicts of interest were disclosed.
Authors' contributions
Stefania Capasso, Nicola Alessio, Anna Calarco and Giovanni Di Bernardo carried out collection and assembly of data and contributed to data analysis and interpretation.
Marilena Cipollaro, Fiorina Casale and Salvatore Cappabianca carried out data analysis and interpretation.
Umberto Galderisi and Gianfranco Peluso carried out conception and design, contributed to data analysis and wrote the manuscript.
Supplemental Files
Download Zip (1.7 MB)Acknowledgments
We thank Drs. Vincenzo Condè, Daniela Di Pinto, Martina Di Martino (Servizio di Oncologia Pediatrica, AOU, Seconda Università di Napoli) for bone marrow harvests and technical assistance. We thank Dr. Giovanni Fulgione (Servizio di Radiologia, AOU, Seconda Università di Napoli) for irradiation technical assistance. We thank Mrs. Maria Rosaria Cipollaro (Dept. of Experimental Medicine, Second University of Naples) for technical assistance.
Additional information
Funding
References
- Johansen S, Cozzi L, Olsen DR. A planning comparison of dose patterns in organs at risk and predicted risk for radiation induced malignancy in the contralateral breast following radiation therapy of primary breast using conventional, IMRT and volumetric modulated arc treatment techniques. Acta Oncol 2009; 48:495-503; PMID:19169915 http://dx.doi.org/10.1080/02841860802657227
- Le Vu B, de Vathaire F, Shamsaldin A, Hawkins MM, Grimaud E, Hardiman C, Diallo I, Vassal G, Bessa E, Campbell S, et al. Radiation dose, chemotherapy and risk of osteosarcoma after solid tumours during childhood. Int J Cancer 1998; 77:370-7; PMID:9663598 http://dx.doi.org/10.1002/(SICI)1097-0215(19980729)77:3%3c370::AID-IJC11%3e3.0.CO;2-C
- Rutqvist LE, Rose C, Cavallin-Stahl E. A systematic overview of radiation therapy effects in breast cancer. Acta Oncol 2003; 42:532-45; PMID:14596511 http://dx.doi.org/10.1080/02841860310014444
- Schwartz B, Benadjaoud MA, Clero E, Haddy N, El-Fayech C, Guibout C, Teinturier C, Oberlin O, Veres C, Pacquement H, et al. Risk of second bone sarcoma following childhood cancer: role of radiation therapy treatment. Radiat Environ Biophys 2014; 53:381-90; PMID:24419490
- Wong FL, Boice JD, Jr., Abramson DH, Tarone RE, Kleinerman RA, Stovall M, Goldman MB, Seddon JM, Tarbell N, Fraumeni JF Jr, et al. Cancer incidence after retinoblastoma. Radiation dose and sarcoma risk. Jama 1997; 278:1262-7; PMID:9333268 http://dx.doi.org/10.1001/jama.1997.03550150066037
- Galderisi U, Giordano A. The gap between the physiological and therapeutic roles of mesenchymal stem cells. Med Res Rev 2014; 34:1100-26; PMID:24866817 http://dx.doi.org/10.1002/med.21322
- Guijarro MV, Ghivizzani SC, Gibbs CP. Animal models in osteosarcoma. Front Oncol 2014; 4:189; PMID:25101245 http://dx.doi.org/10.3389/fonc.2014.00189
- Mirabello L, Troisi RJ, Savage SA. International osteosarcoma incidence patterns in children and adolescents, middle ages and elderly persons. Int J Cancer 2009; 125:229-34; PMID:19330840 http://dx.doi.org/10.1002/ijc.24320
- Tang N, Song WX, Luo J, Haydon RC, He TC. Osteosarcoma development and stem cell differentiation. Clin Orthop Relat Res 2008; 466:2114-30; PMID:18563507 http://dx.doi.org/10.1007/s11999-008-0335-z
- Overholtzer M, Rao PH, Favis R, Lu XY, Elowitz MB, Barany F, Ladanyi M, Gorlick R, Levine AJ. The presence of p53 mutations in human osteosarcomas correlates with high levels of genomic instability. Proc Natl Acad Sci U S A 2003; 100:11547-52; PMID:12972634 http://dx.doi.org/10.1073/pnas.1934852100
- Wadayama B, Toguchida J, Shimizu T, Ishizaki K, Sasaki MS, Kotoura Y, Yamamuro T. Mutation spectrum of the retinoblastoma gene in osteosarcomas. Cancer Res 1994; 54:3042-8; PMID:8187094
- Alessio N, Bohn W, Rauchberger V, Rizzolio F, Cipollaro M, Rosemann M, Irmler M, Beckers J, Giordano A, Galderisi U. Silencing of RB1 but not of RB2/P130 induces cellular senescence and impairs the differentiation potential of human mesenchymal stem cells. Cell Mol Life Sci 2013; 70:1637-51; PMID:23370776 http://dx.doi.org/10.1007/s00018-012-1224-x
- Galderisi U, Cipollaro M, Giordano A. The retinoblastoma gene is involved in multiple aspects of stem cell biology. Oncogene 2006; 25:5250-6; PMID:16936744 http://dx.doi.org/10.1038/sj.onc.1209736
- Sage J, Miller AL, Perez-Mancera PA, Wysocki JM, Jacks T. Acute mutation of retinoblastoma gene function is sufficient for cell cycle re-entry. Nature 2003; 424:223-8; PMID:12853964 http://dx.doi.org/10.1038/nature01764
- Kadhim M, Salomaa S, Wright E, Hildebrandt G, Belyakov OV, Prise KM, et al. Non-targeted effects of ionising radiation–implications for low dose risk. Mutat Res 2013; 752:84-98; PMID:23262375 http://dx.doi.org/10.1016/j.mrrev.2012.12.001
- VvAa. Radiotherapy Dose-Fractionation. London: The Royal College of Radiologists, 2006.
- Fu S, Yang Y, Das TK, Yen Y, Zhou BS, Zhou MM, Ohlmeyer M, Ko EC, Cagan R, Rosenstein BS, et al. gamma-H2AX kinetics as a novel approach to high content screening for small molecule radiosensitizers. PloS One 2012; 7:e38465.
- Freeman AK, Monteiro AN. Phosphatases in the cellular response to DNA damage. Cell Commun signal 2010; 8:27; PMID:20860841 http://dx.doi.org/10.1186/1478-811X-8-27
- MacLellan WR, Garcia A, Oh H, Frenkel P, Jordan MC, Roos KP, Schneider MD. Overlapping roles of pocket proteins in the myocardium are unmasked by germ line deletion of p130 plus heart-specific deletion of Rb. Mol Cell Biol 2005; 25:2486-97; PMID:15743840 http://dx.doi.org/10.1128/MCB.25.6.2486-2497.2005
- Vasavada RC, Cozar-Castellano I, Sipula D, Stewart AF. Tissue-specific deletion of the retinoblastoma protein in the pancreatic beta-cell has limited effects on beta-cell replication, mass, and function. Diabetes 2007; 56:57-64; PMID:17192465 http://dx.doi.org/10.2337/db06-0517
- Helmbold H, Galderisi U, Bohn W. The switch from pRb/p105 to Rb2/p130 in DNA damage and cellular senescence. J Cell Physiol 2012; 227:508-13; PMID:21465484 http://dx.doi.org/10.1002/jcp.22786
- Alessio N, Del Gaudio S, Capasso S, Di Bernardo G, Cappabianca S, Cipollaro M, Peluso G, Galderisi U. Low dose radiation induced senescence of human mesenchymal stromal cells and impaired the autophagy process. Oncotarget 2015; 6:8155-66; PMID:25544750 http://dx.doi.org/10.18632/oncotarget.2692
