Abstract
We sought to develop procedures for computerized analysis of long-term, high-resolution activity monitoring data that allow accurate assessment of the time course of activity levels suitable for use in chronic obstructive pulmonary disease (COPD) patients. Twenty-two COPD patients utilizing long-term oxygen recruited from 5 sites of the COPD Clinical Research Network wore a triaxial accelerometer (RT3, Stayhealthy, Monrovia, CA) during waking hours over a 14-day period. Computerized algorithms were composed allowing minute-by-minute activity data to be analyzed to determine, for each minute, whether the monitor was being worn. Temporal alignment allowed determination of average time course of activity level, expressed as average vector magnitude units (VMU, the vectorial sum of activity counts in three orthogonal directions) per minute, for each hour of the day. Mid-day activity was quantified as average VMU/minute between 10AM and 4PM for minutes the monitor was worn. Over the 14 day monitoring period, subjects wore the monitor an average of 11.4 ± 3.0 hours·day− 1. During mid-day hours, subjects wore the monitor 76.3% of the time and generated an average activity level of 112 ± 55 VMU·min−1. Increase in precision of activity estimates with longer monitoring periods was demonstrated. This analysis scheme allows a detailed temporal pattern of activity to be defined from triaxial accelerometer recordings and has the potential to facilitate comparisons among subjects and between subject groups. This trial is registered at ClinicalTrials.gov (NCT00325754).
INTRODUCTION
Physical activity is a key factor in maintaining health. More active chronic obstructive pulmonary disease (COPD) patients have fewer disease exacerbations requiring hospitalization (Citation[10]) and lower mortality (Citation[35]). Most COPD patients are sedentary, engaging in roughly half as much spontaneous daily activity as healthy age-matched controls (Citation[20], Citation[24]).
Several strategies have been employed to monitor the activity of COPD patients, including direct observation, self-report questionnaires, stable-isotope techniques (doubly-labeled water to measure energy expenditure), and activity monitoring (Citation[19], Citation[29]). Unfortunately, direct observation is impractical over long periods, self-report questionnaires have often yielded inaccurate physical activity assessments (Citation[19]), and the doubly-labeled water method is expensive and has limited temporal resolution (Citation[34]). Among activity monitoring methods, accelerometry has been shown to be more accurate than pedometry in COPD patients (Citation[20], Citation[28]).
Previous studies have used accelerometers to examine activity of COPD patients during everyday activities for periods of 1–3 days (Citation[8], Citation[18], Citation[19], Citation[20], Citation[25], Citation[26], Citation[29]), or 4–5 days (Citation[2], Citation[28]). In most of these studies, tri-axial accelerometers were employed and analysis was limited to vector magnitude units (VMU, the vectorial sum of activity in the three orthogonal directions measured over a one-minute period) summed over a period of a day. These calculations may yield substantially non-representative results if daily duration of monitor use varies between days or among subjects.
A major focus in activity monitoring research is development of a monitor whose measurements directly relate to the metabolic cost of daily activities. In healthy young subjects, the relationships between VMU measurements obtained by triaxial accelerometry and energy expenditure (Citation[14], Citation[22], Citation[23]) and between VMU measurements and treadmill walking speed (Citation[22], Citation[23]) have been determined. VMU cut-points for classifying activity as sedentary, moderate, or vigorous have been proposed. Yet, activity ranges established for young healthy subjects (Citation[10], Citation[30], Citation[31], Citation[33]) may have limited validity in older and less active COPD patients. Recent reports have aimed at developing sensors that better reflect the metabolic cost of activity (Citation[5], Citation[13]); this is an active area of research.
This paper addresses a separate area of activity monitoring development. Our purpose was to develop a novel method for analyzing accelerometer data that yields an accurate picture of daily activity time course. A key step was composing a computerized algorithm that operates on minute-by-minute activity data to determine when the device was worn by the subject. This allowed construction of averaged activity temporal profiles over the course of the day and calculation of the fraction of time spent at a specified activity level. The utility of these methods is illustrated by examining the activity profile of a group of COPD patients.
MATERIALS AND METHODS
Data collection
Subjects were participants in a study of oxygen use and activity in long-term oxygen therapy (LTOT) recipients with COPD. They were recruited from 5 sites of the COPD Clinical Research Network; the institutional review board at each site approved the study and each subject provided written informed consent to participate. Major inclusion criteria were stable COPD, resting arterial oxygen partial pressure (PaO2) ≤ 60 mmHg, use of E-cylinders (relatively large compressed gas cylinders designed to be towed in a wheeled cart, weighing roughly 22 lbs.) as the ambulatory oxygen source and lack of orthopedic activity limitation. Subjects participated in a two-week baseline period and a 6-month intervention period in which effects of lightweight oxygen supplies were studied; only baseline period data are included in this report. Twenty-two subjects (14 male) were randomized; all produced analyzable activity monitor recordings.
Subjects agreed to wear the activity monitor for two weeks except after retiring to bed at night and when bathing or swimming. Although a previous study discerned no difference between right and left hip placement (Citation[22]), subjects were asked to wear the monitor on their non-dominant hip. We also gave instructions designed to identify periods when subjects rode in motor vehicles because motor vehicle vibration can be recorded as activity by the monitor. The activity monitor featured two buttons that insert “flags” into the data set; subjects were instructed to press one button when entering a motor vehicle and the other when exiting. Subjects were also given activity logs to record times when they entered and exited vehicles. Using these records, we planned to exclude periods in which subjects rode in motor vehicles from data analysis. Subjects were not given any instructions as to their daily activity patterns.
Activity monitor characteristics
This study was not designed to validate a specific activity monitor model, but rather to demonstrate analysis strategies valid for a range of monitors. We chose a commonly used activity monitor for this study. The RT3 accelerometer (Stayhealthy, Monrovia, CA) is a small and lightweight (7.1 × 5.6 × 2.8 cm, 65.2 g) triaxial accelerometer worn on the hip (Citation[27]). It incorporates an accurate clock and records activity for 21 consecutive days in one-minute epochs (Citation[29], Citation[32]). A previous study showed a 7-day monitoring period was needed to obtain 90% reliability in monitoring activity in healthy adults (Citation[16]).
Despite these features, there are potential problems in using the RT3 to monitor long-term activity. When the device is not worn, low-level but nonzero VMU counts are regularly observed. When the wearer rides in a motor vehicle, relatively high activity counts are generated due to vehicle motion and vibration (Citation[2]), distinguishing these from physical activity is problematic. The RT3 underestimates activity in older subjects with slower gaits (Citation[15], Citation[27]). Finally, the RT3 has been demonstrated to have modest intra-monitor variability, but higher inter-monitor variability (Citation[21]).
Analysis of ambulatory data
A computer algorithm () was formulated to analyze VMU values for each minute in 14-day activity monitor data sets by asking the following questions:
Is VMU·min− 1 value > 5?
Of the following 20 minutes, do at least two have VMU·min− 1 values > 5?
Of the preceding 20 minutes, do at least two have VMU·min− 1 values > 5?
Figure 1 Decision tree by which the time course of vector magnitude unit (VMU) values is analyzed to determine, for a particular minute, whether the activity monitor is worn or not worn.
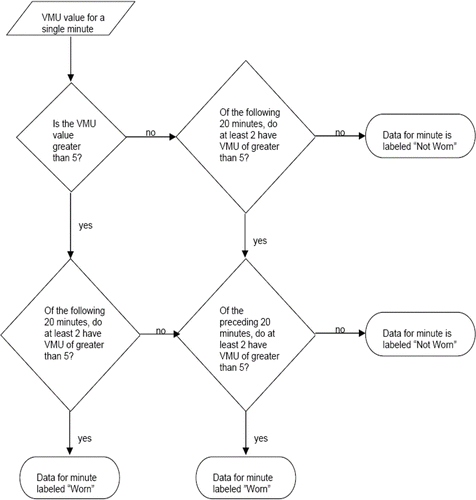
If at least two conditions were affirmed for a given minute, the device was defined to be “worn”; otherwise, the device was defined to be “not worn.” A threshold VMU value of 5 was chosen because it represented the highest value generated by the RT3 when resting on a stationary surface during preliminary device evaluations. A 20-minute window has been used previously (Citation[6]), it seemed an appropriate period in which to expect some minimal activity, such as readjusting body position when sitting in a chair.
Daily activity profile creation
After identification of minutes during which the device was worn, average activity profiles were generated. Minute-by-minute activity values from each hour of the recording period were averaged to yield an hour-by-hour time course. For a given hour of the day, values from successive days were averaged, weighted by number of minutes worn in that hour, to create a single average activity level for that hour. This procedure produced an average time course of activity over the day's 24 hours. Data collected on days monitor wearing was initiated and stopped were not included in the analysis (these days generally featured a laboratory visit and therefore might not be typical); therefore, data analysis started and ended at midnight.
Data analysis procedures
Activity data were downloaded from the RT3 device, using a docking cradle, to a personal computer (Alienware Corporation, Miami, FL). This file was then analyzed by a Microsoft Excel 2000 (Microsoft Inc., Redmond, WA) analysis template to identify when the device was worn or not worn. SigmaPlot 9.0 (Systat Inc., Richmond, CA) analysis transforms performed statistical analysis, including hourly activity averages, daily activity averages, in-vehicle activity identification, and summary graph production. Averages are reported as mean ± SD, unless otherwise stated. For each two-week data set, the analysis procedure took 5–10 minutes.
RESULTS
records demographics of the 22 COPD patients who were found to have severe disease and severe resting hypoxemia. The recording period was 14.2 ± 3.0 days.
Table 1 Characteristics of the Subjects Studied (mean ± SD)
Individual examples of activity monitor data
A major objective of algorithm development was to identify which periods of low activity counts represent sedentary behavior and which are generated when the device is not worn. contains three samples of one-hour periods of monitor recording which illustrate our algorithm's advantages. The left panel illustrates a period of substantial activity; the subject is clearly wearing the monitor. Average activity level is 69 ± 113 VMU·min− 1. During this period, the device records 2 minutes of activity level of 0 VMU·min− 1, and five minutes of < 5 VMU·min− 1.
Figure 2 Selected minute-by-minute vector magnitude unit (VMU) records of activity monitor recording, representing one hour each of high activity (left panel), sedentary activity (center panel), and a non-wearing period during the night (right panel). Note differences in ordinate scales in the three plots. See text for implications of differing analysis strategies for these data.
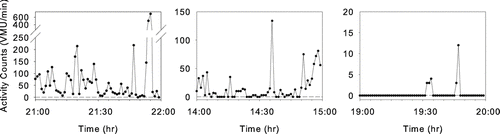
Had we assumed that minutes of 0 VMU signified that the device was not worn, the hour's average VMU would have been 72 ± 114 VMU·min− 1; for a threshold of 5 VMU·min− 1, average VMU would have been 75 ± 116 VMU·min− 1. The middle panel illustrates a very sedentary period during which the device was worn; the algorithm correctly identifies the device as being worn for the entire hour. Average VMU·min− 1 is 16 ± 25 with 19 minutes of 0 VMU·min− 1 and 27 minutes of less than 5 VMU·min− 1. Despite the fact that during almost one-third of this hour the subject had no detectable motion (as might be seen if the subject was lying on a couch), these data represent valid activity assessments, and should be included in the activity analysis. However, if it had been assumed that minutes of 0 VMU signified that the device was not worn, average VMU would have been 23 ± 28 VMU·min− 1; for a threshold of 5 VMU·min− 1, average VMU would have been 30 ± 29 VMU·min− 1. The third panel shows a period when the subject reported that the device was not worn. There are 5 minutes with activity counts ranging from 3-12 VMU·min− 1, which are apparently activity monitor artifacts. The algorithm correctly identifies this entire hour as a period when the monitor is not worn.
Activity level summary
Using the selected algorithm, subjects wore the activity monitor 11.4 ± 3.0 hours?day− 1 (47.5% of the time, range 5.8–19.7 hours·day− 1). For the period during which the monitor was determined to be worn, inter-subject activity average was 90 ± 39 VMU·min− 1 (range 28–167 VMU·min− 1).
Average daily activity time course
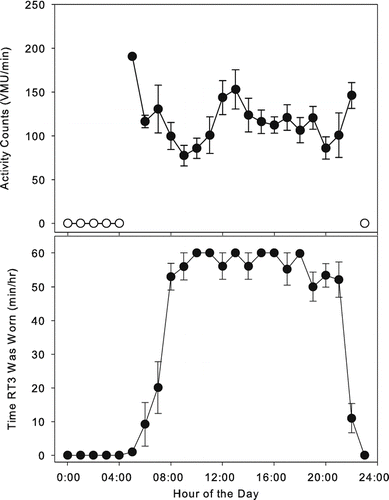
shows average time course of a day's activity for a subject. The upper plot shows average activity profile for each of the day's 24 hours. The bottom plot shows average minutes/hour the device was determined to be worn for each hour. Note that daytime compliance is rather good (55–60 minutes/hour). Also note that this data display demonstrates that the subject regularly started wearing the monitor at roughly 8AM and stopped wearing it between 9PM and 11PM.
Figure 3 Examples of averaged daily activity profiles for a subject. Upper plot: vector magnitude units (VMU) per minute for each hour of the day (±SE), averaged over a 14-day period (open circles denote hours when monitor was never worn). Lower plot: minutes per hour the monitor was worn (±SE) for each hour of the day, averaged over a 14-day period.
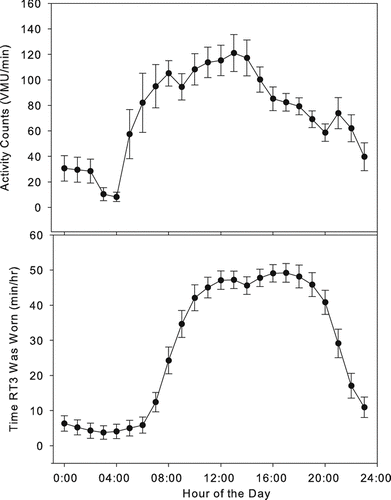
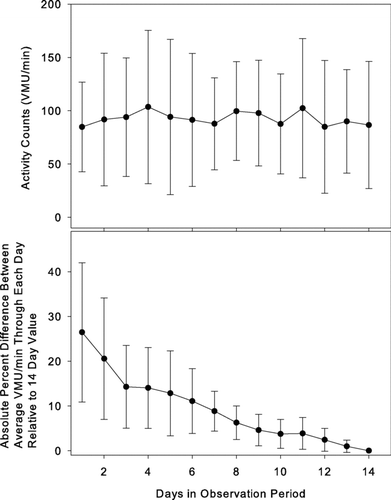
Average daily activity time course for all subjects is shown in . The bottom panel shows, on average, subjects wore the monitor roughly 40–50 minutes/hour (i.e., roughly 67-83% of the time) between 10AM and 8PM. Note that activity level is highest during the late morning and early afternoon hours and declines during the evening.
Figure 4 Average daily activity profiles for all 22 subjects, averaged over the 14-day observation period (mean ± SE). Upper plot: average vector magnitude units (VMU) for each hour of the day. Lower plot: average minutes in which the activity monitor was worn during each hour over the course of the day.
The upper panel of illustrates activity level trends over the 14-day observation period. This plot shows no apparent trends, indicating subjects did not systematically alter activity level over the course of observation. By the reverse arrangements test (Citation[3]), there is no trend in average activity level over time (p < 0.01). The lower panel of allows assessment of the effect of data collection duration on average activity level assessment. The value plotted at day 1 is the average (±SD) of the absolute percent difference between the first day's value and the 14 day average. This data point indicates that a one-day observation period will differ from the 2-week average by an average of 26 ± 16%. The value plotted at day 2 is the average (±SD) of the absolute percent difference between the first two days' average and the 14-day average and so on for subsequent days. It can be seen that not until 7 days' data is averaged, does the average difference from the 14-day value drop below 10%.
Figure 5 Upper plot: Average vector magnitude unit (VMU) per minute daily activity over the 14-day observation period for all 22 subjects for minutes in which the activity monitor was worn. By the reverse arrangements test, there is no significant trend of activity levels over time (p < 0.01). Lower plot: Average of the absolute value of the deviation of the average activity level calculated through each successive day relative to the subject's average activity level over the 14-day observation period. Values are mean ± SD. See text for further discussion. Note that not until 7 days of recording does the average activity level fall within 10% of the 14-day value.
Mid-day analysis
Our analysis strategy facilitates the derivation of a single number that describes the subject's mid-day activity. We calculated average mid-day activity level, defined as the period between 10AM and 4PM, during which we assumed subjects are most likely to be participating in activities of daily living. During this six-hour period, subjects wore the monitor for 4.6 ± 1.1 hours·day− 1 (76.3% of this period), recording an activity level of 112 ± 55 VMU·min− 1 for the time the monitor was worn.
Activity range cut-points
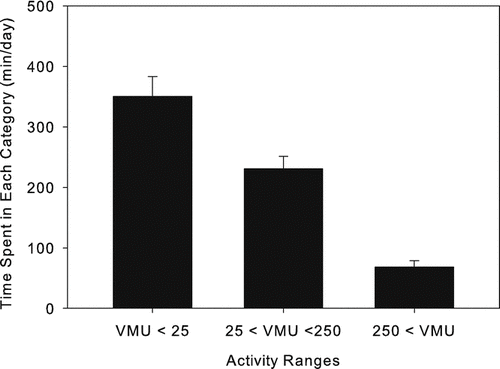
Another method for analyzing activity monitor data is by using cut-points to group activity values into bins of ascending activity levels. This presupposes that a rationale for selecting activity cut-points can be established. Most activity cut-points in the literature use ranges developed for young, healthy subjects and are therefore not fully applicable to COPD patients. We determined that a healthy subject walking at 1 mph on a treadmill engenders an activity count of 290 VMU·min− 1 (data not shown)—roughly 2.6 times higher than the average daytime activity level recorded for these COPD patients. We chose to set cut points at 25 and 250 VMU·min− 1, to create three activity ranges: < 25, 25–250, and > 250 VMU·min− 1. Although these are only rough dividing lines, the first category might correspond to seated (or lying) nearly motionless activity, the second to low level presumably in-doors activity, and the third might encompass walking activity. displays average minutes/day spent in each activity range. Subjects spent 350 ± 147 minutes·day− 1 in activities of < 25 VMU·min− 1, 232 ± 92 minutes·day− 1 at 25-250 VMU·min− 1, and 69 ± 45 minutes·day− 1 at > 250 VMU·minute− 1.
Figure 6 Average (±SD) minutes spent per day over a 14-day observation period in three vector magnitude unit (VMU) activity ranges in 22 COPD patients.
Data generated in a motor vehicle
Subjects were instructed to use monitor buttons to indicate when they were riding in a motor vehicle and to keep a written log of these times. Many subjects essentially ignored these instructions; for all subjects, monitor button analysis detected only 13.4 ± 15.6 minutes·day− 1 recorded as in a motor vehicle. Due to poor subject compliance, overall analysis of the effects of motor vehicle activity was inappropriate; instead, we conducted an illustrative analysis in 4 subjects whose pattern of monitor button and log entries suggested that they were more compliant with our instructions.
Based on electronic flags and log entries for these 4 subjects, time in motor vehicles averaged 51.2 ± 13.3 minutes·day− 1; removing these periods lowered average daily activity level from 84 ± 19 VMU·minute− 1 to 70 ± 15 VMU·min− 1, a 16.2% decrease. These subjects recorded 272 ± 119 VMU·min− 1 while riding in vehicles.
DISCUSSION
We have presented a procedure for analyzing the temporal characteristics of triaxial accelerometer activity monitor data in COPD patients. This method facilitates composition of an accurate time course of a subject's activity patterns by determining when the device was and was not worn. An easily conceptualized presentation of a subject's activity over the course of a day is provided. A summarization of mid-day activity in a single number is enabled. This general approach could be adapted to a wide range of electronic activity monitors.
An active lifestyle has substantial benefits. In the healthy elderly and patients with chronic disease, individuals who remain active generally have better quality of life and survive longer (Citation[1], Citation[9], Citation[35]). Though less well established, the concept that interventions that improve activity levels improve survival is generally accepted (Citation[1]).
In both research and clinical applications, exercise tolerance measures are commonly obtained; such measures have been shown to be predictors of prognosis. However, it may be wondered whether correlations between exercise tolerance and survival seen in COPD patients (Citation[4], Citation[5], Citation[7], Citation[11], Citation[13], Citation[17]) represent cause-and-effect or whether identification of those with higher exercise tolerance simply identifies a subgroup with higher activity level. Indeed, correlational analysis demonstrates that COPD patients with higher exercise tolerance have higher activity levels (Citation[35]), though the correlation is not particularly tight. If we posit that survival is mechanistically linked to everyday activity levels rather than physiological ability to exercise, then exercise capacity can be seen as a mere proxy for activity level. This supposition lends urgency to development of robust and practical methods to assess activity in free-ranging individuals.
Activity monitoring technology has advanced rapidly. Mechanical devices that measure the number of steps taken have been supplanted. Today's devices employ sophisticated sensors, support electronic data analysis, feature electronic memory often capable of recording for weeks at a time and allow downloading to computers for extensive analysis. Accelerometers can be thought of as vibration sensors; accelerometers sensing movement in all three orthogonal directions are commonly employed. Accelerometer readings have been correlated with the associated metabolic cost of the activity (measured in calories), but such correlations are highly dependent on a host of factors, including body weight and activity type.
To easily understand the tenuousness of the correlation between activity counts and metabolic cost, consider that walking at a given speed on a level surface and up a steep grade generates similar accelerometer activity counts, but engenders greatly different metabolic costs. In the present work we rather arbitrarily specified cut points of intensity based on a healthy subject walking on the level. The utility of such cut points are seriously limited. Performing calibrations by having each individual perform a range of intensities of activity would likely lend more validity to intensity cut points but would, however, not fully address the problem. Multisensor activity monitors, incorporating measures such as heart rate, skin temperature and galvanic skin response (Citation[5], Citation[13]) and devices employing more than one accelerometer unit (Citation[20]) have been introduced, aiming to provide a more accurate relation between monitor reading and metabolic activity cost.
The present work addresses another major barrier to interpretation of activity monitor measurements. How can the large-volume, high-resolution data produced by activity monitors be interpreted to give an accurate picture of activity level of a given subject? Previous COPD studies have employed several approaches to analyze uni-axial or tri-axial accelerometer recordings. In two studies, Steele et al. (Citation[28], Citation[29]) recorded activity over 3- and 5-day observation periods. Daily average MU·min− 1 was calculated as total daily VMU divided by patient report of wearing time.
Belza et al. (Citation[2]) recorded 4 days of activity; periods of non-wearing were manually extracted from data files; adjustments related to traveling in a vehicle were made based on patient report. Sandland et al. (Citation[24]) and Sewell et al. (Citation[25]) asked patients to wear a monitor for 12 hours·day− 1 for 7 and 2 days, respectively; average daily counts were computed assuming that patients complied with wearing instructions. Coronado et al. (Citation[8]) asked subjects to wear an accelerometer for two 10-hour periods with total activity assessed by summed counts and employing threshold values. Singh et al. (Citation[26]) asked patients to wear a monitor for 48 hours; activity counts were compared to activity logs kept by the patients. In three studies, Pitta et al. employed a multisensor monitor to analyze patient activity over a 2-day period (Citation[20]), a one-day period (Citation[19]) and 3, 12-hour periods (Citation[18]). Time spent in weight bearing and non-weight bearing activities was estimated.
The methodology we developed provides an efficient construct for interpreting temporal activity characteristics that does not depend on patient report. The central feature is the ability to distinguish periods during which the monitor is worn from those in which it is not. It is unreasonable to assume that subjects will comply precisely with monitor wearing instructions over an extended time period. Results obtained here show that, in fact, compliance is far from perfect and that compliance variation among subjects is appreciable. Moreover, instructions that the device should not be worn during bathing and sleep will yield, even with good compliance, varying periods of daily monitor use when sleep and bathing patterns vary among subjects. The algorithm employed to detect monitor wearing () is essentially empiric, but has the desirable feature of considering activity readings both preceding and following the reading under consideration. Examples are presented () demonstrating that simply considering a threshold value in making this determination leads to misidentifications, especially during periods of relative inactivity.
A second innovation, facilitated by the first, is calculation of the day's activity time course, accompanied by the day's monitor wearing time course. Hour-by-hour data from successive days are superimposed and averaged. This analysis demonstrated that, on average, subjects wore the monitors about 11 hours/day (i.e., about 45% of the time), but wore them during roughly 75% of daytime hours.
A final innovation, facilitated by the first two, enables summarization of daytime activity level in a single number. Focusing on mid-day, when it is presumed that subjects are going about everyday activities (10AM–4PM), average activity level for minutes the monitor is worn over the 14-day period is calculated. By this mid-day activity calculation, concise statements can be made comparing individuals and groups.
How many days of data should be collected to yield an accurate activity pattern picture? The upper panel of might suggest that since, on average, there is no trend for change in activity from the first through the 14th day of monitor wearing, a few days might be adequate. But the lower panel of indicates that, the longer data collection proceeds, the greater the accuracy in discerning the subject's true average value. Specifically, a 7-day observation will, on average, yield an activity assessment within 10% of the 14-day value. Another, somewhat speculative, consideration mitigates against accuracy of a relatively short assessment period. When subjects know that they will be wearing an activity monitor for a short time period, they may initially (deliberately or unconsciously) increase their activity level; the upper panel of suggests that this is not the case for a 14-day wearing period.
We were less successful in facilitating compensation for time spent riding in motor vehicles. Most subjects did not reliably record when they entered and left motor vehicles. By analyzing data of subjects who more reliably performed this task, we determined that activity counts associated with riding in a motor vehicle were in the higher ranges of activities observed. Excluding these periods from activity analysis appreciably decreased estimates of average activity counts. Future research is needed to establish a method to identify and exclude data recorded in a motor vehicle; this method should preferably not rely on subjects remembering to identify these periods.
A limitation of the present work is that we did not demonstrate that the algorithm we developed to analyze activity monitor data performed optimally. This demonstration would require collection of long periods of activity monitoring accompanied by some gold standard method of determining whether the monitor was worn or not worn (perhaps by direct observation). These data could then be analyzed to determine whether the algorithm we developed, or some alternative, optimally separated periods in which the monitor was or was not worn. This validation might be pursued in a future study.
In summary, we developed methodology that facilitated analysis of temporal characteristics of data from long-term activity monitor recordings. Computerized routines were developed that processed the minute-by-minute data stored in these monitors to distinguish periods in which the monitor was or was not worn and then summarized these data in such a way that activity patterns could be readily compared among subjects and between groups. These methods should also be suitable for determining results of activity-promoting interventions. It deserves to be stressed that these analyses are performed under computer control; only a few minutes were needed to analyze each 2-week data recording.
Conflict of Interest
The authors have no conflicts of interest to report. The authors alone are responsible for the content and writing of the paper.
ACKNOWLEDGMENTS
The COPD Clinical Research Network is supported by a Cooperative Agreement from the Division of Lung Diseases of the National Heart, Lung, and Blood Institute. At some sites General Clinical Research Centers (GCRC) were utilized; their M01 grants from the National Center for Research Resources are listed. Members of this Network, with their personnel and grant support are: Brigham and Women's Hospital (Affiliated Site: Fallon Clinic) – J.J. Reilly, Jr, (PI), G. Washko (Co-PI), C. Mayo, S. Peterson (Coordinators). Grant HL074428, GCRC Grant RR02635. Denver Health Medical Center (Affiliated Sites: National Jewish Medical & Research Center, University of Colorado) – R.K. Albert (PI), B. Make (Co-PI), M. Schwarz, C. Welsh (Investigators), M. Gilmartin, C. Verano (Coordinators). Grant HL074409, GCRC Grant RR00051. Los Angeles Biomedical Research Institute at Harbor-UCLA Medical Center – R. Casaburi, (PI), J. Porszasz, (Investigator), R.D. Love (Coordinator). Grant HL074407, GCRC Grant RR00425. Minnesota Veterans Research Institute, Minneapolis (Affiliated Sites: HealthPartners Research Foundation, Mayo Clinic) – D.E. Niewoehner (PI), C. McEvoy, K.R. Rice, P.D. Scanlon (Co-PIs), C.B. Bourassa, P. Neuenfeldt (Coordinators). Grant 1U10-HL074416. Temple University – G.J. Criner (PI), W. Chatila, N. Marchetti, V. Kim, G. D'Alonzo, S. Krachman, F. Cordova, K. Brennan, N. Patel, J. Mamary (Investigators), C. Grabianowski, G. Jones (Coordinators). Grant HL074408. University of Alabama at Birmingham – W.C. Bailey, J.A.D. Cooper (Co-PIs), M.T. Dransfield, L.B. Gerald, P. O'Reilly (Investigators), S. Tidwell (Coordinator). Grant HL074418. University of California, San Francisco – S.C. Lazarus (PI), H.A. Boushey, P.G. Woodruff (Investigators), M. Birch (Coordinator). 1U10-HL074431. University of Maryland, Baltimore – S.M. Scharf (PI), M. Alattar, P. Amelung, M. Cowan, J. Hanson, J. Hasday, A. Iacono, C. Shanholtz, N. Todd, A. Verceles (Investigators), T. Fitzgerald (Coordinator). Grant HL074441, GCRC Grant RR16500. University of Michigan, Ann Arbor – F.J. Martinez (PI), J.L. Curtis, M.K. Han, P.J. Christensen (Investigators), D. White (Coordinator). Grant HL074422. University of Pittsburgh – F. Sciurba (PI), R. Folger, D. Filippino (Coordinators). Grant HL074439, GCRC Grant RR00056. University of Minnesota (Data Coordinating Center) – J.E. Connett (PI), N.R. Anthonisen (Steering Committee Chair), C.Wendt (Co-PI), M. Skeans, W. Patrek, H. Voelker (Coordinators). Grant 1U10-HL074424. Data and Safety Monitoring Board – B.B. Bender, S.F. Kelsey, J.R. Landis, B.Phillips, G.M. Turino, R. Veatch, A. Waldo, A. Wanner. Protocol Review Committee – H.W. Kelly, J. Maurer A.J. McSweeny, R.M. Senior, E.A. Thom, P.D. Wagner, R.L. ZuWallack. NHLBI – G. Weinmann (Director, Airway Biology & Disease Program), T. Croxton, A. Punturieri (Program Officers), M.P. Stylianou (Biostatistician).
REFERENCES
- American College of Sports Medicine Position Stand. The recommended quantity and quality of exercise for developing and maintaining cardiorespiratory and muscular fitness, and flexibility in healthy adults. Med Sci Sports Exerc 1998; 30: 975–991
- Belza B, Steele B G, Hunziker J, Lakshminaryan S, Holt L, Buchner D M. Correlates of physical activity in chronic obstructive pulmonary disease. Nurs Res 2001; 50: 195–202
- Bendat J, Piersol A. Nonparametric trend test. Random Data: Analysis and Measurement Procedures. John Wiley & Sons, Inc., New York 2000; 105–108
- Bowen J B, Votto J J, Thrall R S, Haggerty M C, Stockdale-Woolley R, Bandyopadhyay T, ZuWallack R L. Functional status and survival following pulmonary rehabilitation. Chest 2000; 118: 697–703
- Brage S, Brage N, Franks P W, Ekelund U, Wong M Y, Andersen L B, Froberg K, Wareham N J. Branched equation modeling of simultaneous accelerometry and heart rate monitoring improves estimate of directly measured physical activity energy expenditure. J Appl Physiol 2004; 96: 343–351
- Catellier D J, Hannan P J, Murray D M, Addy C L, Conway T L, Yang S, Rice J C. Imputation of missing data when measuring physical activity by accelerometry. Med Sci Sports Exerc 2005; 37: S555–S562
- Celli B R, Cote C G, Marin J M, Casanova C, Montes de Oca M, Mendez R A, Pinto Plata V, Cabral H J. The body-mass index, airflow obstruction, dyspnea, and exercise capacity index in chronic obstructive pulmonary disease. N Engl J Med 2004; 350: 1005–12
- Coronado M, Janssens J P, de Muralt B, Terrier P, Schutz Y, Fitting J W. Walking activity measured by accelerometry during respiratory rehabilitation. J Cardiopulm Rehabil 2003; 23: 357–364
- Garcia-Aymerich J, Farrero E, Felez M A, Izquierdo J, Marrades R M, Anto J M. Risk factors of readmission to hospital for a COPD exacerbation: a prospective study. Thorax 2003; 58: 100–105
- Garcia-Aymerich J, Felez M A, Escarrabill J, Marrades R M, Morera J, Elosua R, Anto J M. Physical activity and its determinants in severe chronic obstructive pulmonary disease. Med Sci Sports Exerc 2004; 36: 1667–1673
- Gerardi D A, Lovett L, Benoit-Connors M L, Reardon J Z, ZuWallack R L. Variables related to increased mortality following out-patient pulmonary rehabilitation. Eur Respir J 1996; 9: 431–435
- Hankinson J L, Odencrantz J R, Fedan K B. Spirometric reference values from a sample of the general U. S. population. Am J Respir Crit Care Med 1999; 159: 179–187
- Jakicic J M, Marcus M, Gallagher K I, Randall C, Thomas E, Goss F L, Robertson R J. Evaluation of the SenseWear Pro Armband to assess energy expenditure during exercise. Med Sci Sports Exerc 2004; 36: 897–904
- King G A, Torres N, Potter C, Brooks T J, Coleman K J. Comparison of activity monitors to estimate energy cost of treadmill exercise. Med Sci Sports Exerc 2004; 36: 1244–1251
- Le Masurier G C, Tudor-Locke C. Comparison of pedometer and accelerometer accuracy under controlled conditions. Med Sci Sports Exerc 2003; 35: 867–871
- Matthews C E, Ainsworth B E, Thompson R W, Bassett D R, Jr. Sources of variance in daily physical activity levels as measured by an accelerometer. Med Sci Sports Exerc 2002; 34: 1376–1381
- Oga T, Nishimura K, Tsukino M, Sato S, Hajiro T. Analysis of the factors related to mortality in chronic obstructive pulmonary disease: role of exercise capacity and health status. Am J Respir Crit Care Med 2003; 167: 544–549
- Pitta F, Troosters T, Probst V S, Spruit M A, Decramer M, Gosselink R. Physical activity and hospitalization for exacerbation of COPD. Chest 2006; 129: 536–544
- Pitta F, Troosters T, Probst V S, Spruit M A, Decramer M, Gosselink R. Quantifying physical activity in daily life with questionnaires and motion sensors in COPD. Eur Respir J 2006; 27: 1040–1055
- Pitta F, Troosters T, Spruit M A, Probst V S, Decramer M, Gosselink R. Characteristics of physical activities in daily life in chronic obstructive pulmonary disease. Am J Respir Crit Care Med 2005; 171: 972–977
- Powell S M, Jones D I, Rowlands A V. Technical variability of the RT3 accelerometer. Med Sci Sports Exerc 2003; 35: 1773–1778
- Powell S M, Rowlands A V. Intermonitor variability of the RT3 accelerometer during typical physical activities. Med Sci Sports Exerc 2004; 36: 324–330
- Rowlands A V, Thomas P W, Eston R G, Topping R. Validation of the RT3 triaxial accelerometer for the assessment of physical activity. Med Sci Sports Exerc 2004; 36: 518–524
- Sandland C J, Singh S J, Curcio A, Jones P M, Morgan M D. A profile of daily activity in chronic obstructive pulmonary disease. J Cardiopulm Rehabil 2005; 25: 181–183
- Sewell L, Singh S J, Williams J E, Collier R, Morgan M D. Can individualized rehabilitation improve functional independence in elderly patients with COPD?. Chest 2005; 128: 1194–1200
- Singh S, Morgan M D. Activity monitors can detect brisk walking in patients with chronic obstructive pulmonary disease. J Cardiopulm Rehabil 2001; 21: 143–148
- Steele B G, Belza B, Cain K, Warms C, Coppersmith J, Howard J. Bodies in motion: monitoring daily activity and exercise with motion sensors in people with chronic pulmonary disease. J Rehabil Res Dev 2003; 40: 45–58
- Steele B G, Belza B, Hunziker J, Holt L, Legro M, Coppersmith J, Buchner D, Lakshminaryan S. Monitoring daily activity during pulmonary rehabilitation using a triaxial accelerometer. J Cardiopulm Rehabil 2003; 23: 139–142
- Steele B G, Holt L, Belza B, Ferris S, Lakshminaryan S, Buchner D M. Quantitating physical activity in COPD using a triaxial accelerometer. Chest 2000; 117: 1359–1367
- Strauss R S, Rodzilsky D, Burack G, Colin M. Psychosocial correlates of physical activity in healthy children. Arch Pediatr Adolesc Med 2001; 155: 897–902
- Treuth M S, Schmitz K, Catellier D J, McMurray R G, Murray D M, Almeida M J, Going S, Norman J E, Pate R. Defining accelerometer thresholds for activity intensities in adolescent girls. Med Sci Sports Exerc 2004; 36: 1259–1266
- Trost S G, McIver K L, Pate R R. Conducting accelerometer-based activity assessments in field-based research. Med Sci Sports Exerc 2005; 37: S531–543
- Vainionpaa A, Korpelainen R, Kaikkonen H, Knip M, Leppaluoto J, Jamsa T. Effect of impact exercise on physical performance and cardiovascular risk factors. Med Sci Sports Exerc 2007; 39: 756–763
- Ward D S, Evenson K R, Vaughn A, Rodgers A B, Troiano R P. Accelerometer use in physical activity: best practices and research recommendations. Med Sci Sports Exerc 2005; 37: S582–588
- Yohannes A M, Baldwin R C, Connolly M. Mortality predictors in disabling chronic obstructive pulmonary disease in old age. Age Ageing 2002; 31: 137–140