
 ?Mathematical formulae have been encoded as MathML and are displayed in this HTML version using MathJax in order to improve their display. Uncheck the box to turn MathJax off. This feature requires Javascript. Click on a formula to zoom.
Abstract
Interpreting clinical changes during acute exacerbations of chronic obstructive pulmonary disease (AECOPD) is challenging due to the absence of established minimal detectable (MDD) and important (MID) differences for most respiratory measures. This study established MDD and MID for respiratory measures in outpatients with AECOPD following pharmacological treatment. COPD assessment test (CAT), modified Borg scale (MBS), modified British Medical Research Council (mMRC) questionnaire, peripheral oxygen saturation (SpO2), computerised respiratory sounds and forced expiratory volume in one second (FEV1) were collected within 24–48 hour of an AECOPD and after 45 days of pharmacological treatment. MID and MDD were calculated using anchor- (receiver operating characteristic and linear regression analysis) and distribution-based methods (effect size, SEM, 0.5*SD and MDC95) and pooled using Meta XL. Forty-four outpatients with AECOPD (31♂; 68.2 ± 9.1 years; FEV1 51.1 ± 20.3%predicted) participated. Significant correlations with CAT were found for the MBS (r = 0.34), mMRC (r = 0.39) and FEV1 (r = 0.33), resulting in MIDs of 0.8, 0.5–0.6 and 0.03L, respectively. MDD of 0.5–1.4 (MBS), 0.4–1.2 (mMRC), 0.10–0.28L (FEV1), 3.6–10.1% (FEV1%predicted), 0.9–2.4% (SpO2), 0.7–1.9 (number of inspiratory crackles), 1.1–4.5 (number of expiratory crackles), 7.1–25.8% (inspiratory wheeze rate) and 11.8–63.0% (expiratory wheeze rate) were found. Pooled data of MID/MDD showed that improvements of 0.9 for the MBS, 0.6 for the mMRC, 0.15L for the FEV1, 7.6% for the FEV1%predicted, 1.5% for the SpO2, 1.1 for the inspiratory and 2.4 for the number of expiratory number of crackles, 14.1% for the inspiratory and 32.5% for the expiratory wheeze rate are meaningful following an AECOPD managed with pharmacological treatment on an outpatient basis.
Introduction
Acute exacerbations of chronic obstructive pulmonary disease (AECOPD) are frequent events during the course of COPD (Citation1). Recovery from AECOPD can take up to 91 days, and it is known that some patients may never fully recover to their baseline status (Citation2). Additionally, costs associated with the management of AECOPD are estimated in $7.100 per patient, per exacerbation (Citation3). These facts place AECOPD as the main responsible for patients’ clinical deterioration and increased healthcare costs in COPD (Citation4).
The health and economic burden of AECOPD demand timely and appropriate management of these events (Citation5), and a significant amount of research is currently being conducted with this purpose (Citation5,Citation6). Nevertheless, the interpretation of improvements seen during the recovery from AECOPD remains difficult, due to the absence of minimal important differences (MID) for most respiratory measures used in the assessment and monitoring of these patients (Citation7).
MID, defined as a meaningful important change for patients, which would lead to consider a change in the patients’ management (Citation8), is currently the standard to interpret results obtained, guide changes in patient’s treatments and to calculate sample sizes in clinical research. According to the authors’ best knowledge, MIDs for patients with AECOPD have been established mainly in inpatients (Citation9–10) and for patient-reported measures, such as the Clinical COPD Questionnaire (Citation7), the Chronic Respiratory Disease Questionnaire (Citation7) and the COPD Assessment Test (CAT) (Citation10). This limits the management of patients treated on an outpatient basis, which correspond to more than 80% of AECOPD (Citation11), and the interpretation of changes in other important and widely used clinical respiratory measures, such as peripheral oxygen saturation (SpO2), auscultation and lung function (Citation7,Citation12). Additionally, the interpretability of specific measures of dyspnoea, the most representative and valued symptom in patients presenting an AECOPD (Citation2,Citation13), is yet to be established. Incorrect interpretations of patients’ improvements in these outcomes may lead to the development of suboptimal therapies and ultimately increase the rate of patients’ deterioration.
Thus, this study aimed to estimate the MID in outpatients with AECOPD for the following respiratory measures: modified Borg scale (MBS), modified British Medical Research Council (mMRC) questionnaire, SpO2, computerised respiratory sounds, namely crackles and wheezes, and forced expiratory volume in one second (FEV1). Additionally, the minimal detectable difference (MDD), i.e. the minimal change in a specific measure that fall outside the measurement error (Citation14), was also calculated for each outcome measure.
Methods
Study design and participants
An observational study, part of a longitudinal study conducted in outpatients with AECOPD recruited from the urgent care of a Central hospital (Citation52), was conducted. Inclusion criteria were diagnosis of an AECOPD according to the Global Initiative for Chronic Obstructive Lung Disease (GOLD) criteria (Citation11). Exclusion criteria were hospitalisation (defined as the need to be admitted as an inpatient at the respiratory or intensive care unit for further assessment/treatment after consultation with the urgency physician), patients requiring emergency intubation, and/or mechanical ventilation; patients with compromised neurological status or hemodynamic instability or presence of severe co-existing respiratory, neurological (e.g. Parkinson disease), cardiac (e.g. uncontrolled symptomatic heart failure), musculoskeletal (e.g. kyphoscoliosis), or signs of psychiatric impairments. Eligible patients were identified by physicians and contacted by the researchers, who explained the purpose of the study and asked about their willingness to participate. An appointment with the researchers was scheduled within 48 hours of the hospital visit with those interested to participate.
Approval for this study was obtained from the ethics committee of the Centro Hospitalar do Baixo Vouga (13NOV’1514:40065682) and from the National Data Protection Committee (8828/2016). Written informed consent, following the guidelines of the Declaration of Helsinki, was obtained from patients before any data collection.
Data collection
Patients were asked to attend to 4 assessment sessions: within 48 hours of the urgent care visit (T1 – exacerbation onset) and approximately 8 days (T2 – during exacerbation), 15 days (T3 – following exacerbation) (Citation2) and 45 days after the hospital visit (T4 – at stability post exacerbation). Data collection occurred at the urgent care, in the facilities of the Respiratory Research and Rehabilitation Laboratory (Lab3R) of the School of Health Sciences, University of Aveiro (Portugal) or at patients’ home.
According to the time interval used in previous studies to establish MIDs for clinical measures in AECOPD (i.e. 14 days to 3 months) (Citation9,Citation10,Citation16,Citation17), and to ensure patients’ stability after the AECOPD (defined according to patient’s reports of symptoms stability – i.e. no changes beyond their day-to-day variability, no visits to health care units and no changes in their medication in the month preceding the evaluation) (Citation18) only data from T1 and T4 were explored.
Sociodemographic (age, sex), anthropometric (height, weight and body mass index – BMI) and general clinical data (smoking habits, number of exacerbations in the past year, medication and activities-related dyspnoea) were first collected.
In each data collection moment, impact of the disease, dyspnoea at rest and during activities, SpO2, computerised respiratory sounds and lung function were collected by a trained physiotherapist following the described standardised order.
Impact of the disease was measured with the CAT, a disease-specific questionnaire consisting of eight items (i.e. cough, sputum, chest tightness, breathlessness going up hills/stairs, activity limitations at home, confidence leaving home, sleep and energy) scored from 0 to 5 (Citation19). Each item individual score is added to provide a total CAT score that can range from 0 to 40 (Citation19). Higher scores indicate more impact of the disease on patients’ life. CAT was chosen as the anchor to determine the MID of the respiratory measures since it reflects a global rating of impact in health, is responsive to change and has a MID established for patients with AECOPD (Citation10).
Dyspnoea at rest was assessed with the MBS (Citation20), and activity limitation due to dyspnoea was assessed using the mMRC questionnaire (Citation21). The MBS is a categorical scale with a score from 0 to 10, where 0 corresponds to the sensation of normal breathing and 10 corresponds to the patients’ maximum possible sensation of dyspnoea (Citation22). The mMRC questionnaire is a 5-point scale where level 0 represents the lowest level of dyspnoea impairment perceived and level 4 the greatest dyspnoea impairment (Citation22). Both scales have been shown to be valid and reliable in patients with COPD (Citation22,Citation23).
Peripheral oxygen saturation was collected at rest with a pulse oximeter (Pulsox 300i, Konica Minolta, Tokyo, Japan). This measure has been widely used to assess effectiveness of interventions in patients with AECOPD and has shown fair validity against arterial oxygen saturation (bias in the Bland and Altman of −0.78; 95% confidence interval – CI of 8.2–6.7) in this population (Citation7).
Computerised respiratory sounds, specifically the inspiratory and expiratory mean number of crackles and wheeze occupation rate, acquired at the posterior chest, were analysed. Respiratory sounds were acquired with air-coupled electret microphones (C 417PP, AKG Acoustics GmbH, Vienna, Austria) and a multi-channel audio interface (AudioBox 1818 VSL, PreSonus, FL, USA) and were analysed with previous validated algorithms (Citation24–26). Number of crackles and wheeze occupation rate acquired in posterior locations have been shown to be valid against lung function (−0.11<rs< −0.44) (Citation27), reliable (0.25 < ICC1,2<0.86) (Citation27,Citation28) and sensitive to changes in patients with stable and exacerbated COPD (Citation25,Citation52). Further details on respiratory sound acquisition and analysis have been provided elsewhere (Citation15).
Lung function was assessed with a portable spirometer (MicroLab 3535, CareFusion, Kent, UK) (Citation30) according to international guidelines (Citation31). FEV1 in litres and as percentage of predicted (FEV1 percentage predicted) were extracted for each patient. These parameters have been shown to be feasible, valid and reliable (ICC = 0.89) to assess in patients with AECOPD (Citation12).
Statistical analysis
All statistical analyses were performed using IBM SPSS Statistics version 25.0 (IBM Corporation, Armonk, NY, USA) or Meta XL 5.3 (EpiGear International, Queensland, Australia). Plots were created using GraphPad Prism version 5.01 (GraphPad Software, Inc., La Jolla, CA, USA) or Meta XL 5.3. The level of significance was set at 0.05.
Descriptive statistics were used to describe the sample, and participants’ characteristics were expressed as relative frequencies, mean (standard deviation) or median (interquartile range) as appropriate. Outlier’s analysis was performed by plotting the studied variables (i.e. MBS, mMRC, SpO2, computerised respiratory sounds, FEV1 and FEV1 percentage predicted) against the CAT (i.e. the anchor used to compute the MID) on a graph and visually inspecting the graph for wayward (extreme) points (Citation32). The outliers found were removed for both MID and MDD analysis. Significance of changes between T1 and T4 was calculated with paired t-tests or Wilcoxon signed-rank tests depending on normality.
Minimal important difference
MIDs were calculated through questionnaire referencing methods using CAT as an anchor. Then, changes in CAT were correlated with changes in MBS, mMRC, SpO2, inspiratory and expiratory mean number of crackles and wheeze occupation rate, FEV1 and FEV1 percentage predicted, using Pearson correlation coefficient, to determine suitability for its use as an anchor. Significant correlations equal or superior to 0.3 were considered suitable and used in further analysis to establish the MID (Citation33). To discriminate patients who improved from those who did not improve their health status, the established MID in the CAT total score for patients with AECOPD (two points improvement) was used (Citation10,Citation16).
MIDs were calculated using receiver operating characteristic (ROC) curves and linear regression analysis. For each ROC curve, the area under the curve (AUC) and 95% confidence intervals were obtained and the MID for each respiratory measure was chosen as the point where the sensitivity (SN) and specificity (SP) were simultaneously maximised (i.e. the data point closest to the upper left corner of the ROC curve) (). For linear regression analysis, the equations developed which reached statistical significance were used to estimate change in respiratory scores corresponding to the MID improvement for the CAT ().
Table 1. Anchor and distribution-based methods to estimate the minimal important and detectable differences.
Minimal detectable difference
Distribution-based methods used to calculate MDD were (1) effect sizes (Citation34), interpreted as small (dz>0.2), medium (dz>0.5) or large (dz≥0.8) (Citation34); (2) 0.5 times the standard deviation (SD) of the baseline session (Citation33); (3) standard error of measurement (SEM) (Citation33) and (4) minimal detectable change (MDC) at the 95% level of confidence (Citation35) (). The intraclass correlation coefficient (ICC1,2) used for the SEM calculation was established based on the between-days reliability previously published by Sant’Anna et al. (Citation36) for SpO2 (ICC3,1=0.89) and MBS (ICC3,1=0.95), Mahler et al. (Citation37) for mMRC (ICC = 0.82) and FEV1 (ICC = 0.96), and by Oliveira et al. (Citation27) for number of crackles (inspiratory crackles ICC1,2=0.79; expiratory crackles ICC1,2=0.42) and wheeze occupation rate (inspiratory wheezes ICC1,2=0.57; expiratory wheezes ICC1,2=0.07).
The pooling of data was performed based on what has been previously described by Alma et al. (Citation38,Citation39). MIDs and MDD estimated with each of the anchor- and distribution-based methods for the MBS, mMRC, SpO2, inspiratory and expiratory mean number of crackles and wheeze occupation rate, FEV1, and FEV1 percentage predicted were pooled using Meta XL 5.3. The input data were the estimated MID/MDD with each method and respective confidence interval, when appropriated, being the output the same as the input. Given that anchor- are preferred over distribution-based methods for the establishment of clinically significance (Citation33,Citation40), a quality effects model (Citation41) was used to incorporate the weight of each method in the pooled estimate, where anchor methods weighted more than distribution methods (Citation39).
Results
Participants
Seventy-eight non-hospitalised patients with AECOPD were referred for possible inclusion in the study. Of these, 34 were excluded because, at T1, presented lung function tests and clinical history incompatible with a diagnosis of COPD (n = 22), did not meet the definition for AECOPD (n = 1), presented lung neoplasia (n = 2), severe heart failure (n = 1), were unable to comply with testing (n = 3), or decline to participate in the study (n = 5). Forty-four non-hospitalised patients with AECOPD (31 males; 68.2 ± 9.1 years; 51.1 ± 20.3 FEV1 percentage predicted) were invited and agreed to participate in the study. Nineteen patients were excluded from the respiratory sound analysis because the respiratory sound data collection was not completed (n = 6) and their respiratory sounds (collected at the urgent care) had a significant amount of background noise hindering the use of the algorithms described in the Data collection section (n = 13). Participants’ characteristics are summarised in .
Table 2. Sample characterisation.
Minimal important difference
Following the AECOPD, 31 patients improved beyond the MID of the CAT (mean difference of −10.7 ± 5.3), 6 patients did not improve beyond the MID (mean difference of 6.2 ± 3.2) and 7 failed to complete the post-AECOPD assessment. Outlier’s examination leads to the removal of three participants. No differences were found between included participants and outliers for their baseline characteristics (p > 0.05). Distribution of scores in SpO2, MBS, mMRC, respiratory sounds, FEV1 and FEV1 percentage predicted for all participants and according to differences in CAT are presented in .
Table 3. Mean scores at the onset of AECOPD (T1), after 45 days of AECOPD (T4) and mean change for the respiratory measurement by the COPD Assessment Score.
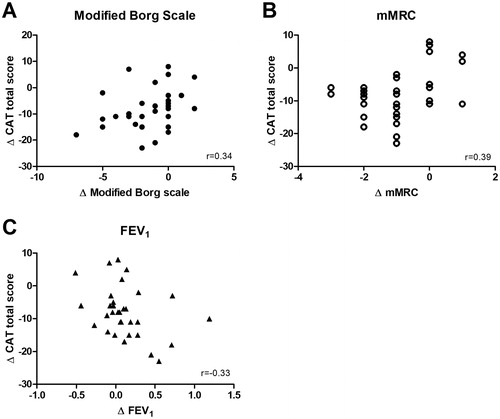
Correlations with changes in CAT equal or superior to 0.3 were found for changes in MBS (rs=0.34; p = 0.05), mMRC (rs=0.39; p = 0.025) and FEV1 (rs= −0.33; p = 0.048) (). No significant correlations were observed with changes in SpO2 (rs= −0.02; p = 0.894), FEV1 percentage predicted (rs= −0.29; p = 0.102), inspiratory (rs= −0.21; p = 0.356) and expiratory (rs= −0.22; p = 0.324) number of crackles, and inspiratory (rs=0.24; p = 0.291) and expiratory (rs=0.36; p = 0.102) wheeze occupation rate. Therefore, MID could only be calculated for MBS, mMRC and FEV1.
Figure 1. Correlations between changes in the CAT and changes in the (A) modified Borg scale, (b) modified British Medical Research Council questionnaire (mMRC) and (C) forced expiratory volume in one second (FEV1).
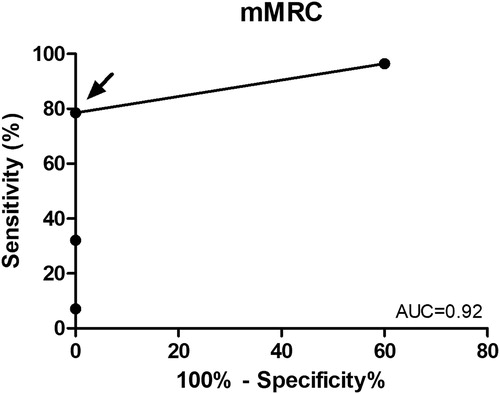
Using ROC statistics, the AUCs generated for the mMRC (AUC = 0.92; 95%CI = 0.82–1.00; p = 0.003) showed adequate discrimination between those improving above and below the MID for CAT (). No significant results were observed for the discrimination ability of the MBS (AUC = 0.63; 95%CI = 0.37–0.89; p = 0.366) and for the FEV1 (AUC = 0.67; 95%CI = 0.43–0.90; p = 0.243). Using ROC, a MID of −0.5 (SN = 79%; SP = 100%) was obtained for mMRC. Since significance was not reached for the MBS and FEV1, MID were not established.
Figure 2. ROCs to discriminate between patients improving above and below the MID in CAT (i.e. two points) for the modified British Medical Research Council questionnaire (mMRC).
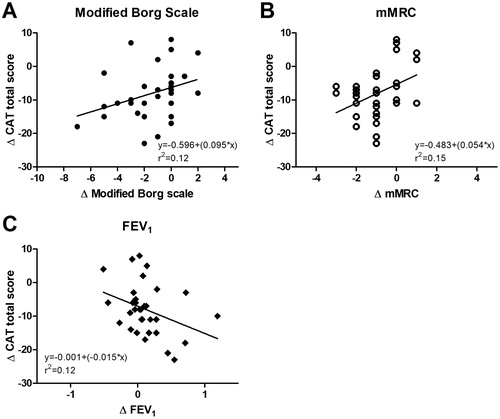
Using linear regression, the estimated minimum important improvement for the MBS, mMRC and FEV1 was –0.8 (95% CI –1.65 to 0.00; p = 0.05), −0.6 (95% CI –1.00 to −0.22; p = 0.025) and 0.03L (95% CI –0.11 to 0.17; p = 0.049), respectively ().
Figure 3. Linear regression between the CAT and the (A) modified Borg scale, (b) modified British Medical Research Council questionnaire (mMRC) and (C) FEV1.
Minimal detectable difference
Small effect sizes were found for the MBS (dz=0.37), FEV1 (dz=0.28), FEV1 percentage predicted (dz=0.34), inspiratory number of crackles (dz=0.48) and expiratory wheeze rate (dz=0.39), medium effect sizes were found for the inspiratory wheeze rate (dz=0.58), expiratory number of crackles (dz=0.65) and SpO2 (dz=0.52) and large effect sizes were found for the mMRC (dz=0.80) (). Values of the 0.5*SD, SEM and MDC95 can be found in the summary of .
Table 4. Anchor-based and distribution-based estimates of the minimal important and detectable differences of the respiratory measures.
Pooled MID and MDD
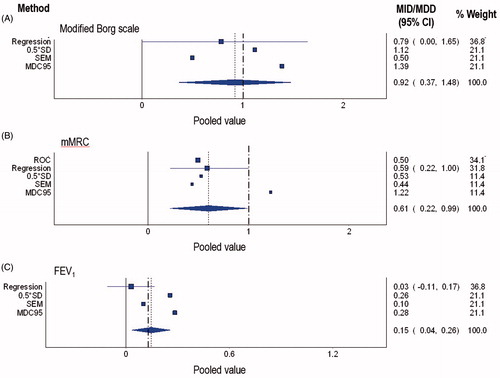
Pooled MID and MDD for the MBS, mMRC, FEV1, FEV1 percentage predicted, SpO2, inspiratory number of crackles, expiratory number of crackles, inspiratory wheeze rate and expiratory wheeze rate were of 0.9, 0.6, 0.15L, 7.6%, 1.5%, 1.1, 2.4, 14.1% and 32.5%, respectively. Individual and pooled values can be found in and plots of pooled MID and MDD for MBS, mMRC, FEV1 can be found in .
Figure 4. Summary plots of the pooled values of the MID and MDD for the (A) modified Borg scale; (B) modified British Medical Research Council (mMRC) questionnaire and (C) forced expiratory volume in one second (FEV1), percentage predicted. The horizontal plots represent the minimal clinically important difference estimates derived in this study, classified per method. Where appropriate the estimates include the 95% confidence interval. The bold dotted vertical line resembles the MID estimate as obtained from the literature for stable patients with COPD.
Discussion
This study showed a pooled MID and MDD of 0.9 for the MBS, 0.6 for the mMRC, 0.15L for the FEV1, 7.6% for the FEV1 percentage predicted, 1.5% for the SpO2, 1.1 inspiratory and 2.4 for the expiratory number of crackles, 14.1% for the inspiratory and 32.5% for the expiratory wheeze occupation rate.
The pooled MID and MDD for dyspnoea scales were similar to those reported in pharmacological trials (approximately 1 point in the MBS) (Citation42,Citation43) and slightly lower than those reported for pulmonary rehabilitation and surgical intervention (approximately two points in the MBS and one point in the mMRC) (Citation22) in stable patients with COPD. Large benefits of these last two interventions are quickly perceived and reported by patients, since they either target specifically dyspnoea (i.e. pulmonary rehabilitation) or are invasive and affect directly the mechanics of breathing (i.e. surgery), contrary to the effects of pharmacological treatments, which mainly target inflammation and/or infection (Citation43). Attention to patients’ baseline dyspnoea and to the ability to change of the outcome measure is also needed when interpreting these data. MBS is not strictly linear, and having a sample with higher scores of dyspnoea (previous studies ranged from 1.8 to 8.5) than those reported in our study, will lead to larger changes, as at the higher end of the scale there are larger numerical intervals between word anchors for symptom severity (Citation43). The mMRC presented large effect sizes following the recovery period of the AECOPD than in previous studies with stable patients, showing to be more sensitive to changes with interventions during AECOPD than in stable stages of the disease (Citation22,Citation42).
Although the values of the MID and MDD are similar between disease stages, which facilitates their used interchangeably during stable and exacerbation periods, health professionals should be aware that the time needed to achieve these MID/MDD was shorter in patients with AECOPD (approximately 45 days), than the three months of treatments commonly used in stable patients (Citation19,Citation22,Citation43).
Therefore, the nature of the interventions, patients’ baseline dyspnoea, the sensitivity to change of the measure used and the time until treatment effects are main aspects to consider when interpreting MID and MDD for dyspnoea scales. These novel results not only attribute meaning to patients’ improvements during AECOPD but will also aid health professionals to establish specific timings to follow-up dyspnoea symptoms in these patients.
Similar to dyspnoea scales, the MID achieved for the FEV1 matched those reported in the literature for stable patients (0.10–0.18 litres) (Citation44). Nevertheless, few studies have determined MID for the FEV1, mainly due to the lack of correlation between lung function and patient-reported outcomes (Citation45,Citation46) and because lung function is commonly not a goal in the management of COPD (Citation11). Conversely, lung function is still the primary endpoint most frequently used by regulatory authorities to interpret drug efficacy in COPD trials (Citation47) and spirometry has been found to be reliable and valid during AECOPD (Citation12). Thus, our findings may be used in future clinical trials to establish therapies effectiveness during AECOPD, further contributing to the current health and research priority of finding the most appropriate management for AECOPD (Citation6).
Due to the lack of correlation with the anchor chosen, only MDD could be established for the FEV1 percentage predicted, SpO2 and respiratory sounds. These outcome measures have been extensively used to assess efficacy of interventions in patients with AECOPD, however little is known about their measurement properties and interpretability (Citation7). There is only one recommendation from the European Respiratory Society to consider an increment of 9% in FEV1 percentage predicted for bronchodilator responsiveness in stable patients, which is identical to our results (Citation48).
A medium effect size was found for SpO2, after the intervention, meaning that SpO2 may be little sensitive to changes in outpatients with AECOPD. Although a MID could not be obtained, according to the oxyhaemoglobin dissociation curve, it would not be expected that a difference of 1.5% would be clinically significant for patients already presenting baseline SpO2 higher than 92%. Nevertheless, such difference might be meaningful in more hypoxemic patients, as it will make a difference in their ability to perform activities of daily living (Citation49). Future studies including patients with different levels of baseline SpO2 are needed to further explore this hypothesis and establish recommendations for clinical practice.
Minimal detectable differences found for computerised respiratory sounds were lower than those previously published in stable patients (i.e. MDD of 2.4 for inspiratory crackles) (Citation27), but significantly higher than the differences found before and after a pulmonary rehabilitation programme in stable patients (i.e. mean difference of 0.8 for expiratory crackles and median difference of less than 10% in inspiratory and expiratory %Wh) (Citation50) and during the course of an AECOPD (mean difference of less than 1 crackle and less than 10% in inspiratory and expiratory number of crackles and %Wh, respectively) (Citation52). These results imply that although statistically significant, the changes being observed in the literature may be within the error of the measure. Nevertheless, these interpretations need caution, as it is known that respiratory sounds present high intersubject variability (Citation28), which have probably influenced the MDD obtained using distribution methods.
Limitations and future work
This study has some limitations that need to be acknowledged. Treatment of exacerbations was not standardised, but optimised according to the physician best judgement, using pharmacology as the standard treatment. Although the effects of therapies were not of interest in this study, it must be acknowledged that different combination of treatments might influence patient’s recovery. Additionally, MID could not be established for FEV1 percentage predicted, SpO2 and computerised respiratory sounds, which may reduce their usefulness to interpret clinical changes. These outcome measures have great potential to be used at bedside of patients with AECOPD, as they are simple non-invasive and widely available. Thus, it is important that future studies build knowledge from our results and find relevant anchors to establish MID for FEV1 percentage predicted, SpO2 and computerised respiratory sounds. Also, patient’s stable state prior to the exacerbation was not assessed, and thus it cannot be firmly stated that all patients have returned to their baseline symptoms as reported by themselves. However, as only outpatients, which present less severe exacerbations (Citation11), were included, and no reports of relapses and changes in treatment occurred, we strongly believe that patients were in a stable state of their disease during the last data collection moment and that the established MID/MDD can be used with confidence. Although the most recommended anchor and distribution methods have been used to establish the MID and MDD, other important anchor methods (Citation38,Citation40), such as patient and health professional referencing, using global rate of change scales and criterion-referencing, through correlation with key health-related events in COPD were not implemented. Thus, further examination of the interpretability of these respiratory measures is recommended, including using additional anchor methods but also establishing MID for different relevant interventions and patients with different levels of severity of their AECOPD. Finally, the sample included in this study is part of a primary research aiming at exploring the time-course of AECOPD in outpatients (Citation51,Citation52), thus a sample size calculation was not computed specifically to address the establishment of MID and MDD. This limitation may have caused our study to be underpowered for this aim. Nevertheless, according to the authors’ best knowledge, this is the first study to contribute to establish MID and MDD of several respiratory outcome measures used in the monitoring of patients with AECOPD, and thus it has potential to be used, not only in clinical practice, to aid clinical interpretations of responses to interventions, but also as a booster for future research in the area, by providing data to compute appropriate sample sizes.
Conclusion
Pooled data of MID and MDD showed that improvements of 0.9 for the MBS, 0.6 for the mMRC, 0.15L for the FEV1, 7.6% for the FEV1 percentage predicted, 1.5% for the SpO2, 1.1 for the inspiratory and 2.4 for the expiratory number of crackles, 14.1% for the inspiratory and 32.5% for the expiratory wheeze occupation rate are meaningful following an AECOPD managed with pharmacological treatment on an outpatient basis. These estimates might be useful in clinical practice to aid clinical interpretations of responses to interventions and to monitor recovery of outpatients with AECOPD.
Declaration of Interest
The authors report no conflicts of interest.
Acknowledgments
The authors would like to acknowledge to Sara Miranda and Hélder Melro for their assistance in data collection and to all patients and physicians from the Centro Hospitalar do Baixo Vouga for their collaboration in this study.
Additional information
Funding
References
- Boer L, Bischoff E, Borgijink X, Vercoulen J, Akkermans R, Kerstjens H, Assendelft W, Schermer T. 'Exacerbation-free time' to assess the impact of exacerbations in patients with chronic obstructive pulmonary disease (COPD): a prospective observational study. NPJ Prim Care Respir Med. 2018;28(1):12.
- Seemungal TA, Donaldson GC, Bhowmik A, Jeffries DJ, Wedzicha JA. Time course and recovery of exacerbations in patients with chronic obstructive pulmonary disease. Am J Respir Crit Care Med. 2000;161(5):1608–1613. doi:10.1164/ajrccm.161.5.9908022.
- Guarascio AJ, Ray SM, Finch CK, Self TH. The clinical and economic burden of chronic obstructive pulmonary disease in the USA. Clinicoecon Outcomes Res. 2013;5:235–245. doi:10.2147/ceor.s34321.
- Anzueto A. Impact of exacerbations on COPD. Eur Respir Rev. 2010;19(116):113–118. doi:10.1183/09059180.00002610.
- Viniol C, Vogelmeier CF. Exacerbations of COPD. Eur Respir Rev. 2018;27(147). doi:10.1183/16000617.0103-2017.
- Wedzicha JAEC-C, Miravitlles M, Hurst JR, Calverley PM, Albert RK, Anzueto A, Criner GJ, Papi A, Rabe KF, Rigau D, et al. Management of COPD exacerbations: a European Respiratory Society/American Thoracic Society guideline. Eur Respir J. 2017;49(3). doi:10.1183/13993003.00791-2016.
- Oliveira AL, Marques AS. Outcome measures used in pulmonary rehabilitation in patients with acute exacerbation of chronic obstructive pulmonary disease: a systematic review. Phys Ther. 2018;98(3):191–204. doi:10.1093/ptj/pzx122.
- Brożek JL, Guyatt GH, Schünemann HJ. How a well-grounded minimal important difference can enhance transparency of labelling claims and improve interpretation of a patient reported outcome measure. Health Qual Life Outcomes. 2006;4:69. doi:10.1186/1477-7525-4-69.
- Tsai C-L, Hodder RV, Page JH, Cydulka RK, Rowe BH, Camargo CA. The short-form chronic respiratory disease questionnaire was a valid, reliable, and responsive quality-of-life instrument in acute exacerbations of chronic obstructive pulmonary disease. J Clin Epidemiol. 2008;61(5):489–497. doi:10.1016/j.jclinepi.2007.07.003.
- Kon SS, Canavan JL, Jones SE, Nolan CM, Clark AL, Dickson MJ, Haselden BM, Polkey MI, Man WD. Minimum clinically important difference for the COPD Assessment Test: a prospective analysis. Lancet Respir Med. 2014;2(3):195–203. doi:10.1016/s2213-2600(14)70001-3.
- The Global Initiative for Chronic Obstructive Lung Disease. Global Strategy for Diagnosis, Management, and Prevention of Chronic Obstructive Pulmonary Disease – 2018 Report. The Global Initiative for Chronic Obstructive Lung Disease, Inc.; 2018.
- Fernández-Villar A, Represas-Represas C, Mouronte-Roibás C, Ramos-Hernández C, Priegue-Carrera A, Fernández-García S, López-Campos JL. Reliability and usefulness of spirometry performed during admission for COPD exacerbation. PloS One. 2018;13(3):e0194983.
- Parker CM, Voduc N, Aaron SD, Webb KA, O'Donnell DE. Physiological changes during symptom recovery from moderate exacerbations of COPD. Eur Respir J. 2005;26(3):420–428. doi:10.1183/09031936.05.00136304.
- de Vet HC, Terwee CB, Ostelo RW, Beckerman H, Knol DL, Bouter LM. Minimal changes in health status questionnaires: distinction between minimally detectable change and minimally important change. Health Qual Life Outcomes. 2006;4:54. doi:10.1186/1477-7525-4-54.
- Oliveira A, Sen I, Kahya YP, Afreixo V, Marques A. Computerised respiratory sounds can differentiate smokers and non-smokers, J Clin Monit Comput. 2017;31(3):571–580.
- Jones PW, Harding G, Wiklund I, Berry P, Tabberer M, Yu R, Leidy NK. Tests of the responsiveness of the COPD assessment test following acute exacerbation and pulmonary rehabilitation. Chest. 2012;142(1):134–140. doi:10.1378/chest.11-0309.
- Kocks JW, Tuinenga MG, Uil SM, van den Berg JW, Stahl E, van der Molen T. Health status measurement in COPD: the minimal clinically important difference of the clinical COPD questionnaire. Respir Res. 2006;7:62. doi:10.1186/1465-9921-7-62.
- Soler-Cataluna JJ, Alcazar-Navarrete B, Miravitlles M. The concept of control of COPD in clinical practice. Int J Chron Obstruct Pulmon Dis. 2014;9:1397–1405. doi:10.2147/copd.S71370.
- Jones PW, Harding G, Berry P, Wiklund I, Chen WH, Kline Leidy N. Development and first validation of the COPD Assessment Test. Eur Respir J. 2009;34(3):648–654. doi:10.1183/09031936.00102509.
- Borg G. Borg’s perceived exertion and pain scales. Champaign, IL: Human Kinetics; 1998.
- Doherty DE, Belfer MH, Brunton SA, Fromer L, Morris CM, Snader TC. Chronic obstructive pulmonary disease: consensus recommendations for early diagnosis and treatment. J Fam Pract. 2006;55(11):S1–S8.
- Crisafulli E, Clini EM. Measures of dyspnea in pulmonary rehabilitation. Multidiscip Respir Med. 2010;5(3):202–210. doi:10.1186/2049-6958-5-3-202.
- Meek PM, Lareau SC. Critical outcomes in pulmonary rehabilitation: assessment and evaluation of dyspnea and fatigue. J Rehabil Res Dev. 2003;40(5 Suppl 2):13–24.
- Taplidou SA, Hadjileontiadis LJ. Wheeze detection based on time-frequency analysis of breath sounds. Comput Biol Med. 2007;37(8):1073–1083.
- Huq S, Moussavi Z. Automatic breath phase detection using only tracheal sounds. Paper presented at: Engineering in Medicine and Biology Society (EMBC), 2010 Annual International Conference of the IEEE; 2010.
- Pinho C, Oliveira A, Jácome C, Rodrigues JM, Marques A. Integrated approach for automatic crackle detection based on fractal dimension and box filtering. IJRQEH. 2016;5(4):34–50.
- Oliveira A, Lage S, Rodrigues J, Marques A. Reliability, validity and minimal detectable change of computerized respiratory sounds in patients with chronic obstructive pulmonary disease. Clin Respir J. 2017. doi:10.1111/crj.12745.
- Jacome C, Marques A. Computerized respiratory sounds are a reliable marker in subjects with COPD. Respir Care. 2015;60(9):1264–1275. doi:10.4187/respcare.03922.
- Jácome C, Oliveira A, Marques A. Computerized respiratory sounds: a comparison between patients with stable and exacerbated COPD. Clin Respir J. 2017;11(5):612–620. doi:doi:10.1111/crj.12392.
- Miller MR, Hankinson J, Brusasco V, Burgos F, Casaburi R, Coates A, Crapo R, Enright P, van der Grinten CP, Gustafsson P, et al. Standardisation of spirometry. Eur Respir J. 2005;26(2):319–338. doi:10.1183/09031936.05.00034805.
- ATS/ERS Statement on respiratory muscle testing. Am J Respir Crit Care Med. 2002;166(4):518–624. doi:10.1164/rccm.166.4.518.
- Aggarwal R, Ranganathan P. Common pitfalls in statistical analysis: the use of correlation techniques. Perspect Clin Res. 2016;7(4):187–190. doi:10.4103/2229-3485.192046.
- Revicki D, Hays RD, Cella D, Sloan J. Recommended methods for determining responsiveness and minimally important differences for patient-reported outcomes. J Clin Epidemiol. 2008;61(2):102–109. doi:10.1016/j.jclinepi.2007.03.012.
- Cohen J. Statistical power analysis for the behavioral sciences. 2nd ed. Hellsdale, NJ: Lawrence Earlbaum Associates; 1988.
- Haley SM, Fragala-Pinkham MA. Interpreting change scores of tests and measures used in physical therapy. Phys Ther. 2006;86(5):735–743. doi:10.1093/ptj/86.5.735.
- Sant'Anna T, Donaria L, Furlanetto KC, Morakami F, Rodrigues A, Grosskreutz T, Hernandes NA, Gosselink R, Pitta F. Development, validity and reliability of the londrina activities of daily living protocol for subjects with COPD. Respir Care. 2017;62(3):288–297. doi:10.4187/respcare.05058.
- Mahler DA, Ward J, Waterman LA, McCusker C, ZuWallack R, Baird JC. Patient-reported dyspnea in COPD reliability and association with stage of disease. Chest. 2009;136(6):1473–1479. doi:10.1378/chest.09-0934.
- Alma H, de Jong C, Jelusic D, Wittmann M, Schuler M, Flokstra-de Blok B, Kocks J, Schultz K, van der Molen T. Health status instruments for patients with COPD in pulmonary rehabilitation: defining a minimal clinically important difference. NPJ Prim Care Respir Med. 2016;26:16041. doi:10.1038/npjpcrm.2016.41.
- Alma H, de Jong C, Tsiligianni I, Sanderman R, Kocks J, van der Molen T. Clinically relevant differences in COPD health status: systematic review and triangulation. Eur Respir J. 2018;52(3). doi:10.1183/13993003.00412-2018.
- Angst F, Aeschlimann A, Angst J. The minimal clinically important difference raised the significance of outcome effects above the statistical level, with methodological implications for future studies. J Clin Epidemiol. 2017;82:128–136. doi:10.1016/j.jclinepi.2016.11.016.
- Doi SA, Thalib L. A quality-effects model for meta-analysis. Epidemiology. 2008;19(1):94–100. doi:10.1097/EDE.0b013e31815c24e7.
- Jones PW, Beeh KM, Chapman KR, Decramer M, Mahler DA, Wedzicha JA. Minimal clinically important differences in pharmacological trials. Am J Respir Crit Care Med. 2014;189(3):250–255. doi:10.1164/rccm.201310-1863PP.
- Ries AL. Minimally clinically important difference for the UCSD Shortness of Breath Questionnaire, Borg Scale, and Visual Analog Scale. COPD. 2005;2(1):105–110.
- Donohue JF. Minimal clinically important differences in COPD lung function. COPD. 2005;2(1):111–124.
- Donohue JF, Jones PW, Bartels C, Marvel J, D'Andrea P, Banerji D, Morris DG, Patalano F, Fogel R. Correlations between FEV1 and patient-reported outcomes: a pooled analysis of 23 clinical trials in patients with chronic obstructive pulmonary disease. Pulm Pharmacol Ther. 2018;49:11–19. doi:10.1016/j.pupt.2017.12.005.
- Jones P, Miravitlles M, van der Molen T, Kulich K. Beyond FEV(1) in COPD: a review of patient-reported outcomes and their measurement. Int J Chron Obstruct Pulmon Dis. 2012;7:697–709. doi:10.2147/COPD.S32675.
- Cazzola M, MacNee W, Martinez FJ, Rabe KF, Franciosi LG, Barnes PJ, Brusasco V, Burge PS, Calverley PM, Celli BR, et al. Outcomes for COPD pharmacological trials: from lung function to biomarkers. Eur Respir J. 2008;31(2):416–469. doi:10.1183/09031936.00099306.
- Quanjer PH, Tammeling GJ, Cotes JE, Pedersen OF, Peslin R, Yernault J-C. Lung volumes and forced ventilatory flows. Eur Respir J. 1993;6(Suppl 16):5–40. doi:10.1183/09041950.005s1693.
- Saglam M, Vardar-Yagli N, Savci S, Inal-Ince D, Calik-Kutukcu E, Arikan H, Coplu L. Functional capacity, physical activity, and quality of life in hypoxemic patients with chronic obstructive pulmonary disease. Int J Chron Obstruct Pulmon Dis. 2015;10:423–428. doi:10.2147/COPD.S78937.
- Jacome C, Marques A. Computerized respiratory sounds: novel outcomes for pulmonary rehabilitation in COPD. Respir Care. 2017;62(2):199–208. doi:10.4187/respcare.04987.
- Oliveira A, Afreixo V, Marques A. Enhancing our understanding of the time course of AECOPD managed on an outpatient basis. Int J Chron Obstruct Pulmon Dis. 2018;13:3759. doi:10.2147/COPD.S175890.
- Oliveira A, Rodrigues J, Marques A. Enhancing our understanding of computerised adventitious respiratory sounds in different COPD phases and healthy people. Respir Med. 2018;138:57–63. doi:10.1016/j.rmed.2018.03.023.