
 ?Mathematical formulae have been encoded as MathML and are displayed in this HTML version using MathJax in order to improve their display. Uncheck the box to turn MathJax off. This feature requires Javascript. Click on a formula to zoom.
Abstract
Gas exchange inefficiency and dynamic hyperinflation contributes to exercise limitation in chronic obstructive pulmonary disease (COPD). It is also characterized by an elevated fraction of physiological dead space (VD/VT). Noninvasive methods for accurate VD/VT assessment during exercise in patients are lacking. The current study sought to compare transcutaneous PCO2 (TcPCO2) with the gold standard—arterial PCO2 (PaCO2)—and other available methods (end tidal CO2 and the Jones equation) for estimating VD/VT during incremental exercise in COPD. Ten COPD patients completed a symptom limited incremental cycle exercise. TcPCO2 was measured by a heated electrode on the ear-lobe. Radial artery blood was collected at rest, during unloaded cycling (UL) and every minute during exercise and recovery. Ventilation and gas exchange were measured breath-by-breath. Bland-Altman analysis examined agreement of PCO2 and VD/VT calculated using PaCO2, TcPCO2, end-tidal PCO2 (PETCO2) and estimated PaCO2 by the Jones equation (PaCO2-Jones). Lin’s Concordance Correlation Coefficient (CCC) was assessed. 114 measurements were obtained from the 10 COPD subjects. The bias between TcPCO2 and PaCO2 was 0.86 mmHg with upper and lower limit of agreement ranging −2.28 mmHg to 3.99 mmHg. Correlation between TcPCO2 and PaCO2 during rest and exercise was r2=0.907 (p < 0.001; CCC = 0.941) and VD/VT using TcPCO2 vs. PaCO2 was r2=0.958 (p < 0.0001; CCC = 0.967). Correlation between PaCO2-Jones and PETCO2 vs. PaCO2 were r2=0.755, 0.755, (p < 0.001; CCC = 0.832, 0.718) and for VD/VT calculation (r2=0.793, 0.610; p < 0.0001; CCC = 0.760, 0.448), respectively. The results support the accuracy of TcPCO2 to reflect PaCO2 and calculate VD/VT during rest and exercise, but not in recovery, in COPD patients, enabling improved accuracy of noninvasive assessment of gas exchange inefficiency during incremental exercise testing.
Introduction
Shortness of breath related to dynamic hyperinflation limits the ability to exercise in many COPD patients [Citation1, Citation2] while leg fatigue provides an additional impediment to exercise in some [Citation3]. Dyspnea in COPD is exacerbated by increased “wasted” ventilation related to high physiological dead space [Citation4]. Bohr [Citation5], and subsequently Enghoff [Citation6], evaluated the physiological dead space proportion (VD/VT) using alveolar (PACO2) and then arterial PCO2 (PaCO2), conceptually calculating the fraction of the exhaled breath that does not participate in CO2 exchange with the blood. Obtaining arterial blood samples, however, adds burden to the patient and the laboratory staff, is generally expensive and usually is not obtained with the necessary data density to assess the time course of the subject’s dead-space ventilation during exercise testing. Jones, et al. [Citation7] introduced an equation to estimate PaCO2 based on the end-tidal PCO2 (PETCO2) and tidal volume (VT). However, as stated in their paper, this estimate is only valid in healthy subjects and differs from the PaCO2 where abnormal ventilation to perfusion ratios (V̇A/Q̇) occur, i.e., in most patients with lung disease [Citation7–9]. Nevertheless, many manufacturers of cardiopulmonary exercise testing equipment utilize this equation (here termed, PaCO2-Jones [Citation7] = 5.5 + 0.9 * PETCO2 − 0.0021* VT) to provide a so-called “noninvasive estimate” of VD/VT in all tested subjects, irrespective of the presence of disease.
A noninvasive method to estimate PaCO2 can be obtained using a heated buffered pH electrode to measure transcutaneous PCO2 (TcPCO2) [Citation10, Citation11]. This system measures PCO2 evaporated from the capillary bed of the heated skin and provides a close correlate of PaCO2. Prior studies to compare TcPCO2 with PaCO2 during exercise in patients have often failed to obtain simultaneous measurements, have required at least one PaCO2 measurement, or have not calculated VD/VT [Citation11–14]. Recently, Fernandes et al. compared TcPCO2 with PaCO2, but the validation was only during rest and was not extended into exercise [Citation15]. The most rigorous prior exercise study in 14 patients (including COPD, ischemic heart disease and hyperventilation syndrome) found narrow limits of agreement between VD/VT calculated from TcPCO2 and PaCO2 (mean bias: 0; CI −0.02 to +0.02), but used an “in vivo calibration” method where the TcPCO2 values were calibrated using a resting PaCO2 measurement prior to the exercise test [Citation16].
The goal of this study was to determine the precision and accuracy of noninvasive TcPCO2 measurement as a surrogate for PaCO2 and calculation of VD/VT changes during an incremental exercise test in COPD patients. We hypothesized that TcPCO2 would be acceptable surrogate for PaCO2, and superior to PaCO2-Jones in calculating VD/VT for COPD patients during incremental exercise. In this way, we sought to establish that arterial blood sampling may not be required in clinical exercise testing to accurately determine VD/VT in diseased lungs. An additional goal of this study was to determine the accuracy and precision of VD/VT estimated using PETCO2 in the same participants.
Materials and methods
The study was approved by the Institutional Review Board of the Lundquist Institute for Biomedical Innovation at Harbor-UCLA Medical Center. The details of all experimental procedures, including risks, were explained in detail to the participants prior to obtaining written informed consent.
Study subjects
Ten patients with COPD were invited to participate in this study. Male or female participants between 40 and 90 years of age, current or ex-smoker, no exacerbations within the past 3 months, able to perform acceptable pulmonary function tests and symptom limited cycle ergometry testing, with a post-bronchodilator FEV1/FVC < 70% qualified for the study (for additional inclusion and exclusion criteria see Supplementary material Appendix).
Study procedures
After a medical history and physical exam was performed, all participants underwent pulmonary function testing [Citation17] including spirometry, lung volumes by body plethysmography and single-breath carbon monoxide diffusing capacity (DLCO) (Vmax Encore 29, Vyaire Medical, Yorba Linda, CA).
During the second visit a catheter was introduced percutaneously into the radial artery. Following catheter placement, a symptom limited ramp-incremental exercise test [Citation18] was performed on an electromagnetically braked cycle ergometer (Excalibur Sport, Lode, Gröningen, The Netherlands). Tests were administered with 3 min of rest and 3 min of unloaded cycling (UL), followed by an increase in power output at 5 W/min or 10 W/min (for patients with FEV1≤ 1 L or > 1 L, respectively). Each test continued until the limit of tolerance (see Supplementary material Appendix).
Data collection
An arterial catheter was introduced into the radial artery and blood samples were obtained while the participant breathed through the mouthpiece at rest, during UL, every minute during exercise and for 5 min into recovery [Citation19, Citation20], samples were collected over ∼5 s. Samples were iced and analyzed within an hour for pH, PaCO2, PaO2 and hemoglobin concentration at 37˚C in a certified clinical arterial blood-gas laboratory (ABL820, Radiometer, Copenhagen, Denmark).
Subjects breathed through a mouthpiece with a nose clip in place. Ventilation and gas exchange were obtained breath-by-breath (Vmax Encore 29, Vyaire Medical, Yorba Linda, CA), and the data were subsequently exported in 10-second average bins. The TcPCO2 was recorded using a noninvasive heated probe (44˚C) attached to the earlobe using double-sided tape and a spring clip. Breath-by-breath values of TcPCO2 were sampled by the metabolic cart using analog-to-digital conversion and collected together with gas exchange data by the Vmax system. After TcPCO2 probe placement, at least 5 min was allowed for equilibration prior to data collection (for details see Supplementary material Appendix).
VD/VT was calculated using the mass balance equation as follows [Citation21],
where V˙E/V˙CO2 (ventilatory equivalent for CO2, minute ventilation V˙E (BTPS), CO2 output V˙CO2 (STPD)) was calculated from 10-second bin values matching the blood gas collection. The dead space of the mouthpiece and saliva trap together was 110 ml and this value was used to correct VD/VT values for the system dead space (VDs). The constant 863 provides the necessary conversions between BTPS and STPD and fractional CO2 concentration to partial pressure. VD/VT was calculated by substituting the PaCO2 in the equation with each of four alternative values: 1) PaCO2 from the arterial blood gas (ABG); 2) TcPCO2; 3) PaCO2-Jones; and 4) PETCO2.
Statistical analysis
Based on an anticipated standard deviation of ±5 mmHg, we estimated that 73 samples would be necessary to detect at least 2 mmHg difference between methods at an α level of 0.05 and power (1-β) of 0.95 (Medcalc Statistical Software version 19.1.3, Ostend, Belgium; https://www.medcalc.org; 2019). We therefore aimed to collect at least 8 samples from each participant during rest and exercise. The actual sample count was 114 (∼11/subject), resulting an attained power (1-β) of > 0.99 with an effect size of 0.92 (Cohen’s dz).
The Shapiro-Wilk test was used to test for normality. Linear regression was used for calculating Pearson`s correlation coefficients (r2), Bland-Altman analysis was used to describe the agreement between methods using the four expressions of PCO2 and VD/VT measurements [Citation22]. The reliability among the four expressions of PCO2 and VD/VT was assessed using Lin’s Concordance Correlation Coefficient (CCC) [Citation23]. The agreement was categorized as poor < 0.9, moderate 0.90 ∼ 0.95, substantial 0.95 ∼ 0.99 and perfect >0.99 [Citation24]. p < 0.05 was considered statistically significant. The statistical analyses were performed with SPSS version 25.0 (SPSS, Chicago, III., USA), SigmaPlot Ver.13 (Jandel Scientific, San Jose, CA) and the CCC for Repeated Measures package [Citation25] of R Ver.3.5.2 (Vienna, Austria).
Results
Subject characteristics
Demographic and physiological characteristics of the study population are presented in . Resting pulmonary function shows that the population had moderate to severe expiratory flow limitation, mild hyperinflation and moderately reduced DLCO. The PaCO2 values in the 114 rest and exercise arterial blood samples ranged from 26.7 mmHg to 51.0 mmHg. None of the participants reported immediate or remote complications of the catheterization procedures, and there were no other adverse events during the study.
Table 1. Demographics and resting pulmonary function of study population.
Response of a representative subject
Data from a representative COPD patient’s response to incremental exercise featuring the time course of the four measures of PCO2 and the four calculations of VD/VT is shown in . During rest, UL and exercise, there was a remarkable agreement between PaCO2 and TcPCO2, and between VD/VTABG (VD/VT calculated using PaCO2) and VD/VTTc (VD/VT calculated using TcPCO2). During recovery, PaCO2 fell rapidly, while TcPCO2 remained elevated for several minutes (for more details see in the Supplementary material Appendix).
Figure 1. V˙̇E/V˙CO2, PCO2, VD/VT during a ramp incremental exercise test using 4 different methods of PCO2 assessment in a representative COPD patient. Ventilatory equivalents (left panel), PCO2 (middle panel) and VD/VT (right panel). The four different expressions of PCO2 and VD/VT are shown. Closed circles: PaCO2, arterial partial pressure of carbon dioxide from blood gas; VD/VTABG, VD/VT calculated using PaCO2. Open circles: V˙E/V˙O2, ventilatory equivalent for oxygen; TcPCO2, transcutaneous partial pressure of carbon dioxide; VD/VTTc, VD/VT calculated using TcPCO2. Closed triangles: V˙E/V˙CO2, ventilatory equivalent for carbon dioxide; PaCO2-Jones, estimated partial pressure of carbon dioxide using the Jones equation [Citation7]; VD/VT-Jones, VD/VT calculated usingPaCO2-Jones. Open triangles: PETCO2, end-tidal partial pressure of carbon dioxide; VD/VTETCO2, VD/VT calculated using PETCO2. The representative subject with FEV1=40%predicted and FEV1/FVC = 33% (GOLD 3 COPD). Vertical lines showed the change in exercise phase (from left to right): start of unloaded cycling; start of incremental exercise; lactate threshold and start of recovery.
![Figure 1. V˙̇E/V˙CO2, PCO2, VD/VT during a ramp incremental exercise test using 4 different methods of PCO2 assessment in a representative COPD patient. Ventilatory equivalents (left panel), PCO2 (middle panel) and VD/VT (right panel). The four different expressions of PCO2 and VD/VT are shown. Closed circles: PaCO2, arterial partial pressure of carbon dioxide from blood gas; VD/VTABG, VD/VT calculated using PaCO2. Open circles: V˙E/V˙O2, ventilatory equivalent for oxygen; TcPCO2, transcutaneous partial pressure of carbon dioxide; VD/VTTc, VD/VT calculated using TcPCO2. Closed triangles: V˙E/V˙CO2, ventilatory equivalent for carbon dioxide; PaCO2-Jones, estimated partial pressure of carbon dioxide using the Jones equation [Citation7]; VD/VT-Jones, VD/VT calculated usingPaCO2-Jones. Open triangles: PETCO2, end-tidal partial pressure of carbon dioxide; VD/VTETCO2, VD/VT calculated using PETCO2. The representative subject with FEV1=40%predicted and FEV1/FVC = 33% (GOLD 3 COPD). Vertical lines showed the change in exercise phase (from left to right): start of unloaded cycling; start of incremental exercise; lactate threshold and start of recovery.](/cms/asset/2cc62c6b-22fd-4dcc-864a-f757ae9abcbb/icop_a_1858403_f0001_c.jpg)
Group responses
Exercise duration was variable among participants, therefore the total number of arterial samples varied between 7 and 14 per patient during rest, UL and exercise. In total, 10 subjects provided 114 measurements of PCO2 and VD/VT indices during rest, UL and exercise.
There was no statistically significant difference between TcPCO2 and PaCO2 at rest, during UL, at the LT and at peak exercise (, ). Both TcPCO2 and PaCO2 were consistently greater than either PaCO2-Jones or PETCO2, with PETCO2 being consistently the lowest of the four PCO2 values (). As a result, VD/VTTc was not different from VD/VTABG, but both were greater than VD/VT-Jones (VD/VT calculated using PaCO2-Jones) at rest, with VD/VTETCO2 (VD/VT calculated using PETCO2) being significantly lower than the gold standard (VD/VTABG) at all stages of test (, , Supplementary material Table S1).
Figure 2. Mean (±SE) V˙E/V˙CO2, PCO2, VD/VT during a ramp incremental exercise test using 4 different methods of PCO2 assessment in 10 COPD patients. Ventilatory equivalents (left panel), PCO2 (middle panel) and VD/VT (right panel).UL, Unloaded cycling. LT, lactate threshold. The four different expressions of PCO2 and VD/VT are shown. Closed circles: PaCO2, arterial partial pressure of carbon dioxide from blood gas; VD/VTABG, VD/VT calculated using PaCO2. Open circles: TcPCO2, transcutaneous partial pressure of carbon dioxide; VD/VTTc, VD/VT calculated using TcPCO2. Closed triangles: PaCO2-Jones, estimated partial pressure of carbon dioxide using the Jones equation [Citation7]; VD/VT-Jones, VD/VT calculated using PaCO2-Jones. Open triangles: PETCO2, end-tidal partial pressure of carbon dioxide; VD/VTETCO2, VD/VT calculated using PETCO2. *p < 0.05, **p < 0.01, ***p < 0.001 vs. PaCO2 or VD/VTABG. #p < 0.05, ##p < 0.01, ###p < 0.001 vs. LT (for PCO2) or peak (for VD/VT).
![Figure 2. Mean (±SE) V˙E/V˙CO2, PCO2, VD/VT during a ramp incremental exercise test using 4 different methods of PCO2 assessment in 10 COPD patients. Ventilatory equivalents (left panel), PCO2 (middle panel) and VD/VT (right panel).UL, Unloaded cycling. LT, lactate threshold. The four different expressions of PCO2 and VD/VT are shown. Closed circles: PaCO2, arterial partial pressure of carbon dioxide from blood gas; VD/VTABG, VD/VT calculated using PaCO2. Open circles: TcPCO2, transcutaneous partial pressure of carbon dioxide; VD/VTTc, VD/VT calculated using TcPCO2. Closed triangles: PaCO2-Jones, estimated partial pressure of carbon dioxide using the Jones equation [Citation7]; VD/VT-Jones, VD/VT calculated using PaCO2-Jones. Open triangles: PETCO2, end-tidal partial pressure of carbon dioxide; VD/VTETCO2, VD/VT calculated using PETCO2. *p < 0.05, **p < 0.01, ***p < 0.001 vs. PaCO2 or VD/VTABG. #p < 0.05, ##p < 0.01, ###p < 0.001 vs. LT (for PCO2) or peak (for VD/VT).](/cms/asset/f6907b4b-4be3-42a4-9e22-6f76124ee841/icop_a_1858403_f0002_c.jpg)
Table 2. Ventilatory, gas exchange and blood gases at rest and during incremental exercise in COPD patients.
Comparison of PCO2 and VD/VT using transcutaneous measurements vs. ABG
Analyses were performed that included all data points during rest, UL, at the LT and peak exercise. Data in the recovery phase (see Supplementary material Appendix) were not included in the validation because TcPCO2 did not track well the rapid changes observed in PaCO2 during the first 4 min of recovery (, Supplementary material and ).
presents the comparison of TcPCO2 with PaCO2. Across the range of PaCO2 values observed (between 27.6 and 51.0 mmHg), there was a strong positive correlation between TcPCO2 and PaCO2 (r2 = 0.907). There was a significant positive intercept (Y0 = 6.56 mmHg) and a slope slightly less than one (a = 0.86) (p < 0.001 for both) (). Bland-Altman analysis revealed a small positive bias (0.86 ± 1.60) mmHg with lower and upper limits of agreement between −2.28 and 3.99 mmHg (). On average, at low PaCO2 (<35 mmHg), the transcutaneous device slightly overestimated PaCO2. Lin’s concordance correlation analysis (CCC) confirmed that the agreement between PaCO2 and TcPCO2 was moderate (CCC = 0.941; 95% confidence interval = 0.838–0.979)) ().
Figure 3. Regression and Bland-Altman analysis of PCO2 and VD/VT using ABG and transcutaneous measurements during rest and incremental exercise in 10 COPD patients. A. Scatter plot and linear regression of TcPCO2 vs. PaCO2. B. Bland-Altman plot of agreement between TcPCO2 and PaCO2. C. Scatter plot and linear regression of VD/VTTc vs. VD/VTABG. D. Bland-Altman plot of agreement between VD/VTTc and VD/VTABG.
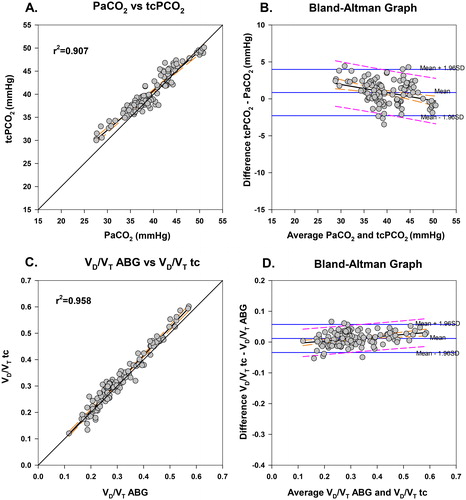
Table 3. Lin's Concordance Correlation Coefficients (CCC) and Bland–Altman analyses among the four different expressions of PaCO2 and VD/VT during rest and incremental exercise in COPD patients.
presents the comparison of VD/VT using TcPCO2 or PaCO2 for calculation. The linear regression of VD/VTTc and VD/VTABG shows a strong correlation (r2=0.958). The intercept was zero (Y0 = 0.00) and the slope of the regression is nearly on the line of identity (a = 1.05, p < 0.001) (). Bland-Altman analysis showed a minimal positive bias (0.01 ± 0.02), and a narrow limit of agreement (-0.03 to 0.06) (). CCC analysis confirmed the substantial agreement between VD/VTTc and VD/VTABG (CCC = 0.967 (95% confidence interval = 0.914–0.987)) ().
Comparison of PCO2 and VD/VT using jones equation vs. ABG
The linear regression of PaCO2-Jones with PaCO2 had a negative intercept (-3.62 mmHg) with a positive slope close to the line of identity (1.03, p < 0.001) (). There was a negative bias (-2.42 ± 3.03) mmHg with wide limits of agreement of −8.37 to 3.53 mmHg and the regression coefficient was r2=0.755 (p < 0.001) (). CCC was poor (CCC = 0.832 (95% confidence interval = 0.588–0.937)) ().
Figure 4. Regression and Bland-Altman analysis of PCO2 and VD/VT using ABG and Jones equation during rest and incremental exercise in 10 COPD patients. A. Scatter plot and linear regression of PaCO2-Jones vs. PaCO2. B. Bland-Altman plot of agreement between PaCO2-Jones and PaCO2. C. Scatter plot and linear regression of agreement between VD/VT-Jones and VD/VTABG. D. Bland-Altman plot of agreement between VD/VT-Jones and VD/VTABG.
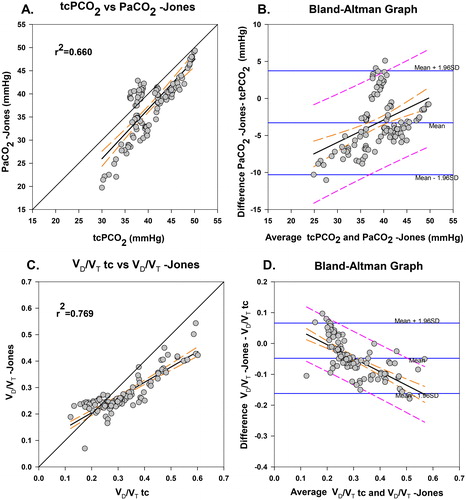
In the VD/VT comparisons (), there was a positive intercept (0.08) and slope (0.63) of the regression line with an r2=0.793. shows that the only region where the VD/VT-Jones agreed with the VD/VTABG is where VD/VTABG was ∼0.25; in other words where dead-space was in the normal range. The Bland-Altman analysis confirmed a negative bias (-0.04 ± 0.05) with limits of agreement between −0.14 and 0.06 (). CCC displayed poor agreement (CCC = 0.760 (95% confidence interval = 0.487–0.897)) ().
Comparison of PCO2 and VD/VT using end-tidal PCO2 vs. ABG
A significant deviation from the line of identity with a good correlation (r2=0.755, p < 0.001) between PETCO2 and PaCO2 with a negative intercept (Y0 = -10.12, p < 0.001) and a slope greater than one (a = 1.15, p < 0.001) (). Bland-Altman analysis showed a systematic bias (-4.40 ± 3.45) mmHg, with limits of agreement between −11.16 and 2.36 mmHg. These suggested that PaCO2 was 4.40 ± 3.45 mmHg greater than PETCO2 (p < 0.001) (). CCC showed poor agreement between PETCO2 and PaCO2 (CCC = 0.718 (95% confidence interval = 0.411 ∼ 0.879)) ().
Figure 5. Regression and Bland-Altman analysis of PCO2 and VD/VT using ABG and end -tidal CO2 during rest and incremental exercise in 10 COPD patients. A. Scatter plot and linear regression of PETCO2 vs. PaCO2. B. Bland-Altman plot of agreement between PETCO2 and PaCO2. C. Scatter plot and linear regression of VD/VTETCO2 vs. VD/VTABG. D. Bland-Altman plot of agreement between VD/VTETCO2 and VD/VTABG.
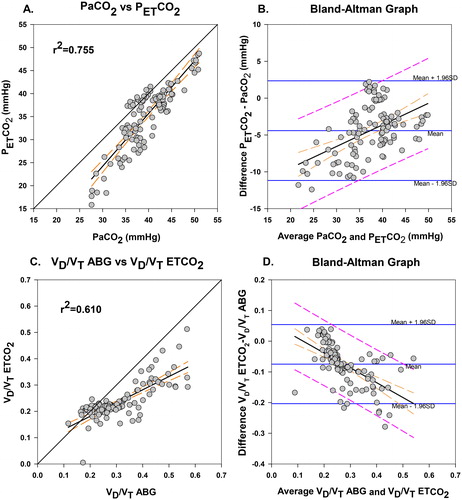
In the VD/VT comparisons (), there was a positive intercept (0.08) and a very shallow slope (0.50) with r2=0.610 (p < 0.001). This suggested a very narrow region could be used for VD/VT estimation (VD/VT around 0.2 ∼ 0.3, ). Bland-Altman analysis showed a negative bias (-0.07 ± 0.07) with limits of agreement between −0.20 and 0.06 (). CCC showed poor agreement between VD/VTETCO2 and VD/VTABG (CCC = 0.448 (95% confidence interval = 0.131 ∼ 0.681)) ().
Discussion
Since the transcutaneous PCO2 measurement was approved for clinical use, the comparisons of TcPCO2 with other methods had been examined [Citation16, Citation29, Citation30]. The gold standard method to determine efficiency of gas exchange (VD/VT) during an exercise test requires direct sampling of the arterial blood gases to determine PaCO2 and application to the Bohr equation with Enghoff modification [Citation6]. However, arterial blood gases can be accompanied by patient discomfort, transient hyperventilation, poor patient acceptance, and complications such as hematoma, bleeding, or infection [Citation31].
A noninvasive method to accurately and precisely determine PaCO2 would be of great benefit to cardiopulmonary exercise testing for clinical assessment or research to better understand exercise induced changes in VD/VT and gas exchange in efficiency. Jones et al. [Citation7] formulated an equation to estimate PaCO2 from measurements of PETCO2 and VT, and validated it in healthy participants. However, the authors cautioned that the equation would be invalid under circumstances of V̇A/Q̇ abnormality, which is an underlying cause of gas exchange inefficiency in many patients referred for clinical exercise testing. Theoretically, central shunt (patent or opening foramen ovale during exercise) can influence the difference between PaCO2 and PETCO2. Therefore, we sought to determine whether a noninvasive TcPCO2 measurement would provide sufficient accuracy and precision to understand exercise VD/VT in patients diagnosed with COPD in the exercise physiology laboratory. It should be noted that V˙E/V˙CO2 is often referred to as “ventilatory efficiency”, and is related to VD/VT in clinical exercise testing [Citation9]. However, V˙E/V˙CO2 is not an isolated measure of pulmonary abnormalities, as it also depends on the instantaneous value of PaCO2. VD/VT provides a purer measure of lung gas exchange abnormality, isolated from differences in ventilatory control that act to influence PaCO2.
Our results indicate moderate concordance between TcPCO2 and PaCO2 over a wide range of PaCO2 (from mid 20 s to low 50 s mmHg), and across all exercise testing phases except for recovery. It also showed substantial concordance for the resulting VD/VT calculated using V̇E/V̇CO2 from pulmonary gas exchange measurements and TcPCO2. We confirmed that concordance of TcPCO2 with PaCO2 to measure VD/VT during exercise in COPD was stronger than either the Jones equation or using PETCO2 alone.
Clark et al. suggested that in order to be able to follow relatively fast changes in PaCO2 (and PaO2) the noninvasive blood gas monitoring analyzer should have a response time (10–90%) about 20 s [Citation32] or an order of magnitude faster than changes anticipated to be measured. The response time of the transcutaneous device with the current Severinghaus CO2 electrode is between 60 and 90 s, depending on the temperature of the sensor. Carter demonstrated that the TcPCO2 response time was decreased by heating the sensor [Citation16], which was the rationale behind our selection of probe temperature of 44°C. Heating the sensor helps to ensure constant response time and has the added benefit of local vasodilation, which results in a capillary PCO2 that is closer to the arterial PCO2. This appears to be adequate during rest and incremental exercise testing. However, our data shows clearly that when PaCO2 changes rapidly, as it does in recovery when a relative hyperventilation is operative, PaCO2 changes were not followed well by the transcutaneous electrode. The TcPCO2 values were significantly different from PaCO2 from the 2nd to 4th minute of recovery ( and Supplementary material Table S1 and Figures S1 and S2). This implies that the response time of the TcPCO2 electrode is slow relative the rate of change of the signal (PaCO2), and/or the perfusion or diffusion altered dramatically in recovery. For these reasons we did not include samples from recovery in our analysis and do not recommend that transcutaneous measurements be used to assess VD/VT in recovery phase of exercise. We also caution against interpretation of VD/VT in subjects where PaCO2 is expected to change abruptly during exercise, such as exercise-induced shunts in pulmonary hypertension (opening of a patent foramen ovale) or in subjects with dramatic and frank hyperventilation in exercise such as in mitochondrial myopathy. In these conditions other features of the cardiopulmonary exercise test data can be used to interpret the validity of VD/VT based on TcPCO2 measurements.
Another goal of our study was to compare the accuracy and precision of VD/VT during exercise in COPD subjects determined using TcPCO2 with the gold standard of direct PaCO2 measurement. We found substantial concordance of VD/VT from TcPCO2 and PaCO2 over a range of VD/VT of ∼20% to ∼50%. Our analysis illustrated that, just as the values of TcPCO2 and PaCO2 were very similar, the VD/VT calculated from these two variables were within acceptable agreement during rest and exercise.
The general trend of VD/VT changes as exercise intensity increases is characteristic and somewhat different from PaCO2 changes. PaCO2 starts to decrease shortly after the lactate threshold (LT) (due to relative hyperventilation), but this does not result in appreciable change in VD/VT. Our data confirm that when using either the Jones equation or PETCO2 alone the VD/VT concordance was poor in COPD patients. These two estimates of VD/VT are approximately accurate only when VD/VT is normal, otherwise they greatly underestimate the true value.
We considered the effects of temperature on both the TcPCO2 probe and the blood gas analyzer values. The transcutaneous CO2 device probe makes measurements at a temperature of 44 °C but corrects the measured TcPCO2 values to 37 °C. Similarly, the blood gas analyzer conducts measurements at 37 °C, so no temperature correction is required to compare the two modalities for their PaCO2 measurements. Also, the change in body temperature during a brief exercise study is small (< = 1 °C)y where temperature during exercise was studied during a 30 min exercise session, the average change in body temperature of the subject was very small (on average only 1 °C), and the resultant PaCO2 changes were very small (≤1.6 mmHg) [Citation33]. All of our exercise studies had a duration than 15–20 min in total duration.
Limitations
This is a single center study, and the results may not be fully generalizable to other centers. Also, as all participants in this study have COPD, it would be optimal to test the device in other pathological states that affect gas exchange efficiency, for example subjects with pulmonary hypertension, interstitial lung disease, or heart failure, where assessing the adequacy of pulmonary gas exchange might be important for diagnosis, assessing therapeutic interventions and outcomes. This necessity of further validation seems to be particularly relevant in conditions where peripheral microcirculatory abnormalities might affect the skin or the perfusion under the probe, e.g., in advanced stages of heart failure or scleroderma associated pulmonary hypertension.
Another limitation is that we have not corrected for the response kinetics of the transcutaneous electrode, which can influence the agreement of PCO2 and VD/VT values, especially when PaCO2 is rapidly changing. Our aim was to determine the validity the TcPCO2 measurement without the added laboratory and participant burden for an “in vivo calibration” by ABG or prior knowledge of the response kinetics of the particular transcutaneous device – thus validating the approach for more widespread application. Our finding that VD/VTTc results showed substantial agreement with VD/VT at landmark physiological events during rest and exercise (LT, peak exercise) in COPD patients with a wide range of VD/VT supports this contention. In the participants studied, changes in PaCO2 during incremental exercise were slow enough that the response time of the transcutaneous electrode did not impair accuracy of VD/VT measurement except during recovery.
Finally, we acknowledge that VD/VT assessment does not provide a full picture of gas exchange abnormalities in that it does not quantitatively describe the presence and magnitude of shunt and ventilation/perfusion imbalance.
Conclusion
We showed in patients with a range of COPD severity, that a commercially available TcPCO2 measurement could provide VD/VT estimates that share substantial concordance with the gold standard measured by arterial blood gas analysis. VD/VT from TcPCO2 proved in closer agreement than other commonly used alternatives for noninvasive VD/VT estimation (such as, the Jones equation or substitution with PETCO2). In vivo calibration with a resting arterial blood gas measurement or correction for measurement response kinetics was not needed to maintain substantial concordance of VD/VT estimates during rest and exercise. However, concordance was lost during recovery where PaCO2 changes rapidly. From the practical point of view, utilizing the noninvasive TcPCO2 device during incremental cardiopulmonary exercise testing provides the current best noninvasive alternative to measuring PaCO2 from the arterial blood samples for VD/VT assessment.
Author’s contributions
William W. Stringer contributed to the study conception, data collection, data analysis, abstract and manuscript preparation, and is the guarantor of the manuscript. Janos Porszasz, Richard Casaburi, Harry B. Rossiter contributed to study conception. Robert Cao contributed to subject recruitment. Janos Porszasz, Robert Cao, Robert Calmelat, Susan Corey contributed to data collection. Min Cao, Arin Orogian, Fang Lin, Janos Porszasz contributed to data analysis. Arin Orogian, Janos Porszasz contributed to abstract preparation. Min Cao, Janos Porszasz, Harry B. Rossiter, Richard Casaburi contributed to manuscript preparation. All authors approved the final submitted version.
Role of the sponsors
The sponsor had no role in the design of the study, the collection and analysis of the data, or the preparation of the manuscript.
Supplemental Material
Download PDF (971.6 KB)Acknowledgements
We are grateful to Xiuqing Guo and Jingyi Tan, for their help in mathematical and statistical analysis during the data preparation.
Conflicts of interest
None of the authors report any conflict of interest
Additional information
Funding
References
- O’Donnell DE, Elbehairy AF, Faisal A, et al. Exertional dyspnoea in COPD: the clinical utility of cardiopulmonary exercise testing. Eur Respir Rev. 2016;25(141):333–347. DOI:10.1183/16000617.0054-2016
- Rutter M, Camillo CA, Coss P, et al. European Respiratory Society International Congress 2018: Allied Respiratory Professionals’ report of highlighted sessions. ERJ Open Res. 2019;5(1):00182-2018. DOI:10.1183/23120541.00182-2018
- Varga J. Mechanisms to dyspnoea and dynamic hyperinflation related exercise intolerance in COPD. Acta Physiol Hung. 2015;102(2):163–175. DOI:10.1556/036.102.2015.2.7
- Neder JA, Berton DC, Muller PT, et al. Ventilatory inefficiency and exertional dyspnea in early chronic obstructive pulmonary disease. Ann Am Thorac Soc. 2017;14(Supplement_1):S22–S29. DOI:10.1513/AnnalsATS.201612-1033FR
- Bohr C. Ueber die lungenathmung. 1891. 236–268. DOI:10.1111/j.1748-1716.1891.tb00581.x
- Enghoff H. Volumen inefficax. Upsala Lakaref Forh. 1938;44:191–218.
- Jones NL, Robertson DG, Kane JW. Difference between end-tidal and arterial PCO2 in exercise. J Appl Physiol Respir Environ Exerc Physiol. 1979;47(5):954–960. DOI:10.1152/jappl.1979.47.5.954
- Lewis DA, Sietsema KE, Casaburi R, et al. Inaccuracy of noninvasive estimates of VD/VT in clinical exercise testing. Chest. 1994;106(5):1476–1480. DOI:10.1378/chest.106.5.1476
- Roman MA, Casaburi JD, Porszasz J, et al. Noninvasive assessment of normality of VD/VT in clinical cardiopulmonary exercise testing utilizing incremental cycle ergometry. Eur J Appl Physiol. 2013;113(1):33–40. DOI:10.1007/s00421-012-2407-8
- Godfrey S, Davies CT. Estimates of arterial PCO2 and their effect on the calculated values of cardiac output and dead space on exercise. Clin Sci. 1970;39(4):529–537. DOI:10.1042/cs0390529
- Planes C, Leroy M, Foray E, et al. Arterial blood gases during exercise: validity of transcutaneous measurements. Arch Phys Med Rehabil. 2001;82(12):1686–1691. DOI:10.1053/apmr.2001.26248
- Hoffmann U, Essfeld D, Stegemann J. Comparison of arterial, end-tidal and transcutaneous PCO2 during moderate exercise and external CO2 loading in humans. Eur J Appl Physiol Occup Physiol. 1990;61(1-2):1–4. DOI:10.1007/BF00236685
- Sridhar MK, Carter R, Moran F, et al. Use of a combined oxygen and carbon dioxide transcutaneous electrode in the estimation of gas exchange during exercise. Thorax. 1993;48(6):643–647. DOI:10.1136/thx.48.6.643
- Stege G, van den Elshout FJ, Heijdra YF, et al. Accuracy of transcutaneous carbon dioxide tension measurements during cardiopulmonary exercise testing. Respiration. 2009;78(2):147–153. DOI:10.1159/000187631
- Fernandes TM, Alotaibi M, Strozza D, et al. Dyspnea postpulmonary embolism from the physiological dead space proportion and stroke volume defects during exercise. Chest. 2020;157(4):936–944. DOI:10.1016/j.chest.2019.10.047
- Carter R, Banham SW. Use of transcutaneous oxygen and carbon dioxide tensions for assessing indices of gas exchange during exercise testing. Respir Med. 2000;94(4):350–355. DOI:10.1053/rmed.1999.0714
- Miller MR, Hankinson J, Brusasco V, ATS/ERS Task Force, et al. Standardisation of spirometry. Eur Respir J. 2005;26(2):319–338. DOI:10.1183/09031936.05.00034805
- Whipp BJ, Davis JA, Torres F, et al. A test to determine parameters of aerobic function during exercise. J Appl Physiol Respir Environ Exerc Physiol. 1981;50(1):217–221. DOI:10.1152/jappl.1981.50.1.217
- Bentley DJ, Newell J, Bishop D. Incremental exercise test design and analysis: implications for performance diagnostics in endurance athletes. Sports Med. 2007;37(7):575–586. DOI:10.2165/00007256-200737070-00002
- Dev SP, Hillmer MD, Ferri M. Videos in clinical medicine. Arterial puncture for blood gas analysis. N Engl J Med. 2011;364(5):e7. DOI:10.1056/NEJMvcm0803851
- Whipp BJ, Ward SA. Determinants and control of breathing during muscular exercise. Br J Sports Med. 1998;32(3):199–211. DOI:10.1136/bjsm.32.3.199
- Bland JM, Altman DG. Agreement between methods of measurement with multiple observations per individual. J Biopharm Stat. 2007;17(4):571–582. DOI:10.1080/10543400701329422
- Lin LI. A concordance correlation coefficient to evaluate reproducibility. Biometrics. 1989;45(1):255–268. DOI:10.2307/2532051
- Eltoukhy M, Oh J, Kuenze C, et al. Improved kinect-based spatiotemporal and kinematic treadmill gait assessment. Gait Posture. 2017; 51:77–83. DOI:10.1016/j.gaitpost.2016.10.001
- Josep Lluis Carrasco JPM. cccrm: Concordance Correlation Coefficient for Repeated (and Non-Repeated) Measures. 2015. 07-08.
- Hankinson JL, Odencrantz JR, Fedan KB. Spirometric reference values from a sample of the general U.S. population. Am J Respir Crit Care Med. 1999;159(1):179–187. DOI:10.1164/ajrccm.159.1.9712108
- Miller A, Thornton JC, Warshaw R, et al. Single breath diffusing capacity in a representative sample of the population of Michigan, a large industrial state. Predicted values, lower limits of normal, and frequencies of abnormality by smoking history. Am Rev Respir Dis. 1983; 127:270–277.
- Quanjer PH, Tammeling GJ, Cotes JE, Pedersen OF, et al. Lung volumes and forced ventilatory flows. Eur Respir J. 1993;6 Suppl 16:5–40. DOI:10.1183/09041950.005s1693
- Kelly AM, Klim S. Agreement between arterial and transcutaneous PCO2 in patients undergoing non-invasive ventilation. Respir Med. 2011;105(2):226–229. DOI:10.1016/j.rmed.2010.11.010
- Lambert LL, Baldwin MB, Gonzalez CV, et al. Accuracy of transcutaneous CO2 values compared with arterial and capillary blood gases. Respir Care. 2018;63(7):907–912. DOI:10.4187/respcare.05936
- Scheer B, Perel A, Pfeiffer UJ. Clinical review: complications and risk factors of peripheral arterial catheters used for haemodynamic monitoring in anaesthesia and intensive care medicine. Crit Care. 2002;6(3):199–204. DOI:10.1186/cc1489
- Clark JS, Votteri B, Ariagno RL, et al. Noninvasive assessment of blood gases. Am Rev Respir Dis. 1992;145(1):220–232. DOI:10.1164/ajrccm/145.1.220
- Holmgren A, Mcilroy MB. Effect of temperature on arterial blood gas tensions and pH during exercise. J Appl Physiol. 1964;19:243–245. DOI:10.1152/jappl.1964.19.2.243