Abstract
Although ischemia is associated with disruption of cadherin-mediated adhesion in renal cell lines, the impact of decreased cadherin function on the transcriptional activity of β-catenin remains poorly defined. In these studies, we used a simulated ischemia model in normal rat kidney (NRK) cells to disrupt cadherin function. Cell viability; cadherin/catenin expression, function, and localization; and β-catenin-mediated transcriptional activity were assessed during ischemia/reperfusion. Following 6 hr of ischemia, a decrease in the expression of E- and N-cadherin was seen that correlated with altered cell morphology indicative of decreased intercellular adhesion. While ischemia was associated with activation of glycogen synthase kinase 3 beta (GSK-3β), this did not correlate with increased phosphorylation of β-catenin as assessed by Western blots using phosphoryl-specific antibodies. β-Catenin was not localized to the nucleus by immunofluorescence in ischemic NRK cells, but rather a strong perinuclear signal was seen in reperfused cells. This was consistent with the finding that neither ischemia nor reperfusion activated the transcriptional activity of β-catenin as assessed by the TCF-optimal promoter (TOPFlash) construct. However, NRK cells possess a competent Wnt pathway, as challenge with lithium chloride elicited a ten-fold increase in luciferase activity. These results suggest that ischemia-induced disruption of cadherin/catenin complexes is not sufficient to stimulate β-catenin transcriptional activity in NRK cells.
INTRODUCTION
Ischemia is the leading cause of acute renal failure (ARF) (Liano and Pascual Citation1996), which is characterized by a dramatic reduction in glomerular filtration rate (GFR). Bonventre and Weinberg (Citation2003) listed six critical tubular events in the pathogenesis of ARF: 1) disruption of the actin cytoskeleton, 2) loss of polarity, 3) cell death via apoptosis and/or necrosis, 4) shedding of viable and necrotic cells, 5) tubular obstruction, and 6) backleak of the glomerular filtrate from the proximal tubules. As several of these changes involve disruption of intercellular adhesion, it is paramount to understand the impact of ischemia on the cadherin/catenin complex.
Adherens junctions are composed of cadherins and catenins and are essential for the formation and maintenance of functional cellular junctions (Citi Citation1993). The cadherin gene superfamily encodes for transmembrane proteins that regulate Ca+ +-dependent cell–cell adhesion in association with intracellular proteins, the catenins, for adhesive activity (reviewed in Goodwin and Yap Citation2004). The renal expression of cadherin molecules is complex, with reports of at least eight cadherins present in the kidney (E-, K-, Ksp-, N-, OB-, P-, R-, and VE-cadherins). OB-cadherin is a mesenchymal cadherin (Simonneau et al. Citation1995), P-cadherin is expressed in glomeruli (Cho et al. Citation1998), and VE-cadherin is expressed in endothelial cells (Sutton et al. Citation2003). The expression of K- and R-cadherin is mainly confined to the tubules in developing kidneys (Cho et al. Citation1998; Dahl et al. 2000; Goto et al. Citation1998; Shimazui et al. Citation2000), suggesting that E-, Ksp-, and N-cadherins are the primary cadherins expressed in the tubules of the adult kidney.
Molitoris and Marrs (Citation1999) have reviewed the evidence for the role of cell adhesion molecules, including cadherins, in ARF. A backleak of the glomerular filtrate into the interstitium and venous system in human patients with renal failure is compelling evidence for decreased cell–cell adhesion in proximal tubular epithelial cells (Myers et al. Citation1979; Moran and Myers Citation1985). The finding that the localization of cadherins and catenins is altered in patients with sustained ARF (Kwon et al. Citation1998) further strengthens the hypothesis that alterations in cadherin/catenin complexes are associated with ARF. Internalization of E-cadherin was seen in Madin–Darby canine kidney (MDCK) cells challenged with antimycin A and 2-deoxyglucose to deplete ATP (Mandel et al. Citation1994). Bush et al. (Citation2000) have shown that chemical ischemia (antimycin A/2-deoxyglucose) caused degradation of E-cadherin to an approximately 80 kDa fragment, which was not blocked by inhibitors of the proteasomal, lysosomal, or calpain proteolytic pathways. Our laboratory has shown that ischemia is associated with activation of membrane type-1 matrix metalloproteinase (MT1-MMP; MMP-14) that disrupts cadherin expression and function in the NRK-52E cell line (Covington et al. Citation2005; Covington et al. 2006).
In addition to a critical role in cadherin-based intercellular adhesion, β-catenin also regulates gene expression through its transcriptional activity as first discovered almost a decade ago. β-Catenin is a component of the Wnt pathway (reviewed in Nelson and Nusse Citation2004) and lies downstream of glycogen synthase kinase-3β(GSK-3β). Activation of Wnt signaling results in inhibition of GSK-3β activity via phosphorylation of the serine at GSK-3β 's ninth residue (Ser9) (reviewed in Grimes and Jope Citation2001) causing an accumulation of cytoplasmic β-catenin, which may then translocate to the nucleus and regulate transcription via the Tcf/Lef family of transcription factors (reviewed in Cadigan and Nusse Citation1997). Several genes regulated by β-catenin have been identified, including cyclin D1, c-myc, c-jun, and E-cadherin (Willert and Nusse Citation1998). Conversely, phosphorylation of β-catenin by active GSK-3β targets the protein for ubiquitination and degradation (reviewed in Polakis Citation2002); therefore GSK-3β activity is a key regulator of β-catenin signaling and transcriptional activity. While much of the interest has focused on mutations within this pathway in cancer (reviewed in Behrens and Lustig Citation2004; Karim et al. Citation2004), studies investigating acute stresses that disrupt cadherin-mediated cell adhesion on β-catenin signaling are emerging (Mei et al. Citation2002; Price et al. Citation2002; Reiss et al. Citation2005). In this study, we investigated if ischemia-induced disruption of the cadherin/catenin complex in renal cells was sufficient to activate β-catenin transcriptional activity.
MATERIALS AND METHODS
Cell Culture
NRK-52E cells (American Type Culture Collection (ATCC), Gaithersburg, MD) were cultured on plastic culture dishes in Dulbecco's modified Eagle's medium (DMEM) containing 1.5 g/L sodium bicarbonate and 5% bovine serum in an atmosphere of 5% CO2/95% air at 37°C. At confluence (4 to 5 days), subcultures were prepared by treatment with 0.02% ethylene diamine tetraacetic acid (EDTA) and 0.05% trypsin solution; cells were seeded at a density of 4 × 10⁴ cells/cm2. Cells were used between passages 3 and 20. SW480 cells (colon adenocarcinoma; CCL-228; ATCC, Gaithersburg, MD) were cultured on plastic culture dishes in Leibovitz's L-15 medium containing 1.5 g/L sodium bicarbonate and 10% fetal bovine serum. Cells were subcultured at a 1:4 ratio and used between passages 3 and 6.
Simulated Ischemia
Using a protocol adapted by our laboratory (Covington et al. Citation2005; Covington et al. 2006) from Meldrum et al. (Citation2001), confluent cells were washed twice with phosphate buffered saline (PBS) prior to the addition of PBS supplemented with 1.5-mM CaCl2 and 2-mM MgCl2. A layer of mineral oil (Sigma 400-5; Sigma–Aldrich, St. Louis, MO) was added to cell culture dish. For a 10-cm2 dish, 2 mL of PBS with Ca+ + and Mg+ + and 10 mL of mineral oil was used. After 3 to 6 hr of ischemia, cells were washed five times with PBS and normal growth media was added to simulate reperfusion. Unless otherwise noted, control cells were incubated for 6 hr in PBS with Ca+ + and Mg+ +.
The Janus Green assay was used to assess cell number (Raspotnig et al. 1999). Cells were harvested by washing four times with PBS, and absolute ethanol was then added to the culture dishes for 90 sec. After the ethanol was aspirated, Janus Green (1 mg/mL) was added for 60 sec, the dye was aspirated and the cells washed three times with PBS. Janus Green was extracted from the cells using absolute ethanol, and the absorbance at 654 nm was measured on a spectrophotometer.
Cell viability was assessed using the neutral red uptake assay as described by Rossman et al. (Citation1997). Fifty microliters of neutral red dye (2 mg/mL) was added to the cultures (final concentration, 50 μ g/mL) 3 hr before harvest. One mL of fixative (1% formaldehyde; 1% CaCl2) was added for 5 min after the media was aspirated. After the fixative was aspirated, the plate was dried. Three mL of 1% acetic acid/50% ethanol was added for 15 min and the absorbance at 540 nm was read. Cellular ATP levels were determined with a luciferin–luciferase bioluminescence assay using the ATP determination kit (Molecular Probes, Eugene, OR); this assay is based on light generation following the ATP-dependent conversion of luciferin via luciferase. The assay is sensitive to 0.1 pmol of ATP. The activity was normalized to the protein concentration and is presented as a percentage of control.
Western Blots
Cell culture plates were washed twice with PBS, scraped, and centrifuged. The supernatant was removed and the cell pellet was washed with cold PBS, lysed in buffer (10-mM Tris/HCl, pH 7.6; 1% sodium dodecyl sulfate (SDS); 1-mM phenylmethanesulfonyl fluoride (PMSF); 1-mM leupeptin; and 1-mM orthovanadate) and boiled for 10 min. The homogenates were spun at 18,000 × g for 10 min, and the supernatant was collected. For detection of hypoxia-inducible factor 1α (HIF-1α), a nuclear fraction was prepared from the cells using the method of van de Wetering et al. (Citation1991). Proteins were quantified by the Bradford method and diluted to 1 μ g/μ L in 2X sample buffer (250-mM Tris/HCl, pH 6.8; 4% SDS; 10% glycerol; 2% β-mercaptoethanol; and 0.006% bromophenol blue). Samples were boiled for 5 min prior to electrophoresis and 20 μg of protein was separated by SDS-PAGE. Separated proteins were transferred onto a Hybond-ECL nitrocellulose membrane (Amersham, Piscataway, NJ) in transfer buffer (25-mM Tris, 200-mM glycine, 20% methanol, and 1% SDS). Nonspecific binding was blocked by incubation with Tris-buffered saline plus Tween-20 (TBST) blocking buffer (0.1% Tween-20; 10-mM Tris, pH 7.5; 100-mM NaCl) supplemented with 5% nonfat dry milk for 1 hr at room temperature. Primary antibodies (monoclonal antibodies against E-cadherin, N-cadherin, β-catenin, and GSK-3β were purchased from BD Biosciences (San Jose, CA); polyclonal antibodies against phospho-GSK3α /β and phospho–β-catenin were purchased from Cell Signaling Technology (Danvers, MA); a monoclonal antibody against HIF-1α was purchased from Novus Biologicals (Littleton, CO) were diluted in the same buffer and incubated at 4°C overnight. After subsequent washes with TBST, membranes were incubated with secondary antibody (1: 20000 in TBST: 5% nonfat dry milk) against the appropriate species for 1 hr at room temperature. The blots were washed three times in TBST and proteins detected with the Amersham ECL system.
Immunofluorescence
Cells grown on LabTek Chamber Slides (Nalge Nunc International, Rochester, NY) were washed twice with PBS, fixed in 2% paraformaldehyde for 10 min, washed two times in 0.02-M PBS for 10 min, and permeabilized in 1% Triton X-100 in 0.02-M PBS for 10 min. Slides were treated with 1: 20 blocking solutions of serum related to species in which the secondary antibody was generated at room temperature for 1 hr. A monoclonal anti-β-catenin antibody (BD Biosciences; 1:100) was added at appropriate dilutions overnight. After washing (0.3% Tween in 0.02-M PBS; PBST), fluorescein isothiocyanate (FITC)–conjugated secondary antibodies (1:200) were added and sections incubated in the dark at room temperature for 1 hr. Slides were mounted with DAPI anti-fade media (Molecular Probes, Eugene, OR) following several washes. Immunostained slides were visualized with a Zeiss Axioplan 2 microscope fitted with an Axiocam HR digital camera and Axiovision 3.0 software (all from Carl Zeiss, Inc., Thornwood, NY). Negative controls involved substituting IgG for primary antibodies and appropriate species serum for secondary antibodies.
Co-Immunoprecipitation
NRK cells were harvested in 500 μ L of lysis buffer (2% NP-40 in PBS; 1-mM PMSF, 1-mM leupeptin; 1-mM orthovanadate). The samples were centrifuged for 15 min at 12,000 rpm (4°C). The supernatant was collected and incubated on a rocker platform for 30 min at 4°C with 50 μ L of GammaBindTM Plus SepharoseTM 4°C on a rocker platform. The samples were spun for 10 min at 12,000 rpm (4°C) and protein concentration determined using the Bradford assay. Five hundred micrograms of protein was incubated with 5 μ g of anti–β-catenin antibody at 4°C for 1.5 hr. GammaBindTM Plus SepharoseTM (25 μ L) was added and the samples incubated at 4°C overnight. The proteins were collected by centrifugation for 10 min at 12,000 rpm at 4°C. The pellet was washed three times with lysis buffer prior to Western blot analysis using an anti–α -catenin antibody. The membrane was then stripped and reprobed with a β-catenin antibody as a loading control.
β-catenin/TCF Luciferase assay
The TCF Reporter Plasmid Kit was purchased from Upstate (Lake Placid, NY). The TOPFlash reporter construct consists of two repeats (with the second set in the reverse orientation) of three copies of the TCF binding site upstream of the thymidine kinase (TK) minimal promoter and a luciferase reporter. The FOPFlash reporter, which contains mutated TCF binding sites, was used as a negative control. NRK cells were grown to 80% confluence in six well plates. Cells were transfected with either 2 μ g/well of TOPFlash or FOPFlash using the Lipofectamine plus ReagentTM (Invitrogen, Cambridge, UK) for 6 hr. Twenty-four hr. after transfection, cells were challenged with the mineral oil method of simulated ischemia, as described above. Cells were treated with lithium chloride (50 mM) for 16 hr as positive controls. Cell lysates were harvested after treatment, the luciferase level was determined by a luciferase assay kit (Biovision, Mountain View, CA), and the activity was normalized to the protein concentration.
Quantitative PCR
Total RNA was isolated from NRK cells using TRIzol Reagent (Invitrogen) according to manufacturer's instructions and genomic DNA was removed by DNaseI (DNase free kit, Ambion; Austin, TX). One microgram of RNA was reverse transcribed to cDNA using the iScript cDNA synthesis kit (Bio-Rad; Hercules, CA). Real-time PCR using SYBR Green I technology was performed in Biorad's iCycler iQ with constant amounts of 10 ng reversely transcribed total RNA in a 25 μ L reaction volume using qPCR Mastermix from Biorad and 200 nM of each specific primer. β-actin was used as housekeeping control gene. The cyclin D forward primer was 5′-GCACAACGCACTTTCTTTCTTTCCA-3′, and the reverse primer was 5′-CGCAGGCTTGAC TCCGAAG-3′; c-myc forward primer was 5′-CCCGCTGACCCAACATCA-3′, and reverse was GTCTGCCCGTTGCAATGG-3′; c-jun forward primer was 5′-GAGCCAAGA ACTCGGACCTT-3′ and reverse was 5′-CCATTGCTGG ACTGG ATGATCAG-3′; β-actin forward primer was 5′-TCGTGCGTGACATTAAAGAGAAGC-3′, and the reverse was 5′-GATGCCACAGGATTCC ATACCCA-3′. The amplification conditions were as follows: 95°C for 1 min, followed by 40 cycles of 95°C for 30 s, 55°C for 30 s and 72°C for 30 s. A subsequent melting step was performed with slow heating starting at 60°C to 95°C at 0.2°C/s to verify the presence of a single amplicon. All reactions were run in quadruplicate, including non-template and RT minus controls. The difference between the mean Ct of the target gene and mean Ct β-actin was determined to obtain a Δ Ct. A Δ Δ Ct was generated by subtracting the Δ Ct experimental samples from Δ Ct of reversely transcribed cDNA obtained from universal RNA sample, which also serves as normalization for plates to plates variation. The relative fold change in expression is 2Δ ΔCt. The data were analyzed using the following approach: Given that CT,X = threshold cycle for target amplification; CT,R = threshold cycle for reference amplification; ![]() = CT,X averaged over technical replicates;
= CT,X averaged over technical replicates; ![]() = CT,R averaged over technical replicates; (sCT,X)2 = variance of CT,X;; (sCT,R)2 = variance of CT,R; (Δ CT)q =
= CT,R averaged over technical replicates; (sCT,X)2 = variance of CT,X;; (sCT,R)2 = variance of CT,R; (Δ CT)q = ![]() –
– ![]() (difference in mean target and reference CT values for sample q); (Δ CT)cb = the difference in
(difference in mean target and reference CT values for sample q); (Δ CT)cb = the difference in![]() values for the calibrator (cb); Δ Δ CT = (Δ CT)q – (Δ CT)cb; and 2− Δ Δ CT = relative fold change in expression of the target relative to the calibrator. By standard methods of error propagation, the standard deviation of 2− Δ Δ CT can be calculated as:
values for the calibrator (cb); Δ Δ CT = (Δ CT)q – (Δ CT)cb; and 2− Δ Δ CT = relative fold change in expression of the target relative to the calibrator. By standard methods of error propagation, the standard deviation of 2− Δ Δ CT can be calculated as:
Since the same number of technical replicates were used in each target and reference group, the overall standard error can be computed in the usual way as stdev/√n, where n = number of technical replicates, and stdev is obtained from the formula above.
ATP Depletion-Repletion
At confluence, NRK cells were washed three times with sterile PBS and incubated with glucose-free DMEM containing 10-mM sodium cyanide (NaCN) for 70 min as described by Price et al. (Citation2002). At this time, cells were washed five times with PBS prior to the addition of normal growth media for 1 hr. Cells were harvested after the 70 min of NaCN challenge or 1 hr of recovery to assess ATP levels. In certain experiments, cells were transfected with the TOPFlash or FOPFlash constructs as described above, and challenged with NaCN 24 hr after transfection, or were processed for immunofluorescence localization of β-catenin.
Statistics
Data were expressed as means ± standard error of the mean. Groups were compared using analysis of variance (ANOVA) followed by the Sidak post hoc test. A p-value < 0.05 was defined as significant.
RESULTS
Ischemia/Reperfusion Model
We used a model developed by Meldrum et al. (Citation2001) that closely parallels in vivo renal ischemia, in which mineral oil is used to simulate ischemia by restricting exposure to oxygen and metabolite washout. Based on the requirement for Ca+ + in cadherin function, we modified the model by using PBS supplemented with Ca+ + and Mg + + overlaid with mineral oil, to induce ischemia, as opposed to a direct overlay of the confluent cells with mineral oil. Reperfusion was simulated by washing the cultures five times with PBS, followed by the addition of normal growth medium (DMEM supplemented with 5% bovine serum). Neither cell number nor viability was significantly changed during simulated ischemia or reperfusion (). However, cellular levels of ATP decreased to less than 25% after 3 or 6 hr of ischemia (). ATP levels were restored to 60% of control after 6 hr of reperfusion. The decrease in ATP levels is similar to the 90% decrease seen in cells treated with sodium cyanide (Keller and Nigam Citation2003). To further verify the induction of hypoxia in the ischemia model, protein expression of an ischemia-inducible protein, HIF-1α was measured. An increase in HIF-1α protein was seen 3 and 6 hr after of ischemia, as well as following 1.5, but not 3 hr, of reperfusion (). Taken together, these results demonstrate that this in vitro model of ischemia is associated with hypoxia and a transient decrease in cellular ATP levels that are partially reversible following reperfusion in the absence of significant cell death.
Figure 1 Characterization of the mineral oil overlay model in NRK cells. Ischemia was induced in NRK cells by layering cells with PBS supplemented with 1.5-mM CaCl2 and 2-mM MgCl2 followed by mineral oil. After 3–6 hr, reperfusion was simulated by the removal of the mineral oil and the addition of normal growth medium to the cultures. (a) The impact of ischemia/reperfusion on cell number and cell viability was assessed using the Janus green, neutral red and ATP assays, respectively. Results are expressed as percentage of control from twelve replicate cell culture dishes; * indicates a significant difference in ATP levels as compared to control. (b) Nuclear lysates of ischemic NRK cells were prepared at the indicated times and separated by SDS-PAGE (12%). Following transfer, the blots were probed with a monoclonal anti–HIF-1α antibody. Signals were detected by ECL and autoradiography. Similar results were seen in three replicate experiments.
Cadherin/Catenin Expression and Function in Ischemic NRK Cells
Protein expression of E- and N-cadherin was evaluated by western blot analysis during ischemia and reperfusion. A decrease in full-length E-cadherin was seen at 1.5 hr of ischemia, and a complete loss of the protein was seen at 6 hr (), which was consistent with previous results (Covington et al. Citation2005; Covington et al. 2006). An intracellular 40 kDa fragment was seen after 3 and 6 hr of ischemia, as well as after 3 hr of reperfusion (). After 6 hr of reperfusion, a complete restoration of full-length E-cadherin was seen (). Although no fragmentation of N-cadherin was detected, N-cadherin was lost after 3 hr of ischemia, but 6 hr of reperfusion was associated with recovery of N-cadherin protein expression (). A co-immunoprecipitation strategy was also used to assess the cadherin/catenin complex. There was no co-immunoprecipitation of β-catenin with either E- or N-cadherin following 6 hr of ischemia (data not shown), which was consistent with the lack of protein expression at this timepoint of the cadherins. An antibody against β-catenin also did not pull down the intracellular E-cadherin fragment (data not shown), however, β-catenin remained associated with α -catenin following 6 hr of ischemia, although it was reduced as compared to control cells ().
Figure 2 Impact of ischemia on cadherin and catenin protein expression and function in NRK cells. Ischemia was induced in NRK cells by layering cells with PBS supplemented with 1.5-mM CaCl2 and 2-mM MgCl2 followed by mineral oil. (a) NRK cell lysates were prepared at the given times and westerns were performed as previously described. Similar results were seen in three replicate experiments. (b) NRK extracts were immunoprecipitated with a goat polyclonal β-catenin antibody, and the immunoprecipitates were probed with a rabbit polyclonal α -catenin antibody. Following detection, the blots were stripped and reprobed with a monoclonal antibody against β-catenin as a loading control. Similar results were seen in two separate experiments. (c)Morphology of control and ischemic NRK cells, assessed by phase-contrast microscopy. The width of each field is 1600μ m.
NRK cells viewed by phase-contrast microscopy revealed characteristic closely packed polygonal shaped cells with little light transmitted between them (). Following 6 hr of ischemia, cells exhibited a loss of cell-to-cell adhesion and increased transmission of light at cell-to-cell boundaries, although cells remained attached to the growing surface (), which was similar to that previously reported for disruption of cadherins (Prozialeck and Niewenhuis 1991; Prozialeck and Lamar 1997; Covington et al. Citation2005; Covington et al. 2006). Taken together, these results suggest that ischemia is associated with disruption of cadherin expression and function, an effect that is sustained during early (3 hr) of reperfusion, but not following prolonged recovery.
β-Catenin Signaling in Ischemic NRK Cells
We next examined the impact of ischemia/reperfusion on activation of β-catenin transcriptional activity. First, the phosphorylation of GSK-3β and β-catenin were assessed using phospho-specific antibodies. The phosopho-GSK-3α/β antibody recognizes GSK phosphorylated at Ser21 and Ser9, respectively, and GSK activity is inhibited by phosphorylation. Ischemia was associated with a decrease in GSK phosphorylation, without changes in total GSK levels (). This suggests enhanced GSK activity during ischemia; however, the phosphorylation of β-catenin, as assessed by an antibody that recognizes β-catenin phosphorylated at Thr41/Ser45 by GSK-3β, was not changed during ischemia (). A slight increase in both phospho-β-catenin and total β-catenin was seen during reperfusion.
Figure 3 Impact of ischemia/reperfusion on β-catenin signaling in NRK cells. (a) Ischemia was induced in NRK cells by layering cells with PBS supplemented with 1.5-mM CaCl2 and 2-mM MgCl2 followed by mineral oil. NRK cell lysates were prepared at the given times and Westerns were performed as previously described. Similar results were seen in three replicate experiments. The membranes were first probed with the phospho-specific antibodies, stripped and the reprobed with anti-GSK3β or β-catenin antibodies. NRK = control NRK cells incubated in growth medium; PBS = NRK cells incubated with PBS supplemented with Ca+ + and Mg+ + for 6 hr, but not with the mineral oil overlay to induce ischemia.(b) Ischemia was induced in NRK cells by layering cells with PBS supplemented with 1.5-mM CaCl2 and 2-mM MgCl2 followed by mineral oil for 6 hr; cells were reperfused for 3 hr. Cells were fixed in 2% paraformaldehyde, incubated with primary antibody (1:100) overnight at 4°C, with secondary antibody (1:200) 1 hr at room temperature, and detection was via immunofluorescence. Arrows indicate the presence of perinuclear β-catenin signal. The width of each field is 240 μ m; similar results were seen in four replicate experiments. (c) As a positive control, SW480 cells were stained for β-catenin using the same protocol; strong nuclear staining of β-catenin is seen in these cells. The image on the left is β-catenin staining; the image on the right is DAPI nuclear staining. (d) NRK cells transfected with the TOPFlash or FOPFlash reporter constructs were challenged by ischemia/reperfusion and harvested at the indicated time points for luciferase measurement. As a positive control, cells were challenged for 18 hr with 50-mM LiCl2. Results are presented as percentage of control (TOPFlash minus FOPFlash); each data point represents the mean ± SD of 9–12 dishes. (e) Quantiative PCR analysis of cyclin D1, c-myc, and c-jun gene expression in control, ischemic (6 hr) and ischemia–reperfusion (6 hr/3 hr) NRK cells; each data point represents the mean ± SD of 4 replicates.
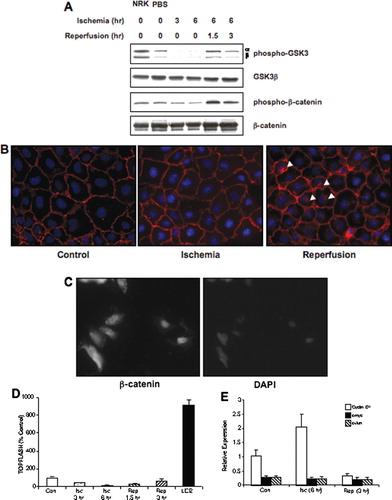
The localization of β-catenin was assessed as well. In control cells, a strong staining at the plasma membrane was seen, consistent with an intact and functional cadherin/catenin complex (). After 6 hr of ischemia, the staining pattern of β-catenin was not dramatically affected, i.e., a strong signal at the plasma membrane was seen, which was similar to our previous results (Covington et al. Citation2005; Covington et al. 2006). However, following 3 hr of reperfusion, β-catenin staining was seen at the plasma membrane, as well as a strong perinuclear signal. This suggested that ischemia/reperfusion injury was not associated with nuclear accumulation ofβ-catenin. The perinuclear β-catenin staining following ischemia/reperfusion was similar to the pattern observed when NRK cells were challenged with brefeldin A, an anti-viral agent which is also a protein trafficking inhibitor (data not shown). As a positive control for nuclear localization of β-catenin, SW480 cells that have constitutive nuclear staining of β-catenin (Hendriksen et al. Citation2005; Nath et al. Citation2005) were stained for β-catenin using the same protocol. As expected, these cells have strong nuclear staining of β-catenin () and suggest that the negative results seen in NRK cells following ischemia/reperfusion was not due to the lack of sensitivity of the immunofluorescence protocol.
The transcriptional activity of β-catenin was directly assessed using the TOPFlash reporter construct. Ischemia and reperfusion were not associated with an increase in reporter activity (). In order to determine if NRK cells were competent to activate the β-catenin transcriptional pathway, the cells were challenged with lithium chloride, a prototypical inducer of this pathway (reviewed in Kao and Elinson 1998). Sixteen hours of challenge with 50-mM lithium chloride induced a ten-fold increase in reporter activity, similar to the increase induced by the same concentration of lithium chloride after a 24 hr challenge in mouse proximal tubular cells (Sinha et al. 2005). This suggests that NRK cells possess a competent Wnt pathway; however, ischemia/reperfusion was not sufficient to stimulate the transcriptional activity of β-catenin. The expression of several genes regulated by β-catenin, including cyclin D1, c-myc, and c-jun, was also examined in control, ischemic (6 hr), and ischemia/reperfused (6 hr/3 hr) NRK cells. While there was a a trend toward increased cyclin D1 expression in ischemic cells (as compared to control), it was not significant (). In addition, there were no changes in the expression of c-myc and c-jun (()). These data further support the conclusion that ischemia-induced disruption of the cadherin/catenin complex is not sufficient for the transcriptional activation of β-catenin.
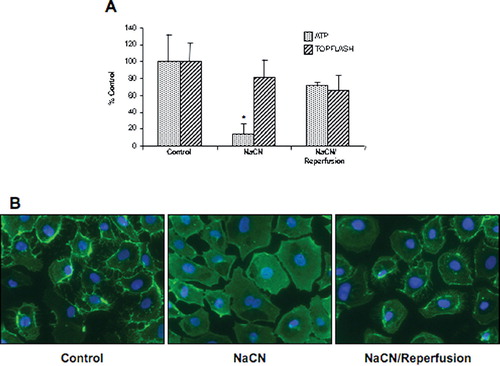
Price et al. (Citation2002) have shown that ATP depletion of opossum kidney cells was associated with nuclear translocation of β-catenin; however, a functional analysis of β-catenin transcriptional activity was not performed. Therefore, to determine if the lack of an effect of ischemia–reperfusion on β-catenin signaling was specific to the mineral oil model, we used a similar experimental protocol to deplete ATP in NRK cells. NRK cells were challenged for 70 min in glucose-free media with 10-mM NaCN and allowed to recover for 1 hr in normal growth media. Cellular ATP levels and TOPFlash activity was measured. Despite a similar decrease in ATP levels to that reported by Price et al. (Citation2002), no activation of β-catenin transcriptional activity was observed (), suggesting that ATP depletion was not capable of inducing β-catenin activity in NRK cells. This conclusion is supported by the finding that β-catenin staining is reduced at the cell membrane in NRK cells following sodium cyanide challenge, but is not localized to the nucleus in ATP-depleted or reperfused cells ().
Figure 4 Impact of chemical ischemia/reperfusion on ATP content and β-catenin signaling. (a) NRK cells were challenged with 10-mM NaCN in glucose-free media for 70 min, followed by reperfusion with normal growth media for 1hr. ATP content and β-catenin signaling (ratio of TOPFlash to FOPFlash) were assessed and the results presented as percentage of control for 9–12 dishes. (b) Cells were fixed in 2% paraformaldehyde, a monoclonal anti–β-catenin primary antibody (1:100) incubated overnight at 4°C with secondary antibody (1:200) incubated 1 hr at room temperature, and detection was via immunofluorescence. The width of each field is 240 μ m; similar results were seen in two replicate experiments.
DISCUSSION
We have adapted an in vitro ischemia model for use in renal cell lines from Meldrium et al. (2001). This model is associated with both disruption of cadherin protein expression and integrity of the cadherin/catenin complex, putatively via activation of MT1-MMP (Covington et al. Citation2005; Covington et al. 2006). An induction of hypoxia-inducible factor–1α (HIF-1α) expression was seen, consistent with previous results using TNF-α (Meldrum et al. Citation2001) and glucose transporter-1 expression (Covington et al. Citation2005) as markers of hypoxia. The decrease in ATP levels following 6 hr of ischemia in this study is similar to the 90% decrease seen in cells treated with sodium cyanide (Keller and Nigam Citation2003). Importantly, this model was not associated with significant loss of cell viability, as assessed by either total cell number, or neutral red uptake, during ischemia or reperfusion. After 6 hr of ischemia, a loss of E- and N-cadherin protein expression was observed, and this correlated with increased light transmission between adjacent cells, caused by reduced intercellular adhesion. These results are consistent with our previous results, which also demonstrated a decrease in cell aggregation following ischemia (Covington et al. Citation2005; Covington et al. 2006). Taken together, this suggests that the mineral oil overlay model is associated with decreased cadherin/catenin function in the absence of cell death.
Disruption of cadherin/catenin integrity may also be associated with activation of the transcriptional activity of β-catenin (reviewed in Willert and Nusse Citation1998). Ito et al. (Citation1999) demonstrated that a membrane-bound metalloprotease cleaved E-cadherin, and this was associated with accumulation of β-catenin in the cytoplasm. More recently, it has been shown that nitric oxide induces accumulation of cytosolic β-catenin and a nuclear complex of β-catenin and LEF-1 secondary to degradation of E-cadherin that was prevented MMP inhibitors (Mei et al. Citation2002). With respect to ischemic renal injury, ATP depletion with sodium cyanide is associated with translocation of β-catenin into the nucleus in opossum kidney cells (Price et al. Citation2002). In each of these studies, however, a direct assessment of the transcriptional activity of β-catenin was not performed. In contrast, ADAM10 has been shown to cleave E- and N-cadherin, resulting in nuclear localization of β-catenin, and an increase in TOPFlash reporter activity (Maretzky et al. Citation2005; Reiss et al. Citation2005).
In our model, while there was evidence for activation of GSK-3β, phosphorylation of β-catenin was not decreased, nor was there detectable nuclear staining of β-catenin. Most importantly, ischemia did not result in increased transcriptional activity of β-catenin, as assessed by the TOPFlash reporter construct or increased expression of the β-catenin–responsive genes cyclin D1, c-myc, or c-jun. The positive control, lithium chloride, induced a ten-fold increase in reporter activity, similarly to previous reports (Sinha et al. 2005), suggesting that the Wnt pathway was inducible in NRK cells. Our results are consistent with several studies suggesting that loss of cadherin function is not always associated with activation of β-catenin signaling (Caca et al. Citation1999; Vasioukhin et al. Citation2001). In an elegant study, Gottardi and Gumbiner (Citation2004) have shown that the balance between cadherin-mediated adhesion and Wnt signaling is not dictated by simple competition, but rather by the regulation of distinct forms of β-catenin. These data further suggest that the regulation of β-catenin transcriptional activity may not be as simple as dissociation from the cadherin/catenin complex. In conclusion, these results demonstrate that ischemia-induced disruption of the cadherin/catenin complex in NRK cells is not sufficient to activate the transcriptional activity of β-catenin, and that activation of β-catenin signaling following cadherin disruption is likely to be insult- and cell-specific.
These studies were supported by the Center for Environmental and Rural Health (CERH) (P30-ES09106).
REFERENCES
- Behrens J, Lustig B. The Wnt connection to tumorigenesis. Int J Dev Biol 2004; 48: 477–487
- Bonventre J V, Weinberg J M. Recent advances in the pathophysiology of ischemic acute renal failure. J Am Soc Nephrol 2003; 14: 2199–2210
- Bush K T, Tsukamoto T, Nigam S K. Selective degradation of E-cadherin and dissolution of E-cadherin-catenin complexes in epithelial ischemia. Am J Physiol Renal Physiol 2000; 278: F847–852
- Caca K, Kolligs F T, Ji X, Hayes M, Qian J, Yahanda A, Rimm D L, Costa J, Fearon E R. Beta- and gamma-catenin mutations, but not E-cadherin inactivation, underlie T-cell factor/lymphoid enhancer factor transcriptional deregulation in gastric and pancreatic cancer. Cell Growth Differ 1999; 10: 369–376
- Cadigan K M, Nusse R. Wnt signaling: A common theme in animal development. Genes Dev 1997; 11: 3286–3305
- Cho E A, Patterson L T, Brookhiser W T, Mah S, Kintner C, Dressler G R. Differential expression and function of cadherin-6 during renal epithelium development. Development 1998; 125: 803–812
- Citi S. The molecular organization of tight junctions. J Cell Biol 1993; 121: 485–489
- Covington M D, Bayless K J, Burghardt R C, Davis G E, Parrish A R. Ischemia-induced cleavage of cadherins in NRK cells: evidence for a role of metalloproteinases. Am J Physiol Renal Physiol 2005a; 289: F280–F288
- Covington M D, Burghardt R C, Parrish A R. Ischemia-induced cleavage of cadherins in NRK cells requires MT1-MMP (MMP-14). Am Journal Physiol Renal Physiol 2005b; 290: F43–F51
- Dahl U, Sjodin A, Larue L, Radice G L, Cajander S, Takeichi M, Kem Ler R, Semb H. Genetic dissection of cadherin function during nephrogenesis. Mol Cell Biol 2002; 22: 1474–1487
- Goodwin M, Yap A S. Classical cadherin adhesion molecules: coordinating cell adhesion, signaling and the cytoskeleton. J Mol Histol 2004; 35: 839–844
- Goto S, Yaoita E, Matsunami H, Kondo D, Yamamoto T, Kawasaki K, Arakawa M, Kihara I. Involvement of R-cadherin in the early stage of glomerulogenesis. J Am Soc Nephrol 1998; 9: 1234–1241
- Gottardi C J, Gumbiner B M. Distinct molecular forms of β-catenin are targeted to adhesive or transcriptional complexes. J Cell Biol 2004; 167: 339–349
- Grimes C A, Jope R S. The multifaceted roles of glycogen synthase kinase 3β in cellular signaling. Prog Neurobiol 2001; 65: 391–426
- Hendriksen J, Fagotto F, van der Velde H, van Schie M, Noordermeer J, Fornerod M. RanBP3 enhances nuclear export of active β-catenin independently of CRM1. J Cell Biol 2005; 171: 785–797
- Ito K, Okamoto I, Araki N, Kawano Y, Nakao M, Fujiyama S, Tomita K, Mimori T, Saya H. Calcium influx triggers the sequential proteolysis of extracellular and cytoplasmic domains of E-cadherin, leading to loss of β-catenin from cell-cell contacts. Oncogene 1999; 18: 7080–7090
- Kao K R, Elinson R P. The legacy of lithium effects on development. Biol Cell, 90: 585–589
- Karim R, Tse G, Putti T, Scolyer R, Lee S. The significance of the Wnt pathway in the pathology of human cancers. Pathology 2004; 36: 120–128
- Keller S H, Nigam S K. Biochemical processing of E-cadherin under cellular stress. Biochem Biophys Res Commun 2003; 307: 215–223
- Kwon O, Nelson W J, Sibley R, Huie P, Scandling J D, Dafoe D, Alfrey E, Myers B D. Backleak, tight junctions, and cell-cell adhesion in postischemic injury to the renal allograft. J Clin Invest 1998; 101: 2054–2064
- Liano F, Pascual J. Epidemiology of acute renal failure: A prospective, multicenter, community-based study. Madrid Acute Renal Failure Study Group. Kidney Int 1996; 50: 811–818
- Mandel L J, Doctor R B, Bacallao R. ATP depletion: a novel method to study junctional properties in epithelial tissues. II. Internalization of Na+,K(+)-ATPase and E-cadherin. J Cell Sci 1994; 107: 3315–3324, (Pt 12)
- Maretzky T, Reiss K, Ludwig A, Buchholz J, Scholz F, Proksch E, de Strooper B, Hartmann D, Saftig P. ADAM10 mediated E-cadherin shedding and regulates epithelial cell-cell adhesion, migration, and beta-catenin translocation. Proc Natl Acad Sci USA 2005; 102: 9182–9187
- Mei J M, Borchert G L, Donald S P, Phang J M. Matrix metalloproteinase(s) mediate(s) NO-induced dissociation of β-catenin from membrane bound E-cadherin and formation of nuclear β-catenin/LEF-1 complex. Carcinogenesis 2002; 23: 2119–2122
- Meldrum K K, Meldrum D R, Hile K L, Burnett A L, Harken A H. A novel model of ischemia in renal tubular cells which closely parallels in vivo injury. J Surg Res 2001; 99: 288–293
- Molitoris B A, Marrs J. The role of cell adhesion molecules in ischemic acute renal failure. Am J Med 1999; 106: 583–592
- Moran S M, Myers B D. Pathophysiology of protracted acute renal failure in man. J Clin Invest 1985; 76: 1440–1448
- Myers B D, Chui F, Hilberman M, Michaels A S. Transtubular leakage of glomerular filtrate in human acute renal failure. Am J Physiol 1979; 237: F319–F325
- Nath N, Kashfir K, Chen J, Rigas B. Nitric oxide-donating aspirin inhibits β-catenin/T cell factor (TCF) signaling in SW480 colon cancer cells by disrupting the nuclear β-catenin-TCF association. Biochem Biophys Res Commun 2005; 326: 93–99
- Nelson W J, Nusse R. Convergence of Wnt, β-catenin, and cadherin pathways. Science 2004; 303: 1483–1487
- Polakis P. Casein kinase 1: A wnt'er of disconnect. Curr Biol 2002; 12: R499–R501
- Price V R, Reed C A, Lieberthal W, Schwartz J H. ATP depletion of tubular cells causes dissociation of the zonula adherens and nuclear translocation of beta-catenin and LEF-1. J Am Soc Nephrol 2002; 13: 1152–1161
- Prozialeck W C, Lamar P C. Cadmium (Cd2+) disrupts E-cadherin-dependent cell-cell junctions in MDCK cells. In Vitro Cell Dev Biol Anim, 33: 516–526
- Prozialeck W C, Niewenhuis R J. Cadmium (Cd2+) disrupts intercellular junctions and actin filaments in LLC-PK1 cells. Toxicol Appl Pharmacol, 107: 81–97
- Raspotnig G, Fauler G, Jantscher A, Windischhofer W, Schachl K, Leis J F. Colorimetric determination of cell numbers by Janus green staining. Anal Biochem, 275: 74–83
- Reiss K, Maretzky T, Ludwig A, Tousseyn T, de Strooper B, Hartmann D, Saftig P. ADAM10 cleavage of N-cadherin and regulation of cell–cell adhesion and β-catenin nuclear signalling. EMBO J 2005; 24: 742–752
- Rossman T G, Goncharova E I, Rajah T, Wang Z. Human cells lack the inducible tolerance to arsenite seen in hamster cells. Mut Res 1997; 386: 307–314
- Shimazui T, Oosterwijk-Wakka J, Akaza H, Bringuier P P, Ruijter E, Debruyne F M, Schalken J A, Oosterwijk E. Alterations in expression of cadherin-6 and E-cadherin during kidney development and in renal cell carcinoma. Eur Urol 2000; 38: 331–338
- Simonneau L, Kitagawa M, Suzuki S, Thiery J P. Cadherin 11 expression marks the mesenchymal phenotype: towards new functions for cadherins?. Cell Adhes Commun 1995; 3: 115–130
- Sinha D, Wang Z, Ruchalski K L, Levine J S, Lieberthal W, Schwartz J H, Borkan S C. Lithium activates the Wnt and phosphatidylinositol 3-kinase Akt signaling pathways to promote cell survival in the absence of soluble survival factors. Am J Physiol Renal Physiol, in press
- Sutton T A, Mang H E, Campos S B, Sandoval R M, Yoder M C, Molitoris B A. Injury of the renal microvascular endothelium alters barrier function after ischemia. Am J Physiol Renal Physiol 2003; 285: F191–F198
- Van d e, Wetering M, Oosterwegel M, Dooijes D, Clevers H. Identification and cloning of TCF-1, a T lymphocyte-specific transcription factor containing a sequence-specific HMG box. EMBO J 1991; 10: 123–132
- Vasioukhin V, Bauer C, Degenstein L, Wise B, Fuchs E. Hyperproliferation and defects in epithelial polarity upon conditional ablation of alpha-catenin in skin. Cell 2001; 104: 605–617
- Willert K, Nusse R. Beta-catenin: a key mediator of Wnt signaling. Curr Opin Genet Dev 1998; 8: 95–102