Abstract
Although various methods for collagen gel–based cell invasion assays have been described, there continues to be a need for a simpler and more objective assay. Here, we describe an easy-to-prepare double-layered collagen gel hemisphere (DL-CGH) system that satisfies these requirements, and we demonstrate the advantages of this new system for visualizing cell movements during invasion. DL-CGH consists of a central core collagen layer surrounded by an outer cover collagen layer. A droplet of collagen I solution (containing cells to be examined) naturally forms a small hemisphere on the bottom of the culture dish. After this central core layer gels, a second droplet is placed atop the first gel, encapsulating it completely. The hemisphere is submerged in the medium and cultured. The invasive activity of cells that infiltrate from the inner to the outer layer can be evaluated optically. Using this in vitro system, we measured the inhibitory effect of E-cadherin expression on cancer cell invasion. DL-CGH also allowed visualization of interactions between invading cancer cells and the stroma. Cancer cells, which lack the proteases required for direct entrance into the three-dimensional collagen matrix, were seen to slip like amoebas through matrix gaps generated by the pericellular proteolytic activity of fibroblasts. [Supplementary materials are available for this article. Go to the publisher's online edition of Cell Communication and Adhesion for the following free supplemental resources: Movies 1–3; 4a and b].
INTRODUCTION
In multi-cellular systems, cell migration is a vital event in various physiological and pathological processes. The migratory activity of cancer cells is essential for their malignant phenotype, allowing cancer-cell translocation and cancer progression. Understanding the mechanisms of cancer-cell invasion and its control is an essential step toward the development of new therapeutic strategies against cancer.
Observation of migrating cells in living tissue is the ideal method for studying cell migration, since cell behavior is depicted directly. However, examining the activity of specific molecules in this context can be challenging, due to limitations such as the complexity of sustaining and observing cells within living tissues (which require the function of numerous physiologically activated substances). Methods for tracking a cell moving within living tissue over a long period of time also are limited. To bypass these limitations, in vitro systems have been employed in the study of cell movement. Although most in vitroinvestigations utilize the simplicity of 2-dimensional (2-D) models, 3-dimensional (3-D) systems are more suitable for simulation of a natural cell environment. Relative to analogous motility assays in 2-D model systems (Beningo et al. Citation2004; Suetsugu et al. Citation2003; Cukierman et al. Citation2001), some findings from 3-D assays have shown different and more plausible results. For this reason, the use of 3-D models to investigate cell migration is increasing (Even-Ram and Yamada Citation2005).
Collagen gel is the most common model substrate for in vitro 3-D studies of cell invasion. Although various methods for collagen gel-based cell invasion assays have been described (Albini et al. Citation1987; Nystrom et al. Citation2005; Demou Citation2002; Werbowetski et al. Citation2004; Duong et al. Citation2005), there continues to be a need for a simpler and more objective assay that allows investigations of cell migration kinetics, as well as consecutive and prolonged observations of living cells. Here, we describe an easy-to-prepare system that satisfies these requirements, and we demonstrate the advantages of this new system for visualizing and quantifying cell kinetics during invasion. This report is also the first to demonstrate visually comprehensible findings of the tumor–host interface microenvironment.
Materials and Methods
Cell Lines
PC-3 (lung adenocarcinoma, moderately differentiated, http://www.jhsf.or.jp/bank/Category-Index.htmL) and A549 (bronchiolo-alveolar carcinoma of the lung) cell lines were obtained from the Health Science Research Resources Bank (Osaka, Japan); the WI-38 cell line was obtained from the RIKEN Bioresource Center (Tsukuba, Japan). Cells were maintained in RPMI-1640 medium supplemented with penicillin (100 U/mL), streptomycin (100 U/mL), and 10% bovine calf serum.
Preparation of Double-Layered Collagen Gel Hemispheres
Acid-soluble collagen I (Nitta Gelatin Inc., Osaka, Japan), ten-fold concentrated Ham's F-12 medium, and reconstruction buffer (2.2 g NaHCO3 and 4.77 g HEPES in 100 mL of 0.05-N NaOH) were mixed at a volume ratio of 8:1:1 and then seeded with cultured cells at a density of 3.0 × 10⁶ cells/mL. Five microliters of the mixture, containing 1.5 × 10⁴ cells, were dropped onto a plastic dish. Once the mixture had gelled, a second 30-μ L drop of collagen was placed exactly on the top of the first gel drop, encapsulating it completely. The gel hemisphere was then submerged in medium and cultured. For observing interactions between two different cell types, 7.5 × 10³ cells of each type were mixed in the first gel layer. Cells were then stained with neutral red and the gel was allowed to dry. The invasive activity of the cells was evaluated by measuring the expansion of red stain into the outer collagen layer.
Numerical Conversion of the Invasive Activity of the Cells
Cell invasive activity was quantified by measuring the area of red staining within each double-layered collagen gel hemisphere (DL-CGH). Specifically, images of stained and dried samples were captured as 800 pixel × 600 pixel JPEG files using a digital camera and attached software (DXM1200 and ACT-1, Nikon Corp., Kawasaki, Japan). For accurate comparison, all images were captured under the same conditions. Using Photoshop Elements 2.0 for Windows (Adobe Systems Inc., San Jose, CA), the stained areas in each image were selected manually using the “magic wand tool” with a “tolerance” (found in the option bar) set to 65. The “histogram” selection in the pull-down menu then indicated the number of pixels encompassed in the selected areas. For each image, a constant inner-layer area (determined to be 4.5 kilopixels) was subtracted from each selected area of red staining to yield the area of invasion into the outer layer.
Time-Lapse Motion Picture
A Moticam 2000 digital microscopy system (Shimadzu Rika Corp., Tokyo, Japan) was used to create motion pictures of cell invasion. The camera head was set at the position of the eyepiece on an inverted microscope (CKX31; Olympus Corp., Tokyo, Japan) and the entire microscope was then installed in a 37°C, 5% CO2 incubator without humidity (to prevent dew formation in the instruments). A DL-CGH prepared in one well of an ordinary six-well plastic culture plate was submerged in proper medium; the residual five wells were filled with water to maintain humidity inside the plate. Cells were observed microscopically using a 10× objective lens, and the camera was operated from a personal computer running Moticam 2000 software to capture and display images of living cells. Recording initiated 24 hours after DL-CGH culture and continued for 96 hours. Images were captured automatically every 20 minutes, with 288 consecutive images stored as 800 pixel × 600 pixel JPEG files. Using Windows Movie Maker software (Microsoft Corp., Redmond, WA), we created a 30-second movie (saved as a WMV file) that displayed 288 consecutive images of 0.125 seconds each.
Inhibition of Matrix Metalloproteinases
N-[(2R)-2-(hydroxamidocarbonylmethyl)-4-methylpentanoyl]-L-tryptophan methylamide, a matrix metalloproteinase (MMP) inhibitor (MMPi) (Calbiochem, Merck Biosciences Ltd., Beeston, U.K.), was mixed in the collagen gel medium at a concentration of 0.5 μ M–5 μ M with 1.5 × 10⁴ of PC-3 cells.N-t-butoxycarbonyl-l-leucyl-l-tryptophan methylamide Calbiochem) was substituted for the inhibitor as a negative control. After seven days of culture, viable cells in the gel hemispheres were stained with neutral red.
CD44 and E-Cadherin RNA Interference in PC-3 Cells
RNA interference (RNAi) was performed with commercially available siRNAs (HP-validated siRNA for CD44 and E-cadherin; Qiagen GmbH, Hilden, Germany) and a non-silencing control siRNA (target sequence; AAT TCT CCG AAC GTG TCA CGT, Qiagen GmbH) according to manufacturer's instructions. Briefly, 24 μ L of transfection reagent (Hiperfect; Qiagen GmbH) was suspended in 200 μ L of serum-free culture medium containing 6-μ g siRNA. After a 10-min incubation at room temperature, the mixture was added to a PC-3 culture (60mm tissue culture dish with 4 mL culture medium containing 10% fetal bovine serum and antibiotics mentioned above) grown to 60% confluence; the final concentration of the siRNA was 100 nM. After 24 hours (at 37°C, 5% CO2), PC-3 cells were suspended in phosphate buffered saline (PBS) and cell density was calculated to prepare for encapsulation of the cells in DL-CGH.
Labeling of A549 with Green Fluorescent Protein (GFP)
A549 cells were transfected with pAcGFP1-Actin (Clontech Laboratories Inc. Mountain View, CA) using TransIT®-LT1 transfection reagent (Mirus Bio Corporation, Madison, WI). Following the manufacturer's protocol, 2.5μ g of plasmid DNA was added to the reagent and the mixture was then applied to a cell monolayer in a 35-mm dish. Twenty-four hours later, the cells were resuspended in the medium and cell density was calculated.
Time-Lapse Merged Neutral and Fluorescent Images
A Z8000 fluorescence microscope (Kyence Corp., Tokyo, Japan) with CO2 incubating chamber was used to generate neutral and fluorescent microscopic images. A DL-CGH prepared on a 30-mm-round plastic dish with proper medium was mounted on the microscope-table incubation chamber, and a 10× objective image was displayed on the monitor. Recording started at 24 hours after culture initiation and continued for 96 hours. Neutral and fluorescent images, captured in rapid succession every 20 minutes, were merged and the resulting images were stored as 800 pixel × 600 pixel JPEG files. Similarly to the procedure described above, we created a movie (saved as a WMV file) that displayed 288 consecutive neutral and fluorescent merged images for 0.125seconds each.
Statistical Analysis
Statistical significance was determined by unpaired Student's t-test. All tests were performed with SPSS 14.0 statistical software (SPSS Japan Inc., Tokyo, Japan).
Results
Cell Invasion Assays Using Double-Layered Collagen Gel Hemispheres (DL-CGH)
Double-layered hemispheres of collagen gel that included PC-3 or A549 cells in the center-core layer were prepared on the bottom of cell culture dishes as described in Materials and Methods (). The hemispheres were submerged in standard medium and cultured for seven days. After staining cells with neutral red and allowing the gel to dry, we measured cell invasive activity by the expansion of the red stain into the outer layer of collagen gel (; Movies 1 and 2). After seven days of culture, PC-3 lung adenocarcinoma cells spread widely into the outer layer (94,457 pixels in the outer layer), whereas A549 bronchiolo-alveolar carcinoma (BAC) cells showed only minimal infiltration into the outer layer (5,273 pixels). To confirm that the infiltration of stain into the outer layer was due to invasive cells, PC-3 cells were treated either with an MMPi (N-[(2R)-2- (hydroxamidocarbonylmethyl)-4-methylpentanoyl]-l-tryptophan methylamide), or N-t-butoxycarbonyl-l-leucyl-l-tryptophan methylamide, an inactive chemical control. Monolayer PC-3 cell cultures were used preliminarily to confirm that the MMPi did not affect cell division activity (data not shown). As increasing concentrations of the MMPi were added to PC-3 cells cultured in DL-CGH, corresponding decreases in expansion into the outer layer were observed: 16.9% in 5-nM, 56.6% in 50-nM, 72.5% in 500-nM, and 92.7% in 5-μ M MMPi, respectively ().
Figure 1 Schematic of the structure of double-layered, collagen gel hemispheres.
Figure 2 Distributions of cells after seven days of culture in DL-CGH. (a) and (d) Inverted microscope images of the bottoms of the gel hemispheres before drying (magnification 5.0×). (b) and (e) After drying, gels were captured in 800 pixel × 600 pixel JPEG files with a 1.5× magnification lens. (c) and (f) The outline of red staining was traced (with a blue line) and number of pixels within this perimeter was counted. The area of the inner layer (4.5 × 104 pixels, yellow circle) was subtracted to calculate area of expansion into the outer layer. While (c) PC-3 cells expanded into 94,957 pixels in the outer layer, (f) A549 invaded an area of only 5,273 pixels.
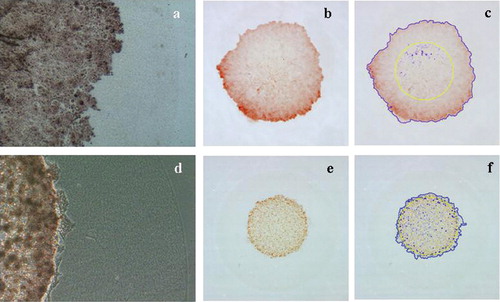
Figure 3 Treatment with an MMP inhibitor (MMPi). Cells treated withN-[(2R)-2-(hydroxamidocarbonylmethyl)-4-methyl pentanoyl]- l-tryptophan methylamide (0.005–5.0 μ M) showed a dose-dependent reduction in PC-3 cell invasion (from 16.9% less staining in 5-nM MMPi, relative to the control, to 92.7% less staining in 5-μ M MMPi), whereas control-treated cells showed no suppression of invasion.
![Figure 3 Treatment with an MMP inhibitor (MMPi). Cells treated withN-[(2R)-2-(hydroxamidocarbonylmethyl)-4-methyl pentanoyl]- l-tryptophan methylamide (0.005–5.0 μ M) showed a dose-dependent reduction in PC-3 cell invasion (from 16.9% less staining in 5-nM MMPi, relative to the control, to 92.7% less staining in 5-μ M MMPi), whereas control-treated cells showed no suppression of invasion.](/cms/asset/bb336508-5fb8-45ca-b74a-6e0f7675deb5/icac_a_255643_uf0003_b.gif)
Effect of RNAi-Mediated Knockdown of Cell Adhesion Molecules on the Invasive Activity of Cancer Cells
Dysfunctions in inter-cellular adhesion molecules have been observed during the progression of cancer (Cavallaro and Christofori Citation2004). Reductions in E-cadherin expression have been shown to occur in a variety of malignancies, correlating closely with tumor invasion and metastasis (Conacci-Sorrell et al. Citation2002). Expression of the cell surface receptor CD44, which is required for tumor metastasis (Weber et al. Citation2002), is also important in cancer cell adhesion and invasion (Bajorath Citation2001).
We used DL-CHGs to test whether these cell adhesion molecules function in cell invasion in vitro. Specifically, PC-3 cells were transfected with inhibitory RNAs that specifically reduce the expression of E-cadherin and CD44. Cultured cell monolayers were exposed to a mixture of E-cadherin and CD44 siRNAs in transfection reagent for 24 hr, after which the medium was washed out. After four days of incubation in standard medium, the cells were harvested and lysed by boiling in Laemmli sample buffer. Soluble proteins were resolved by SDS-PAGE and analyzed by Western blotting with anti–E-cadherin or anti-CD44 antibodies. The blots showed a 50% reduction in steady-state levels of E-cadherin and CD44 proteins relative to untreated cells or cells transfected with control siRNAs (data not shown).
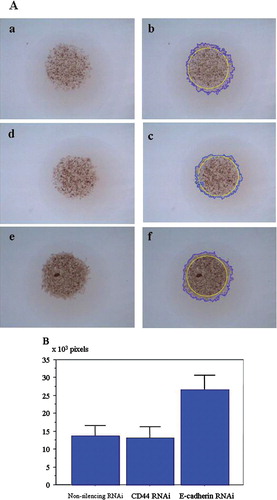
Similarly, cells transfected for 24 hr with inhibitory RNAs were embedded within the inner layer of DL-CGH and incubated for four days, after which invasive activity (represented by the area of red staining in outer layer) was measured ( (a–f)). For each treatment group, the mean and standard deviation (SD) in numbers of red-stained pixels among six samples were calculated. While the number of pixels in the control group (mean, 13,625; SD, 2,826) and in cells transfected with CD44 RNAi (mean, 13,113; SD, 3,186) did not differ significantly, cells transfected with E-cadherin–RNAi showed a significant increase in the area of staining (mean, 26,593; SD, 4,076) relative to the control or CD44 RNAi–transfected cells (p < 0.0001 by Student's t-test). Thus, although both CD44 and E-cadherin siRNAs were capable of reducing steady-state levels of encoded proteins, only cells transfected with E-cadherin siRNA demonstrated enhanced invasive activity. These findings are consistent with clinical reports that describe the relationship between reductions in E-cadherin expression in cancer cells and cancer spreading (Shibanuma et al. Citation1998; Kimura et al. Citation2000; Lim et al. Citation2000; Liu et al. Citation2001; Bremnes et al. Citation2002).
Figure 4 Effect of down-regulation of cell adhesion molecules on the invasion activity of cancer cells. Cells transfected with inhibitory RNAs for 24 hours were embedded in the inner layer of DL-CGH and incubated for four days. Invasive activity was quantified by measuring increases in the area of red staining. (A) The cells were treated with (a) and (b) non-silencing siRNA, (c) and (d) siRNA against CD44, (e) and (f) siRNA against E-cadherin. (b), (d), and (f) The fringed outer border of red stain was marked using digital imaging software (blue line), then the area of inner layer (4.5 × 104 pixels, yellow circle) was subtracted to calculate the expanded area in outer layer. The numbers of pixels in each area were counted. (B) The histogram depicts the mean and standard deviation of numbers of red-stained pixels of outer layer in six samples for each condition. The pixel numbers of staining area expanded into outer layer were 13,625 +/– 2,826 in control, 13,113 +/– 3,186 in CD44-RNAi, and 26,593 +/− 4,076 in E-cadherin-RNAi. There were significant differences between non-silencing and E-cadherin RNAi, as well as between CD44-RNAi and E-cadherin-RNAi (p < 0.0001 by Student's t-test).
Monitoring Cancer–Stromal Cell Interactions During Invasion
After mixing two cell types (A549 BAC cells and WI-38 lung fibroblast cells) in the inner layer of gel hemispheres, cells were cultured normally and their behavior was monitored continuously with inverted microscopy. Fibroblasts were seen to migrate through the outer collagen gel, and the cancer cells followed the migration paths of the fibroblasts (; Movie 3). When A549 were cultured in the inner layer of a DL-CG hemisphere with WI-38 fibroblasts in the outer layer, the cancer cells were seen to penetrate the outer layer exclusively at sites with established networks of fibroblasts (; Movie 4 (a)). The kinetics of A549 cells were more clearly observed in images of GFP-labeled cells. Time-lapse presentation of merged neutral and fluorescent images showed fluorescent A549 cells changing their shapes in manner like that of amoebae and slipping rapidly along the surfaces of fibroblasts. Over 12 hours, labeled cells moved approximately 50 μ m along the surface of fibroblasts. (; Movie 4). These images demonstrate clearly that BAC cells, which are unable to infiltrate the outer layer alone (), do invade opportunistically along the paths of infiltrating fibroblasts.
Figure 5 (a) and (b) Mixed cultures of A549 and WI-38, with WI-38 spreading widely into the outer layer of the collagen gel, and cancer cells following the fibroblast tracks. (c) and (d) A549 and WI-38 cells embedded separately in the inner and outer layers, respectively. Cancer cells only dispersed to the outer layer along fibroblast networks. (a) and (c) Images of the bottoms of gel hemispheres, captured by inversion microscopy before drying (5.0× magnification). (b) and (d) 1.5× magnified images after the drops had dried, when cell infiltration into the outer layer was assessed.
Figure 6 Images of a DL-CGH that included 0.75 × 10⁴ A549 cells (20% expressing GFP-β ctin) in the inner layer and 0.75 × 10⁴ WI-38 cells in the outer layer. Neutral and fluorescent images were captured separately and then merged. In 12 hours, labeled cells (marked with arrows) moved approximately 50 μ m along the surface of fibroblasts. (a) Image of cells after 80 hours of culture. (b) A second image of the same cells after 92 hours of culture. In time-lapse movies, the A549 cells appear to slip along the surfaces of fibroblasts.
Discussion
Many original methods have been invented for quantitative analysis of cell invasion activity. A Matrigel®-based cell filtration assay in a Boyden chamber was the first successful method and is still used for quantification of cell invasion (Albini et al. Citation1987). Organotypic culture, in which multi-layered collagen gels are arranged horizontally in plates, was developed as a model of skin cancer invasiveness (Nystrom et al. Citation2005). Although invasive activity can be assessed objectively, observing the process of cell infiltration is difficult using these methods. Images that depict cell motion in a 3-D environment supply more detailed and informative results about the process of cell migration. Demou and McIntire (Citation2002) developed a 3-D cell tracking system and reported on dynamic processes of cell migration. Using a system in which an aggregated-cell spheroid was grown in a hanging drop and then implanted into collagen type I gel, Del Werbowetski et al. (Citation2004) recorded cell invasion using time-lapse video microscopy. For direct microscopic observation, Duong et al. (Citation2005) also established a novel 3-D cell invasion model in which cells were embedded in a 2-mm-thick collagen gel held between two glass plates.
DL-CGH, which extends many of the concepts established in the systems mentioned above, maintains an advantage in its simplicity. Firstly, it is very easy to prepare, requiring only two droplets of collagen gel on the bottom of a common culture dish. Secondly, cell invasion in a 3-D environment is observable clearly using a regular inverted microscope focused to the bottom plane of the gel hemisphere. Finally, invasion activity can be quantified simply and precisely by measuring changes in the area of cell occupancy. The significant increase in cell invasiveness observed in DL-CGH containing cells transfected with E-cadherin siRNA provide in vitro data that agrees with clinical reports demonstrating a correlation between down-regulated E-cadherin expression and increased cancer cell invasiveness and metastasis.
The simplicity of DL-CGH suggests that it may be applicable to high-throughput cell invasion assays. Preparation of hemispheres embedded with a particular cell line in each well of multi-well plates would allow a large number of identical gel hemispheres to be cultured identically and simultaneously. This format would permit testing of a variety of treatments to the media of neighboring wells, as well as provide a quantifiable assessment of cell invasion activity that is highly reproducible and comparable between samples. Using DL-CGH, it would be feasible to conduct large-scale RNAi experiments to screen for genes that function as molecular targets against cancer infiltration.
Clinical studies report a good prognosis for patients with small-sized bronchiolo-alveolar carcinoma (BAC) of the lung in which cancer cells spread on the internal surface of alveoli, but do not infiltrate interstitially. In contrast, the prognosis of patients with BAC containing actively proliferating fibroblasts is poor, with cancer cells invading frequently into micro-vessels (Noguchi et al. Citation1995). Tokunou et al. (Citation2001) have reported the importance of cancer–stroma communication for the development of the invasive component of BAC. Kanomata et al. (Citation2005) reported that stromal fibroblast-type cells, active in the earliest invasive events in BAC, are an important source of MMPs. Results from in vitroexperiments in this study, which show that A549 BAC cells depend on the presence of fibroblasts for invasive migration, are consistent with these clinical studies of BAC.
Cells such as A549 cells, which move aggressively like amoebae in a 2-D environment, cannot always move freely in a 3-D environment. The observation that A549 cells embedded together with fibroblasts in 3-D gel hemispheres recovered mobility demonstrates clearly that some types of cancer cells require stromal cells for invasion. Wolf et al. (Citation2003) have reported that protease-independent cell migration, in which cells slip through matrix gaps, is a result of flexible amoeba-like changes in cell shape. A549 cells are capable of this type of migration, moving along matrix gaps generated by the peri-cellular proteolytic activity of fibroblasts. The clinical behavior of BAC cells, which move and spread on the internal surface of alveoli in the absence of proliferating fibroblasts, also supports the hypothesis of the capability of these cells for amoeboid migration. In our experiments, changes in the shape of GFP-expressing A549 cells were observed clearly and verify that cell shape does change during amoeba-like movement involving the cytoskeleton.
Finally, molecular cross-talk at tumor–host tissue interfaces has been reported to be critical for cell migration at the invasion front (Liotta and Kohn Citation2001). Further investigations into intercellular communication should help clarify the molecular mechanisms of cancer invasion at work of the tumor–host interface. Application of DL-CGH in these future studies should allow better visualization and an improved understanding of the molecular dynamics of cell motility.
In conclusion, DL-CGH is a simple and precise in vitro 3-D assay for studying cancer invasion. Further applications of the technique have the potential to lead to a high-throughput system for investigating new anti-cancer drugs. With DL-CGH, the tumor–host interface microenvironment is accurately simulated, allowing image capture and investigation of amoeboid migration of cancer cells and their dependence on interactions with stroma. We believe that this new model system is a powerful tool for investigating cell communications in a 3-D environment.
Supplementary movies are available on the Cell Communication and Adhesion website.
Movies. All fivemovies are composed of invertedmicroscopic images. Recording, which began 24 hours after culture initiation, was continued for 96 hours. The play time has been compressed to approximately 30 seconds. The inner layer is positioned on the left side of the images.
Movie 1. 1.5 × 10⁴ PC-3 cells in the inner layer. The cells are invading aggressively into the outer layer.
Movie 2. 1.5 × 10⁴ A549 cells were embedded in the inner layer. The cells show no signs of migration and remain in their original positions.
Movie 3. 7.5 × 10³ A549 cells and 7.5 × 10³ WI- 38 cellswere embedded in the inner layer. The cancer cells follow in the tracks of fibroblasts migrating through the outer collagen gel.
Movie 4. 7.5 × 10³ A549 cells (20% expressing GFP-βctin) embedded in the inner layer and 7.5 × 10³ WI-38 cells embedded in the outer layer. (a) Phase-contrast images. Cancer cells appear to move along the surfaces of fibroblasts. (b) Merged phase-contrast and fluorescent images. A549 cells with GFP fluorescence change shapes like amoebae, slipped along the surfaces of fibroblasts in the outer layer.
REFERENCES
- Albini A, Iwamoto Y, Kleinman H K, Martin G R, Aaronson S A, Kozlowski J M, McEwan R N. A rapid in vitro assay for quantitating the invasive potential of tumor cells. Cancer Res 1987; 47: 3239–3245
- Bajorath J. Structure and function of CD44: characteristic molecular features and analysis of the hyaluronan binding site. Results Probl Cell Differ 2001; 33: 85–103
- Beningo K A, Dembo M, Wang Y. Responses of fibroblasts to anchorage of dorsal extracellular matrix receptors. Proc Natl Acad Sci 2004; 101: 18024–18029
- Bremnes R M, Veve R, Gabrielson E, Hirsch F R, Baron A, Bemis L, Gemmill R M, Drabkin H A, Franklin W A. High-throughput tissue microarray analysis used to evaluate biology and prognostic significance of the E-cadherin pathway in non-small-cell lung cancer. J Clin Oncol 2002; 20: 2417–2428
- Cavallaro U, Christofori G. Cell adhesion and signalling by cadherins and Ig-CAMs in cancer. Nat Rev Cancer 2004; 4: 118–132
- Conacci-Sorrell M, Zhurinsky J, Ben-Ze'ev A. The cadherin-catenin adhesion system in signaling and cancer. J Clin Invest 2002; 109: 987–991
- Cukierman E, Pankov R, Stevens D R, Yamada K M. Taking cell-matrix adhesions to the third dimension. Science 2001; 294: 1708–1712
- Demou Z N, McIntire L V. Fully Automated Three-Dimensional Tracking of Cancer Cells in Collagen Gels: Determination of Motility Phenotypes at the Cellular Level. Cancer Res 2002; 62: 5301–5307
- Duong H S, Le A D, Zhang Q, Messadi D V. A novel 3-dimensional culture system as an in vitro model for studying oral cancer cell invasion. Int J Exp Pathol 2005; 86: 365–374
- Even-Ram S, Yamada K M. Cell migration in 3-D matrix. Curr Opin Cell Biol 2005; 17: 524–532
- Kanomata N, Nakahara R, Oda T, Aoyagi Y, Ishii G, Yokose T, Hasebe T, Nagai K, Yokozaki H, Ochiai A. Expression and localization of mRNAs for matrix metalloproteinases and their inhibitors in mixed bronchioloalveolar carcinomas with invasive components. Mod Pathol 2005; 18: 828–837
- Kimura K, Endo Y, Yonemura Y, Heizmann C W, Schafer B W, Watanabe Y, Sasaki T. Clinical significance of S100A4 and E-cadherin-related adhesion molecules in non-small cell lung cancer. Int J Oncol 2000; 16: 1125–1131
- Lim S C, Jang I G, Kim Y C, Park K O. The role of E-cadherin expression in non-small cell lung cancer. J Korean Med Sci 2000; 15: 501–506
- Liotta L A, Kohn E C. The microenvironment of the tumour-host interface. Nature 2001; 411: 375–379
- Liu D, Huang C, Kameyama K, Hayashi E, Yamauchi A, Kobayashi S, Yokomise H. E-cadherin expression associated with differentiation and prognosis in patients with non-small cell lung cancer. Ann Thorac Surg 2001; 71: 949–954
- Noguchi M, Morikawa A, Kawasak M, Matsuno Y, Yamada T, Hirohashi S, Kondo H, Shimosato Y. Small adenocarcinoma of the lung. Histologic characteristics and prognosis. Cancer 1995; 75: 2844–2852
- Nystrom M L, Thomas G J, Stone M, Mackenzie I C, Hart J F, Marshall J F. Development of a quantitative method to analyse tumour cell invasion in organotypic culture. J Pathol 2005; 205: 468–475
- Shibanuma H, Hirano T, Tsuji K, Wu Q, Shrestha B, Konaka C, Ebihara Y, Kato H. Influence of E-cadherin dysfunction upon local invasion and metastasis in non-small cell lung cancer. Lung Cancer 1998; 22: 85–95
- Suetsugu S, Yamazaki D, Kurisu S, Takenawa T. Differential roles of WAVE1 and WAVE2 in dorsal and peripheral ruffle formation for fibroblast cell migration. Dev Cell 2003; 5: 595–609
- Tokunou M, Niki T, Eguchi K, Iba S, Tsuda H, Yamada T, Matsuno Y, Kondo H, Saitoh Y, Imamura H, Hirohashi S. c-MET expression in myofibroblasts: role in autocrine activation and prognostic significance in lung adenocarcinoma. Am J Pathol 2001; 158: 1451–1463
- Weber G F, Bronson R T, Ilagan J, Cantor H, Schmits R, Mak T W. Absence of the CD44 gene prevents sarcoma metastasis. Cancer 2002; 62: 2281–2286
- Werbowetski T, Bjerkvig R, Del Maestro R F. Evidence for a secreted chemorepellent that directs glioma cell invasion. J Neurobiol 2004; 60: 71–88
- Wolf K, Mazo I, Leung H, Engelke K, von Andrian U H, Deryugina E I, Strongin A Y, Brocker E B, Friedl P. Compensation mechanism in tumor cell migration: mesenchymal-amoeboid transition after blocking of pericellular proteolysis. J Cell Biol 2003; 160: 267–277