Abstract
Previous findings of widespread transcriptomic alteration in tissues from connexin null mice raise the issue of whether the transcriptomic changes are directly due to connexin down-regulation or to “compensatory” developmental alterations for the missing gene. To start addressing this question, the authors compared with wild-type control the gene expression profiles of connexin43 (Cx43) knockout and Cx43siRNA knockdown wild-type cortical astrocytes. Array analysis revealed remarkable parallelism of transcriptomic changes in knockout and knockdown astrocytes, with similarly altered genes being located on all chromosomes and encoding proteins involved in a wide diversity of cell functions. Moreover, gene expression variability was analogously higher in Cx43 null and siRNA-treated astrocytes, and expression interlinkages were similarly altered among a selected subset of genes. This highly significant overlap between transcriptomic alterations in Cx43 knockout and knockdown astrocytes suggests that the widespread changes more likely reflect connexin-dependent Gene Regulatory Networks rather than developmental compensation for the missing gene.
INTRODUCTION
Our previous studies on cortical astrocytes (Iacobas et al. Citation2003a, Citation2004, Citation2007c), brain (Iacobas et al. Citation2003b, Citation2005b, Citation2007b), and heart (Iacobas et al. Citation2003c, Citation2005a, Citation2005c; Kardami et al. Citation2007) of various connexin (Cx) null mice have revealed significant alterations of expression level, control, and coordination of a very large number of genes compared to wild-type littermates. The regulated genes are found on all chromosomes, and their protein products are involved in numerous biological processes, being located in all cellular compartments and performing a wide diversity of molecular and physiological functions. These results suggest the possibility that some of the phenotype changes in the connexin null animals may not only be attributable to altered intercellular communication that gap junction channels ordinarily provide, but also to altered expression of interlinked genes with very different biological functions (Iacobas et al. Citation2007a; Spray and Iacobas Citation2007).
The question often arises, however, of the degree to which “compensation” occurs in knockouts (Insel and Patel, Citation2007), such that gene regulation depends on pathways altered to make up for the missing gene rather than reflecting normal gene expression interlinkage. As an initial approach to explore this question in the Cx43 null setting, we have compared transcriptomic alterations with respect to wild-type cortical astrocytes (hereafter denoted by WT) in Cx43 null astrocytes (KO) and WT astrocytes acutely treated (48 h) with Cx43 siRNA (SI). Our findings indicate significantly similar transcriptional changes in Cx43 KO astrocytes and those treated acutely with siRNA, from which we infer that such changes may play important roles both in disorders related to hereditary connexin deficiency (for reviews see Gerido and White 2004; Harris Citation2007; Willecke et al. Citation2002) and in pathological settings in which connexin expression is acutely, chronically, or intermittently altered, such as myocardial infarction (for reviews see Fishman Citation2005; Severs et al. Citation2006) and multiple sclerosis (Brand-Schieber et al. Citation2005; Roscoe et al. Citation2007).
METHODS
Cells
Cell Cultures
At the embryonic day 19 (E19) stage of pregnancy, cesarean sections (C-sections) were performed on Cx43+/− C57Bl/6j mothers and brains from each pup (4 Cx43 KO, 10 WT; genotypes determined by polymerase chain reaction (PCR) of tail DNA; Dermietzel et al. Citation2000) separately minced in 500 μ l of 0.05% trypsin-EDTA, transferred to 1.5 ml Eppendorf tubes containing 500 μ l culture medium (Dulbecco's modified Eagle's medium supplemented with 10% fetal bovine serum, 1% penicillin-streptomycin, and spun down at 2000 rpm for 10 min. Pellet was then resuspended in culture medium and the cells were plated in 100-mm culture dishes and maintained in a humidified 5% CO2 incubator at 37°C.
Cx43 siRNA Treatment
Astrocytes from four WT mice were separately transfected with 20 μ g of Cx43siRNACT2 construct diluted in 1.5 ml of Opti-mem. The next day, transfection medium was replaced by regular growth medium. Forty-eight hours post transfection each sample of SI astrocytes was split in two parts; the protein was collected from 10% of the total number of cells to be tested for gene silencing efficiency using Western blots and the total RNA was collected from the rest for the microarray analysis. Finally, we selected six dishes containing WT, four KO, and four SI, astrocytes from as many E19 mice to be further analyzed. For these studies, we used the Cx43 siRNA sequence CAATTCCTCCTGCCGCAAT that targets the carboxyl-terminal region. This siRNA sequence was the most effective among the three others tested (not shown).
Western Blotting
Ten micrograms total protein from each SI sample was electrophoresed on 10% sodium dodecyl sulfate–polyacrylamide in-house made minigels and then transferred to nitrocellulose membranes, as previously described (Suadicani et al. Citation2003). After 30 min incubation with blocking solution (1× Tris Buffered Saline [TBS] containing 5% dry nonfat milk), blotting was performed by incubating the membrane overnight at 4°C using a polyclonal rabbit anti-Cx43 antibody (181-A; 1:20,000, epitope spanning amino acids 346 to 360, located at the carboxyl-terminal region of Cx43; gift from Dr. Hertzberg) and 1 h incubation with secondary polyclonal goat anti-rabbit antibodies conjugated to horseradish peroxidase (1:10,000). Immunopositive bands were detected using the Amersham enhanced chemiluminescence (ECL) detection kit (Amersham Biosciences, Piscataway, NJ) and exposed on Kodak x-ray film. The intensities of the bands were analyzed using Scion NIH Image software (Scion, Frederick, MD). Measured intensities for all experiments were compared to the internal control GAPDH.
Microarray
RNA Extraction and Hybridization
Twenty micrograms total RNA extracted from each culture dish containing WT, KO, or SI astrocytes was reverse transcribed in the presence of fluorescent Alexa Fluor 647 (red) and Alexa 555 (green)-aha-dUTPs to obtain labeled cDNAs (http://probes.invitrogen.com/media/pis/mp32755.pdf). Red-and green-labeled samples of biological replicas were cohybridized (“multiple yellow” strategy; Iacobas et al. 2006) overnight at 50°C with aminosilane-coated Corning glass slides printed with 32K selected 70-mer Operon mouse oligonucleotide sequences (version 3.0) by the Microarray Core Facility of the AECOM (http://microarray1k.aecom.yu.edu, deposited as platform GPL5371 in http://www.ncbi.nlm.nih.gov/geo). After washing (0.1% SDS and 20× Saline Sodium Citrate [SSC]) to remove the nonhybridized cDNAs, each array was scanned at 750 V (635 nm) and 670 V (532 nm) with GenePix 4100B scanner (Axon Instruments, CA) and images were primarily analyzed with GenePixPro 6.0 (Axon Instruments, CA).
Data Processing
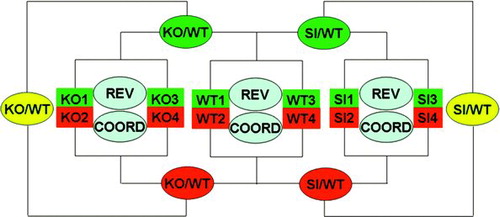
Locally corrupted and/or saturated spots as well as those for which the foreground median fluorescence did not exceed twice the median local background fluorescence in at least one of the four biological replicas were eliminated from the analysis. Data were normalized through an in-house developed algorithm (Iacobas et al. Citation2005b) that alternates intrachip with interchip normalization until the residual error fell below 5% in subsequent steps. The comparisons of the transcriptomes were done as illustrated in and the expression ratios KO/WT and SI/WT obtained for each quantified gene. In addition to the expression regulation, we analyzed for each group of samples the relative expression variability (REV) and expression coordination (COORD) of both individual genes and gene cohorts. GenMapp (Dahlquist et al. Citation2002) and MappFinder software (www.genmapp.org; Doniger et al. 2003) and databases were used to identify the most affected GO (Gene Ontology) categories by Cx43 knockout and knockdown.
Figure S1 The “multiple yellow” experimental design of the microarray experiment. WT = wild-type (untreated) astrocytes; KO = Cx43 null astrocytes; SI = Cx43 siRNA-treated WT astrocytes; KO/WT, SI/WT = expression ratio when comparing the indicated types of astrocytes, with green and red background indicating the labeled samples that were compared and the yellow background indicating the average of the two comparisons; REV = analysis of relative expression variability; COORD = coordination analysis, both within biological replicas.
Detection of Significantly Regulated Genes
Our method relies on both absolute fold-change (> 1.5×) and p value (< 0.05) of the heteroscedastic t test (two-sample unequal variance) applied to the means of the background subtracted normalized fluorescence values in the four biological replicas of the compared transcriptomes. p values were computed with Bonferroni-type correction applied to the redundancy group (i.e., set of spots probing the same gene as previously described (Iacobas et al. Citation2005b). Then, the statistical significance of the overlap of the two regulomes (sets of the significantly regulated genes) was determined by comparing the numbers of genes found to be similarly or oppositely regulated with the expected numbers obtainable by chance. It should be noted here that the application of the two quasi-independent criteria of fold-change and p value considerably reduces the number of false positives that would be expected when applying either fold-change or p value determinations alone. Moreover, the Bonferroni-type correction applied to the redundancy groups avoids the “multiple sampling” problem (Draghici Citation2003).
Analysis of Expression Variability
The relative estimated variability (REV) of the transcript abundance among the biological replicas was determined as the midrange of the χ2-estimate of the coefficient of variability (Iacobas et al. Citation2003a). Then, the genes were ordered with respect to decreasing variability so that the first percentile (or gene expression stability score [GES] < 1) contains the most unstably expressed and the 100th percentile the most stably expressed genes. Further, REV analysis was used to evaluate the change of control stringency induced by Cx43 knockout and knockdown and GES analysis to identify the genes with major changes in expression stability induced by Cx43 disruption or silencing.
Expression Coordination
Two genes were considered as synergistically expressed if their expression levels had a positive covariance within biological replicas, as antagonistically expressed when they manifested opposite tendencies (i.e., negative covariance), and as independently expressed when their transcription levels were not correlated (close to zero covariance). In the case of four biological replicas, the (< 0.05) cut-off for synergism is pairwise Pearson correlation coefficient ρ > 0.90, for antagonism ρ < −0.90 and for independence |ρ| < 0.05. The set of correlation coefficients between the expression levels of a particular gene and of each other gene within the biological replicas forms the coordination profile of that gene. Genes with striking similarity or opposition with respect to the coordination profiles were termed “coordination see-saws” (Iacobas et al. Citation2007b).
RESULTS
Efficiency of the Cx43 Knockdown
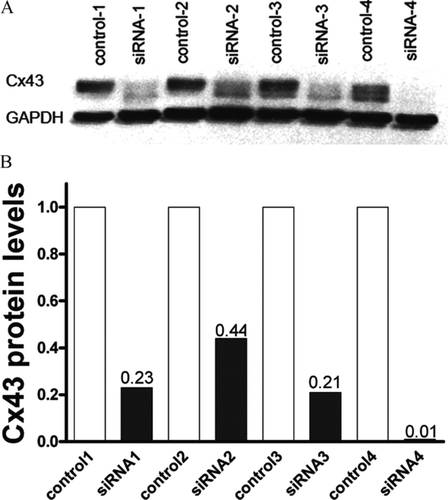
As presented in , transfection of four groups of WT astrocytes with the Cx43siRNA construct led to the reduction of the Cx43 protein level between 56% (siRNA2) and 99% (siRNA4), with an average reduction of 78%. For comparison, the average reduction of Cx43 mRNA determined in these samples using the microarrays was 70%.
Figure 1 Efficiency of Cx43 siRNA treatment. (A) Western blot showing expression level of Cx43 in untreated and siRNA-treated cultured astrocytes. (B) Bar histogram showing the relative expression level of Cx43 in untreated and Cx43 siRNA-treated astrocytes with respect to control astrocytes.
Gene Expression Regulation
The microarray study was performed according to the standards of the Microarray Gene Expression Data Society (MGED) and data complying with the Minimum Information About Microarray Experiments (MIAME; Brazma et al. Citation2001) have been deposited in the National Center for Biotechnology Information Gene Expression Omnibus database (http://www.ncbi.nlm.nih.gov/geo) as series GSE8105.
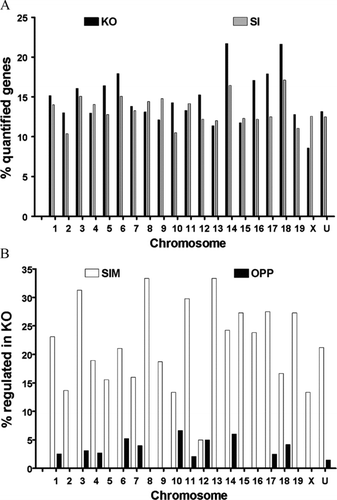
Of the 8039 quantified genes in all three conditions, 8.2% were up-regulated and 5.7% down-regulated in KO and 6.2% up-regulated and 6.7% down-regulated in SI astrocytes. In addition to encoding proteins performing a wide diversity of functions (see below), the regulated genes in both Cx43 KO and SI astrocytes were located on all chromosomes as presented in . This lack of association of altered genes with a particular chromosome indicates that effects of both knockdown and knockout are not due to bystander effects related to chromosome location (see Cajiao et al, 2004) or “passenger effects” of the transgene construct (see Lusis et al. Citation2007).
Figure 2 (A) Chromosomal distribution of the regulated genes. Column height is proportional to the percent regulated of quantified unigenes in each (1, …, 19, X, U = unknown) chromosome (negative for down-regulation) in the indicated sample with respect to WT astrocytes. Note the lack of positional dependence of the regulated genes in both Cx43 knockout and knockdown astrocytes. (B) Percentages of genes regulated in KO that were similarly (SIM) or oppositely (OPP) regulated in SI. Note that the number of similarly regulated genes (SIM) exceeded significantly that of oppositely regulated (OPP) genes for all chromosomes except chromosome 12.
Overlap of Cx43 Knockout and Knockdown Regulomes
We found a significant overlap between the genes that were significantly regulated in astrocytes from Cx43 KO mice and in WT astrocytes following Cx43 silencing by Cx43 siRNA treatment. As shown in , this overlap extends to genes located on all chromosomes, with a remarkable degree of similarity for all but chromosome 12, where there are small but equal numbers of similarly and oppositely regulated genes. presents the most affected GO categories that include genes similarly regulated in KO and SI astrocytes with respect to WT. Note that the most down-regulated biological processes included those related to cell differentiation and proliferation, possibly explaining the substantially lower growth rate observed for KO astrocytes with respect to wildtypes (e.g., Dermietzel et al. Citation2000; Iacobas et al. Citation2003a; Naus et al. Citation1997), whereas several up-regulated processes are related to programmed cellular death. Note also the wide range of affected pathways resulting from Cx43 knockout and knockdown, including processes involved in transcription such as polymerase activity.
TABLE 1 Examples of GO categogries (biological processes, molecular functions, and cellular locations) that were similarly regulated in KO and SI astrocytes with respect to WT
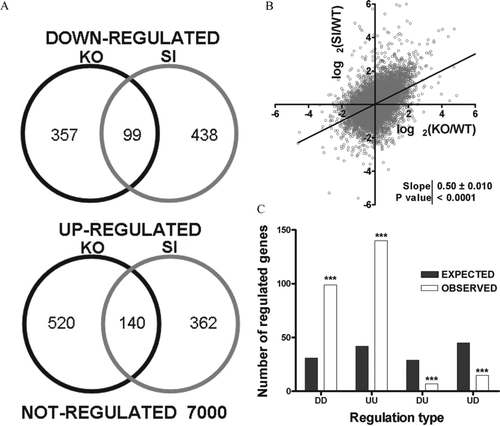
We compared the overlap of significant up-and down-regulated genes (, ) and plotted the expression ratios of each gene in Cx43 KO and siRNA-treated astrocytes against one another (). With regard to overlap of significantly regulated genes, 99 of 456 and 537 genes in KO and siRNA-treated astrocytes were down-regulated in both and 140 of 660 and 502 were significantly up-regulated. Interestingly, fold-change of 91.6% unigenes significantly regulated in both Cx43 KO and SI astrocytes had the same orientation, indicating a significant (p < 10−300) bias toward similar regulation (DD and UU in ) as well as significantly fewer opposite regulations (p = 2.5 × 10⁻⁵ for DU and p = 4.4 × 10⁻⁶ for UD) when compared with what was expected if the regulated genes would be randomly selected with the same prevalence as observed up-and down-regulated genes in the two types of Cx43-deficient astrocytes. Moreover, we found an overall high degree of proportionality between the expression regulations in KO and SI astrocytes with respect to WT as illustrated in . Because this correlation analysis is not restricted to the significantly altered genes, the highly significant nonzero slope over the entire range of expression levels reflects an overall similarity in gene expression profiles between the SI and KO transcriptomes.
Figure 3 Overlap of expression regulation. (A) Venn diagrams showing the number of down-and up-regulated genes in KO and SI, as well as the number of genes that were similarly regulated in both conditions. (B) Log-log plot of the expression ratios obtained in Cx43 siRNA-treated astrocytes (SI) against expression ratios obtained in Cx43 KO astrocytes (KO); both ratios were computed with respect to that of wild-type astrocytes (WT). Note the significant non-zero slope of the linear regression, indicating significant (p < 0.0001) positive correlation between the two sets of expression ratios. (C) Expected (gray bars) and observed (white bars) numbers of similarly and oppositely regulated genes. First D/U indicates down/up-regulation in KO (first letter) or SI (second) astrocytes. Note the significant difference between the predicted and observed numbers of regulated genes in each class, indicating that similarity between the two treatments are not due to chance.
Presumably, the large number and variety of altered genes is orchestrated by the regulation of key transcription factors. Consistent with this hypothesis, we found that expression of 72 of the 104 quantified transcription factor genes was altered in the same direction in Cx43 KO and siRNA-treated astrocytes and had the same orientation with respect to the WT. When the comparison was limited to the genes that were significantly regulated in both, six (Taf7, Usf2, Cops5, Phtf1, Rb1, Stat5b) out of seven genes were found to be altered in the same direction, with Sox7 being the single transcription factor with opposite significant regulation in KO and SI.
The Similarity of Knockout and Knockdown Transcriptomes Extends to Expression Variability
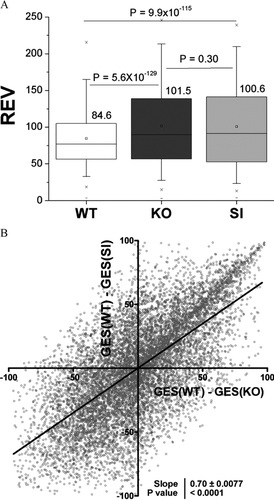
In addition to the mean level of gene expression, the variability of gene expression between biological samples provides a parameter by which genotypes can be compared. Higher variability presumably reflects less stringent transcriptional control, whereas lower variability is interpreted as reflecting tighter control. As illustrated in , we found that relative expression variability of genes in KO and SI were both significantly increased compared to that of WT (by 20% in the case of KO and by 19% for SI). Moreover, we found a remarkable proportionality between the changes in the hierarchy of gene transcription control (measured by the alteration of the GES scores) as illustrated in . Thus, this analysis indicates that Cx43 KO and SI astrocytes had very similar and significant overall loss of transcription control.
Figure 4 Overlap of expression variability regulation and changes in transcription control priorities. (A) Box charts of relative expression variability (REV) of genes within the three types of astrocytes. Note the p values of the hypothesis regarding the equality of the indicated rev averages. (B) Linear regression of the changes in hierarchy of transcription control in KO and SI with respect to WT astrocytes. Note the significant non-zero slope.
Gene Expression Interlinkages Are Similar in Cx43 Knockout and Knockdown Astrocytes and Differ Strikingly from Wild-Types
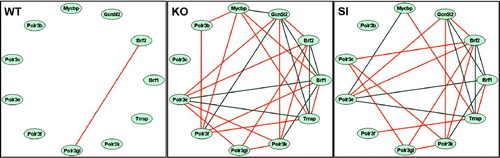
The variability in gene expression levels in astrocytes from different mice allows coordination analysis between pairs of genes. Gene pairs with significant pairwise Pearson correlation coefficients thus are coordinated with regard to their expression levels and are interlinked within the network. In order to evaluate whether such interlinkages were altered similarly in Cx43 KO and SI astrocytes we analyzed the expression intercoordinations within the three types of astrocyte samples among genes of the most affected GO categories. Here, we illustrate the remodeling of the regulatory network for eight genes related to polymerase III and of transformation/transcription domain-associated protein (Trrap) and GCN5 general control of amino acid synthesis-like 2 (Gnc5l2), recently reported as used by c-Myc–binding protein (Mycbp) to activate pol III transcription of tRNA and 5S rRNA genes (Kenneth et al. 2007). In WT astrocytes (), we observed only one positive coordination (“synergism”) between BRF2, a subunit of RNA polymerase III transcription initiation factor and polymerase (RNA) III (DNA directed) polypeptide G like (Polr3gl) and no negative antagonistic coordinations, i.e., < 2% coordination. By contrast, expression coordinations were much more common in Cx43 KO (17 synergisms + 9 antagonisms, i.e., > 47% coordination) and SI (13 synergisms + 8 antagonisms, i.e., > 38% coordination) astrocytes (, ). The overlap between the last two conditions is striking, with eight common synergisms, eight common antagonisms, and no oppositions; moreover, in all cases where coordinations were significant in one sample but not in the other, orientation was the same in both. Thus, the architecture of the astrocyte Gene Regulatory Network is substantially altered in both Cx43 KO and SI astrocytes, and alterations in network connectivity produced by both manipulations are similar.
Figure 5 Remodeling of gene interlinkages. Note the lack of interlinkage between the genes in WT genotype and their presence in SI and KO. Of note is the similar remodeling of gene interlinkages within the polymerase III cluster induced by knockdown and knockout. Red lines indicate significant synergistic expression of the connected genes and blue lines indicate antagonistic expression. Genes: Brf1 = BRF1 homolog, subunit of RNA polymerase III transcription initiation factor IIIB (S. cervisiae); Brf2 = BRF2, subunit of RNA polymerase III transcription initiation factor, BRF1-like; Gcn512 = GCN5 general control of amino acid synthesis-like 2 (yeast); Mycbp = c-myc–binding protein; Polr3b = polymerase (RNA) III (DNA directed) polypeptide B; Polr3c = polymerase (RNA) III (DNA directed) polypeptide C; Polr3e = polymerase (RNA) III (DNA directed) polypeptide E; Polr3f = polymerase (RNA) III (DNA directed) polypeptide F; Polr3gl = polymerase (RNA) III (DNA directed) polypeptide G like; Polr3K = polymerase (RNA) III (DNA directed) polypeptide K; Trrap = transformation/transcription domain-associated protein.
Similar “See-Saw” Partners of Key Genes from the Polymerase III Cluster in Cx43 Knockout and Knockdown
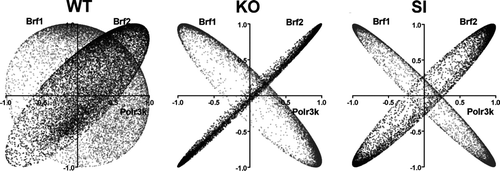
An alternative method by which to analyze coordination throughout the Gene Regulatory Network is to compare coordination profiles of one gene with all others. Such analysis has identified certain gene pairs with very similar coordination with all other genes. We have termed such gene pairs “see-saw” partners, both in recognition of the appearance of the graphs and to denote the strength of their synergistic and antagonistic relationships (Iacobas et al. Citation2007a, Citation2007b; Spray and Iacobas Citation2007). We have identified the “see-saw” partners within the polymerase III cluster for each type of astrocytes by comparing the correlation of expression levels of three selected partners (Polr3K compared to Brf2 and Brf1) with each other gene from the sampled transcriptome (8039 unigenes). This analysis disclosed a significant overlap of these partnerships between KO and SI but not between WT and KO or WT and SI (as illustrated in ). Thus, for these genes in both KO and SI astrocytes, Brf2 exhibits very similar relationships to all other genes compared to Polr3k, whereas Brf1 exhibits opposite coordinations. These close similar and opposite relationships are much less prominent in WT astrocytes.
Figure 6 Overlap of coordination profiles. Plots of correlation coefficients between the expression levels of the indicated genes with each other genes within the biological samples of the indicated samples (WT, KO, and SI). Note the striking similarity of the coordination profile of Polr3k with that of Brf2 and the striking opposition with Brf1 in both Cx43 null (KO) and Cx43siRNA (SI) astrocytes and the differences with regard to wildtype (WT) astrocytes.
DISCUSSION
Overlap of Transcriptomic Changes
Gene expression profiling provides a highly sensitive method for comparing large fractions of the transcriptome of cells and tissues from various sources. Not only can transcript abundance be quantified for all genes under different experimental conditions, but also data from multiple biological replicas of different samples allow calculation of variability within each group of replicas, thus revealing through correlation analysis the interlinkages comprising the Gene Regulatory Networks and determining whether such interlinkages are modified by treatment.
A difficulty in interpreting transcriptomic results consisting of such large numbers of gene expression values is to quantitatively establish similarities or differences between data sets. We show here that expression levels of a large number of genes are altered in both Cx43KO astrocytes and those treated with Cx43 siRNA and that the overlap between up-and down-regulated genes in both conditions is much higher than predicted by chance. Moreover, the number of observed opposite regulations is significantly smaller than predicted by chance. In addition, when expression levels of each gene are plotted against each other from siRNA-treated and Cx43 KO astrocytes, they are found to covary over the entire range, indicating that overlap is not confined to the significantly altered genes, but that the entire transcriptomes are similar.
Both knockout and knockdown methods targeted a single gene (Gja1, encoding the gap junction protein connexin43). However, we found that regulated genes in both Cx43 KO and SI astrocytes were located on all chromosomes and that functions of the proteins encoded by the regulated genes include a wide diversity of physiological and cellular processes. As pointed out in previous studies on Cx43 null brain (Iacobas et al. Citation2003b, Citation2003c, Citation2005b, Citation2007a, Citation2007b; Spray and Iacobas Citation2007), heart (Iacobas et al. Citation2003b, Citation2003c, Citation2005a, Citation2005c), and astrocytes (Iacobas et al. Citation2003a, Citation2004, Citation2007c), the finding that ablation of a single gap junction gene regulates numerous other genes clearly indicates the major role played by interlinkages of these genes to those encoding gap junction proteins. In the present study, we found that such interlinkages are also present in astrocytes in which expression of Cx43 was acutely reduced (knockdown) by transfection with Cx43siRNA, and that alterations in gene expression compared to WT were remarkably similar in both KO and SI astrocytes.
Analysis of variations in gene expression among biological samples revealed a global increase in variation in both Cx43 KO and siRNA-treated astrocytes of about 20% compared to wild-types. Moreover, the slope of the expression stability deviation in Cx43siRNA-treated with respect to WT astrocytes plotted against the deviations in Cx43 null with respect to WT was highly significantly nonzero, providing further evidence for a transcriptome-wide similarity between Cx43 KO and SI astrocytes.
Finally, we used correlation analysis within the most affected GO categories to determine whether the Gene Regulatory Networks were similarly affected in Cx43 KO and SI astrocytes. This analysis (illustrated for the cluster of polymerase III and two of its main regulators) revealed that in both groups of Cx43 deficient astrocytes, there were abundant interlinkages not seen in WT and that these interlinkages were similar in KO and SI astrocytes.
In summary, analyses of these three independent parameters of gene expression all demonstrate a high degree of similarity between Cx43 KO and siRNA-treated astrocytes. To be sure, such similarity is not absolute, such that many other genes display differences in their expression variability and coordination comparing Cx43 KO and SI astrocytes. The extent to which such deviation represents compensatory adjustments in Cx43 KO astrocytes or effects of vector or other factors accompanying transfection with siRNA is currently being explored.
Hits and Misses of the RNAi Systems
The RNAi method was developed as an alternative to the costly and time-consuming technique of homologous recombination to disrupt expression of selected genes. In contrast to the knockout technique, RNAi treatment achieves loss-of-function phenotypes without removing the targeted gene. Thus, the transient nature of the knockdown with siRNA (DeSouza et al. Citation2006) allows restoration of the expression of the endogenous gene once the RNAi vector is silenced or removed (Voorhoeve and Agami Citation2003). In addition to the simplicity and cost-effectiveness, the knockdown strategy is acute, thereby avoiding developmental tissue malformations such as occur in the heart in Cx43 null mice (Reaume et al. Citation1995).
A few previous behavioral and genomic studies have compared the effects of knocking-out and knocking-down particular genes, and these studies have revealed both similarities and differences in the consequences of the two methods (see DeSouza et al. Citation2006). A major technical difference is that the knockdown does not disrupt completely the gene expression (such as in our experiment where the Cx43 protein and mRNA level were reduced by 70% to 78%, and in the De Souza et al report, where levels of targeted RNA varied from minimal alteration to 80% reduction). The lack of uniformity in silencing Cx43 among the biological replicas in our study expanded the range over which coordinated expression could be evaluated, thereby increasing the accuracy of the coordination analysis. It should be noted here that previous comparison of Cx43 heterozygous and null brains (Iacobas et al. Citation2005b) revealed similar alterations in gene expression patterns, differing primarily in larger magnitudes of alterations in KO than heterozygotes.
In our study, we have compared astrocytes cultured for almost two weeks after isolation from perinatal wildtype and Cx43 null mice with wildtype astrocytes maintained in culture for the same period but transfected for 48 hr with Cx43 siRNA, at time at which Cx43 expression was found to be maximally reduced by the siRNA. The results of this comparison indicate significant similarities between transcriptomes of SI and KO astrocytes as compared to WT, from which we conclude that transcriptomic changes in the Cx43 null mice are not simply due to developmental compensation for the missing gene. We acknowledge that additional experiments are necessary in order to rigorously establish the precise Gene Regulatory Networks involving Cx43 and their activation and inactivation kinetics. It would thus be desirable to quantify such gene interlinkages both at steady state and as changes resulting from perturbations evolve in response to temporally controlled Cx43 activation and inactivation. It will also be necessary to evaluate the impact of transfection with vector alone (as we have done previously: Iacobas et al. Citation2002) or with scrambled construct and to reintroduce Cx43 into the Cx43 null astrocytes.
Although the comparison reported here represents a single time point and therefore provides no information regarding sequence of gene alterations, the highly significant overlap that we observed not only in the regulated pattern but also in the changes in expression variability and coordination supports the conclusion that the gene interlinkage rather than the developmental compensatory mechanisms are responsible for the transcriptomic alterations in the Cx43 null astrocytes.
This study was supported by NIH grants HD32573, NS41282, and NS41023.
REFERENCES
- Brand-Schieber E, Werner P, Iacobas D A, Iacobas S, Beelitz M, Lowery S L, Spray D C, Scemes S. Connexin43, the major gap junction protein of astrocytes, is down regulated in an animal model of multiple sclerosis. J Neurosci Res 2005; 80: 798–808
- Brazma A, Hingamp P, Quackenbush J, Sherlock G, Spellman P, Stoeckert C, Aach J, Ansorge W, Ball C A, Causton H C, Gaasterland T, Glenisson P, Holstege F C, Kim I F, Markowitz V, Matese J C, Parkinson H, Robinson A, Sarkans U, Schulze-Kremer S, Stewart J, Taylor R, Vilo J, Vingron M. Minimum information about a microarray experiment (MIAME)-toward standards for microarray data. Nat Genet 2001; 29: 365–37
- Cajiao I, Zhang A, Yoo E J, Cooke N E, Liebhaber S A. Bystander gene activation by a locus control region. EMBO J 2004; 23: 3854–3863
- Dahlquist K D, Salomonis N, Vranizan K, Lawlor S C, Conklin B R. GenMAPP, a new tool for viewing and analyzing microarray data on biological pathways. Nat Genet. 2002; 31: 19–20
- Dermietzel R, Gao Y, Scemes E, Vieira D, Urban M, Kremer M, Bennett M VL, Spray D C. Connexin43 null mice reveal that astrocytes express multiple connexins. Brain Res Rev 2000; 32: 45–56
- De Souza A T, Dai X, Spencer A G, Reppen T, Menzie A, Roesch P L, He Y, Caguyong M J, Bloomer S, Herweijer H, Wolff J A, Hagstrom J E, Lewis D L, Linsley P S, Ulrich R G. Transcriptional and phenotypic comparisons of Ppara knockout and siRNA knockdown mice. Nucleic Acids Res 2006; 34: 4486–4494
- Doniger S W, Salomonis N, Dahlquist K D, Vranizan K, Lawlor S C, Conklin B R. MAPPFinder: Using Gene Ontology and GenMAPP to create a global gene-expression profile from microarray data. Genome Biol. 2003; 4: R7
- Draghici S. Data Analysis Tools for DNA Microarrays. Chapman & Hall, Boca Raton, FL 2003; 223–224
- Fishman G I. Gap junction remodeling and ventricular arrhythmias. Heart Rhythm 2005; 2: 887–889
- Gerido D A, White T W. Connexin disorders of the ear, skin, and lens. Biochim Biophys Acta 2004; 1662: 159–170, Review
- Harris A L. Connexin channel permeability to cytoplasmic molecules. Prog Biophys Mol Biol 2007; 94: 120–143, Review
- Iacobas D A, Urban M, Iacoba S, Spray D C. Control and variability of gene expression in mouse brain and in a neuroblastoma cell line. Rom J Physiol 2002; 39-40: 71–90
- Iacobas D A, Urban M, Iacobas S, Scemes E, Spray D C. Array analysis of gene expression in connexin43 null astrocytes. Physiol Genomics 2003a; 15: 177–190
- Iacobas D A, Urban M, Iacobas S, Spray D C. Transcriptomic characterization of four classes of cell-cell/matrix genes in brains and hearts of wild type and connexin43 null mice. Rom. J. Physiol 2003b; 40: 68–85
- Iacobas D A, Urban M, Iacobas S, Spray D C. Transcription regulation and coordination of some cell-signaling genes in brain and heart of connexin43 null mouse. Rev Med Chir Soc Med Nat Iasi 2003c; 107: 534–539
- Iacobas D A, Scemes E, Spray D C. Gene expression in connexin43 null astrocytes extended beyond the gap junction. Neurochem Intl 2004; 45: 243–250
- Iacobas D A, Iacobas S, Li Wei, Zoidl G, Dermietzel R, Spray D C. Genes controlling multiple functional pathways are transcriptionally regulated in connexin43 null mouse heart. Physiol Genomics 2005a; 20: 211–223
- Iacobas D A, Iacobas S, Urban-Maldonado M, Spray D C. Sensitivity of the brain transcriptome to connexin ablation. Biochim Biophys Acta 2005b; 1711: 183–196
- Iacobas D A, Iacobas S, Spray D C. Use of cDNA arrays to explore gene expression in genetically manipulated mice and cell lines. Practical Methods in Cardiovascular Research, S Dhein, F W Mohr, M Delmar. Springer-Verlag, Berlin 2005c; 907–915
- Iacobas D A, Fan C, Iacobas S, Spray D C, Haddad G G. Transcriptomic changes in developing kidney exposed to chronic hypoxia. Biochem Biophys Res Commun 2006; 349: 329–33
- Iacobas D A, Iacobas S, Spray D C. Connexin43 and the brain transcriptome of the newborn mice. Genomics 2007a; 89: 113–123
- Iacobas D A, Iacobas S, Spray D C. Connexin-dependent transcriptomic networks in mouse brain. Prog Biophys Mol Biol 2007b; 94: 168–184
- Iacobas D A, Suadicani S O, Iacobas S, Chrisman C, Cohen M, Spray D C, Scemes E. Gap junction and purinergic P2 receptor proteins as a functional unit: Insights from transcriptomics. J Membr Biol 2007c; 217: 83–91
- Insel P A, Patel H H. Do studies in caveolin-knockouts teach us about physiology and pharmacology or instead, the ways mice compensate for ‘lost proteins’?. Br J Pharmacol 2007; 150: 251–254
- Kardami E, Dang X, Iacobas D A, Nickel B E, Jeyaraman M, Srisakuldee W, Makazan J, Tanguy S, Spray D C. The role of connexins on growth and gene expression. Prog Biophys Mol Biol 2007; 94: 245–264
- Lusis A J, Yu J, Wang S S. The problem of passenger genes in transgenic mice. Arterioscler Thromb Vasc Biol 2007; 27: 2100–2103
- Naus C C, Bechberger J F, Zhang Y, Venance L, Yamasaki H, Juneja S C, Kidder G M, Giaume C. Altered gap junctional communication, intercellular signaling, and growth in cultured astrocytes deficient in connexin43. J Neurosci Res 1997; 49: 528–540
- Reaume A G, de Sousa P A, Kulkarni S, Langille B L, Zhu D, Davies T C, Juneja S C, Kidder G M, Rossant J. Cardiac malformation in neonatal mice lacking connexin43. Science 1995; 267: 1831–1834
- Roscoe W A, Kidder G M, Karlik S J. Experimental allergic encephalomyelitis in connexin 43-heterozygous mice. Cell Commun Adhes 2007; 14: 57–73
- Severs N J, Dupont E, Thomas N, Kaba R, Rothery S, Jain R, Sharpey K, Fry C H. Alterations in cardiac connexin expression in cardiomyopathies. Adv Cardiol 2006; 42: 228–242
- Spray D C, Iacobas D A. Organizational principles of the connexin-related brain transcriptome. J Membr Biol 2007; 218: 39–47
- Suadicani S O, Pina-Benabou M H, Urban-Maldonado M, Spray D C, Scemes E. Acute downregulation of Cx43 alters P2Y receptor expression levels in mouse spinal cord astrocytes. Glia 2003; 42: 160–171
- van Veen T A, van Rijen H V, Opthof T. cardiac gap junction channels: Modulation of expression and channel properties. Cardiovascular Res 2001; 51: 217–229
- Voorhoeve P M, Agami R. Knockdown stands up. Trends Biotechnol 2003; 21: 2–4, Review
- Willecke K, Eiberger J, Degen J, Eckardt D, Romualdi A, Guldenagel M, Deutsch U, Sohl G. Structural and functional diversity of connexin genes in the mouse and human genome. Biol. Chem. 2002; 383: 725–737, Review