
Abstract
Fire investigators may be occupationally exposed to many of the same compounds as the more widely studied fire suppression members of the fire service but are often tasked with working in a given exposure for longer periods ranging from hours to multiple days and may do so with limited personal protective equipment. In this study, we characterize the area air concentrations of contaminants during post-fire investigation of controlled residential fires with furnishings common to current bedroom, kitchen and living room fires in the United States. Area air sampling was conducted during different investigation phases including when investigations might be conducted immediately after fire suppression and extended out to 5 days after the fire. Airborne particulate over a wide range of dimensions, including sub-micron particles, were elevated to potentially unhealthy levels (based on air quality index) when averaged over a 60 min investigation period shortly after fire suppression with median PM2.5 levels over 100 µg/m3 (range 16–498 µg/m3) and median peak transient concentrations of 1,090 µg/m3 (range 200–23,700 µg/m3) during drywall removal or shoveling activities. Additionally, airborne aldehyde concentrations were elevated compared to volatile organic compounds with peak values of formaldehyde exceeding NIOSH ceiling limits during the earliest investigation periods (median 356 µg/m3, range: 140–775 µg/m3) and occasionally 1 day post-fire when the structure was boarded up before subsequent investigation activities. These results highlight the need to protect investigators’ airways from particulates when fire investigation activities are conducted as well as during post-fire reconstruction activities. Additionally, vapor protection from formaldehyde should be strongly considered at least through investigations occurring 3 days after the fire and personal formaldehyde air monitoring is recommended during investigations.
Introduction
The fire service has witnessed growing evidence of increased occupational cancer risks (Daniels et al. Citation2014, Citation2015; Glass et al. Citation2014; IARC Citation2010; Jalilian et al. Citation2019; Lee et al. Citation2020; LeMasters et al. Citation2006; Pukkala et al. Citation2009; Tsai et al. Citation2015) and a growing body of literature focused on job-related exposures that may be encountered (Engelsman et al. Citation2020; Gill and Britz-McKibbin Citation2020). At the same time, sudden cardiac events are a leading cause of on-duty deaths in the fire service and the documented increased risk post-suppression (Smith et al. Citation2019) may be partially attributed to fireground exposures (Baxter et al. Citation2010; Smith et al. Citation2013, Citation2016). It has been well documented that today’s structure fires can produce high levels of airborne particulate and numerous known, probable and possible carcinogens such as aldehydes, polycyclic aromatic hydrocarbons (PAHs), and volatile organic compounds (VOCs) (Jankovic et al. Citation1991; Austin et al. Citation2001a, Citation2001b). While much of this occupational exposure research has focused on training fires (Kirk and Logan Citation2015; Fernando et al. Citation2016; Stec et al. Citation2018; Wingfors et al. Citation2018; Fent et al. Citation2019) or structural fire responses (Bolstad-Johnson et al. Citation2000; Fent et al. Citation2013, Citation2018; Baxter et al. Citation2014; Keir et al. Citation2017, Citation2020; Poutasse et al. Citation2020; Hoppe-Jones et al. Citation2021), potential risks for post-fire scene investigators have not been characterized nearly as well.
Fire investigators typically expect to encounter lower levels of airborne environmental contamination than structural firefighters because their activities take place after fire extinguishment. Occupational exposure risks during fire responses are often characterized as high magnitude but for a relatively short duration. Heavy insulating firefighter personal protective equipment (PPE) and self-contained breathing apparatus (SCBA) are well suited for these risks. The timeframe for active fire investigation can range from immediate post suppression to several days or longer after fire suppression has been completed. Oftentimes, due in part to a lack of perceived risk from an active fire along with important challenges in completing documentation tasks, the use of PPE among fire investigators is limited, potentially increasing their susceptibility to carcinogenic exposures. The International Association of Arson Investigators (IAAI) Fire Investigator Health and Safety Best Practices guidelines recommends fire investigators monitor for carbon monoxide and hydrogen cyanide during the incident (International Association of Arson Investigators Citation2020). However, many other known and possible carcinogens are likely to remain present during overhaul activities (activities conducted to look for hidden and/or smoldering fires) and during the fire investigation period (Weiss and Miller Citation2011; Gainey et al. Citation2018).
Typical fire investigations may be conducted over an extended time period and include a wide range of activities. Investigators are commonly called on to document a fire scene through collecting pictures, creating diagrams, and identifying patterns. In some cases, investigators will have to shovel debris, remove materials, and collect samples from the burned area. Investigators may work with canine agents to ascertain potential use of accelerants or other occupations in order to determine the origin and cause of the fire. The IAAI has defined categories of fire scenes for investigation based on time after fire extinguishment has been completed (International Association of Arson Investigators Citation2020).
HOT SCENE A: Fire has been extinguished and overhaul is in progress or has not yet commenced.
HOT SCENE B: Fire was fully extinguished/overhauled for less than 2 hr.
WARM SCENE: Fire was fully extinguished at least 2 hr ago but for less than 72 hr.
COLD SCENE: Fire has been fully extinguished for more than 72 hr and not generating detectable or visible products of combustion.
Few studies have focused on the time periods specific to fire investigators. Kinnes and Hine (Citation1998) conducted environmental monitoring during investigations at timeframes ranging from Hot Scene A to Warm Scene and found formaldehyde concentrations up to 0.18 ppm along with total and respirable dust at time-weighted average concentrations up to 5.3 and 1.3 mg/m3. It was noted that several fire investigators, who did not wear respiratory protection, experienced both eye and respiratory irritation during these investigations. Sjostrom et al. (Citation2019) assessed environmental exposure encountered by nine police forensic investigators (PFIs) during investigations and found they were exposed to benzene, naphthalene, and total dust during Warm and/or Cold Scene investigations. In 2013, Fent et al. reported PAH and particulate concentrations during overhaul (similar exposure profile to Hot Scene A) were higher than background concentrations, and particulate and certain VOC concentrations during investigation (Hot Scene B) were higher than background levels in some experiments.
Several studies have reported on the environmental conditions during post-suppression overhaul process. Bolstad-Johnson et al. (Citation2000) conducted an air monitoring study during the overhaul phase of 25 structure fires and found that concentrations of acrolein (one fire), carbon monoxide (five fires), glutaraldehyde (five fires), and formaldehyde (22 fires) exceeded applicable American Conference of Governmental Industrial Hygienists (ACGIH®) or National Institute for Occupational Safety and Health (NIOSH) ceiling values, while benzene exceeded NIOSH short-term exposure limits (STEL) at two fires. Importantly, the 10-min average CO concentrations did not predict concentrations of other products of combustion. Weiss and Miller (Citation2011) measured airborne concentrations of several chemicals during the overhaul phase. They also found CO levels did not predict other chemicals’ presence or concentrations at fire scenes. After 1 hr, most products were no longer detectable with their instrumentation. Finally, Fent et al. (Citation2018) characterized airborne concentrations of combustion byproducts produced during the overhaul phase of 12 controlled residential fires in single family structures and found that total PAHs and benzene exceeded ACGIH excursion limit for coal tar pitch volatiles and NIOSH STEL, respectively. While these studies have not focused specifically on the fire investigators’ activities and exposures, they provide an important guidance for Hot Scene A environments to which initial fire investigators may operate.
Fire investigators are currently lacking comprehensive data upon which to determine appropriate levels of PPE that should be worn from Hot A through Cold Scene investigations and what monitoring should take place to support these decisions. The objective of this study is to characterize airborne contaminants that may be encountered while investigating a residential fire scene from within a few minutes after fire extinguishment to up to 5 days post-fire suppression.
Methods
Study design
The study design and sampling strategy during these investigation activities is outlined in . This project was conducted alongside a subset (N = 18) of experiments designed to study firefighting tactics. Two identical structures were constructed for this study, with nine experiments conducted with fires ignited in a bedroom in one building, and nine separate experiments involved furnishings in a common room (open floor-plan kitchen and living room) in the second building. A minimum of 3 days was provided between each bedroom and common room experiment to allow the buildings to be rehabilitated by clean up and construction crews (damaged furnishings, finishes and structure removed, replace and repainted) and for replacement of instrumentation. During four experiments (Bedroom Experiments #3 and #6, Common Room Experiments #3 and #6), building rehabilitation was delayed for 5 days to allow investigation activities to occur during Warm (1 and 3 days post-fire) and Cold (5 days post-fire) scenes. For these four experiments, fire scenes were preserved by closing up the structure with OSB sheeting screwed to the outside of compromised door and window frames (a standard practice for situations where investigation by additional parties is necessary). Sheeting from the front door was subsequently removed during these additional 60-min investigation periods.
Figure 1. Study design and sample collection strategy.
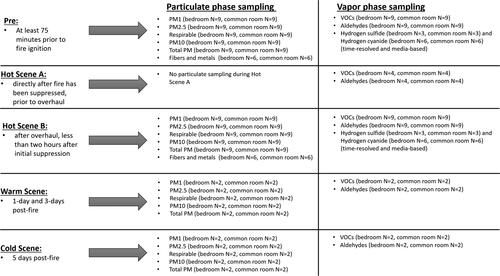
Prior to each fire, baseline pre-fire area air samples were collected over 60 min in the room where the fire was ignited. Post-fire investigation phase area air samples were collected after all fire was suppressed to characterize conditions during Hot Scene A timeframes (N = 8), Hot Scene B timeframes (N = 18), as well as Warm and Cold Scene timeframes (N = 4). No fire investigation activities were conducted during Hot Scene A, but firefighters did conduct overhaul as necessary. Hot Scene B investigations were initiated within an hour of initial suppression, but after overhaul had been completed. During the Hot Scene B and Warm Scene timeframes, typical fire scene investigation activities were conducted for 60 min. During the Cold Scene investigation timeframe, investigators again began with typical documentation activities, then portions of drywall ceilings and walls were removed to inspect fire effects on structural components and building systems.
Test structure, fuel load, and fire ignition
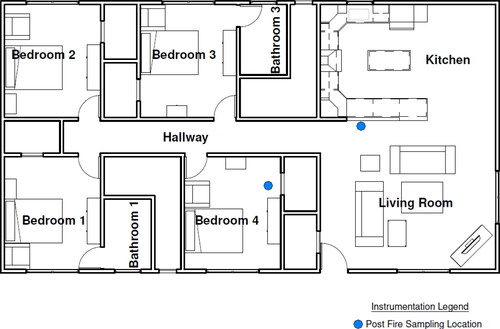
Two identical, wood-framed 150 m2 single-story, four-bedroom, two-bathroom residential structures were used in this study (). Fiberglass batt insulation was installed in the ceiling and exterior wall stud cavities under OSB sheathing. All interior walls and ceilings were lined with 16 mm gypsum board and finished with two coats of latex paint.
Figure 2. Structure layout and sampling locations selected for the bedroom and common room (kitchen and living room) fire experiments.
At least 24 hr prior to each experiment, the structure was freshly painted and fully furnished in each of the four bedrooms, two bathrooms, kitchen, and living room to represent fuel load conditions typical of a 21st century residential structure in the United States. The kitchen fires included electrical wiring, connection boxes, and plastic drainpipe that would be exposed inside of the cabinets. In addition, items commonly found in kitchen, ranging from a coffee maker to a full recycling bin, were included as they were composed of a variety of plastics found in a residential setting. The furnishings were all purchased in new condition and where possible, the base materials used in their construction were determined and documented. Fuel arrangements in the bedroom and common room (open floor plan kitchen and living room) are shown in . Details of materials for all furnishings and contents are included in Supplemental Materials for the kitchen (Table S1), living room (Table S2), and bedroom (Table S3). There were no additional contents such as clothing in closets and drawers of the bedroom or magazine and personal electronics throughout the structure.
Figure 3. Photographs of typical furnishings in the bedroom fires (top) and common room fires including kitchen (middle) and living room (bottom).
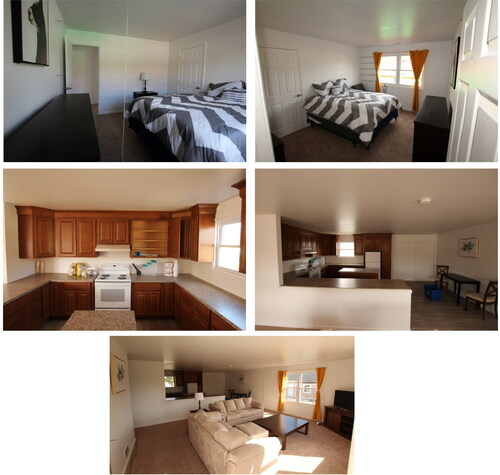
Table 1. Area air sampling collection and analysis methods.
Table 2. Average particulate concentration (µg/m3) for submicron (PM1), less than 2.5 µm (PM2.5), respirable, less than 10 µm (PM10), and total fractions for all eighteen experiments as well as bedroom and common room fire experiments over a 60-min data collection period. Data are presented as median (range).
Table 3. Peak particulate concentration (µg/m3) for submicron (PM1), less than 2.5 µm (PM2.5), respirable, less than 10 µm (PM10), and total fractions for all 18 experiments as well as bedroom and common room fire experiments. Data are presented as median (range).
Bedroom fires were ignited with an electric match located in the corner of the upholstered chair where the seat cushion met the armrest nearest the mattress. Living room fires were also ignited with an electric match located in the corner of the upholstered sofa furthest from the front door. The kitchen ignition was initiated from an approximate 4 kW propane burner upon which a 19 cm diameter aluminum cooking tray with 180 ml (3/4 cup) canola oil was placed on stand 13 cm above the burner. After the oil reached its auto-ignition temperature, the burner was shut down, and the flame produced by the oil spread to adjacent materials on the counter and kitchen cabinets and, depending on timing of firefighting activities, on to the living room furnishings.
Firefighting and fire investigation activities
A team of interior and exterior firefighters coordinated firefighting suppression, ventilation, and search activities using a variety of tactics and timing of actions. In experiments where water was applied quickly and/or ventilation was limited, the fire’s thermal damage was fairly localized near the area of origin. On the other hand, multiple experiments in both bedroom and common room fires transitioned to flashover, resulting in flames extending from each opening of the fire compartment and subsequent extensive floor-to-ceiling, wall-to-wall damage.
After the initial attack team determined that fires were fully suppressed, a second firefighting team entered the structure to monitor conditions and were instructed to conduct minimal overhaul to preserve the fire scenes for investigation. Overhaul was complete once it was determined that all visible flaming had been confirmed to be suppressed and the oxygen and carbon monoxide levels had returned to baseline.
Once overhaul was complete, the fire investigation phase was initiated for 60 min during Hot Scene B, Warm and Cold Scene as described above. During these phases, investigators documented the fire scene, shoveled debris, removed materials, and collect some samples from the burned rooms following common protocols.
Area air sampling
provides a summary of the area air sample collection including sampling media, flow rate ranges, and analysis methods utilized to characterize aldehydes, fiber, hydrogen cyanide (HCN), hydrogen sulfide (H2S), mercury, metals, PAHs, and VOCs as well as direct read instruments to quantify particulate and asphyxiant gases. The VOC method was used to quantify benzene, ethyl benzene, toluene, xylenes, and styrene (BTEXS) as well as naphthalene (which, based on previous publications, is expected to be the PAH in the highest abundance) and total VOCs.
Pre- and post-fire exposure sampling always occurred in the compartment where the fire originated, as shown in . Sampling media and pump intakes were located roughly 5 feet from the floor to approximate breathing zone height. Thomas MegaLite or SKC QuickTake-30 (SKC, Eighty Four, PA) sample pumps with media were run for 60 min to collect samples for Pre-Fire, Hot Scene B, Warm Scene, and Cold Scene timeframes. Gilian BDX-II sampling pump (Senisdyne, St Petersburg, FL) ran for an average of 35 min (range of 30 to 41 min) during Hot Scene A. All sampling pumps were calibrated pre and post sampling events (+/− 5%) and all sampling media were stored in either a refrigerator and/or freezer as appropriate prior to sampling and prior to shipment (on ice) to the analytical laboratory.
Direct read data was collected for carbon monoxide, hydrogen cyanide, and hydrogen sulfide using a Multi-RAE Pro Model # PGM-6248 or Model # PGM-6228 (RAE Systems by Honeywell, San Jose, CA). Aerosol measurements for PM1, PM2.5, respirable, PM10, and total PM size fractions were collected using a DustTrak DRX Model #8534 (TSI Incorporated, Shoreview, MN).
Detection rates for H2S, HCN, fiber, and metal samples collected during the first 12 experiments were low or zero, thus sampling was terminated and data will not be reported here.
Data analysis
Descriptive statistics (i.e., median, range, percentage of samples with concentrations above the limit of detection (LOD)) and statistical analyses were carried out using SPSS (v 27, IBM Corp., Armonk, NY). LOD divided by square root of two was assigned to non-detectable concentrations (Hornung and Reed Citation1990). Wilcoxon Signed-Ranks Test were used to compare differences in area air concentrations among paired timeframes (pre-fire vs. Hot Scene B in all 18 experiments, pre-fire vs. Hot Scene A in the subset of 8 experiments). Further analysis using an independent samples Mann-Whitney U test were completed to test whether area air concentrations varied by fire location (bedroom vs. common room). Significance was set at an alpha of 0.05. Because the direct-reading particle instrument took measurements every second, summary statistics for concentrations of each particle dimension were conducted on the arithmetic means and peak values during baseline and Hot Scene B.
Results
Particulate results
Hot scene B
Average and peak particulate concentrations measured pre-fire and during Hot Scene B for a range of cutoff dimensions are presented in and , respectively. During the pre-fire sampling period, particulate levels were relatively low, with respirable particle concentrations, below 25 µg/m3 on average, although transient peak values averaged 134 µg/m3. However, during Hot Scene B activities, particulate concentration increased significantly for all particle sizes (p < 0.05 for all sizes) with average respirable concentrations increasing to approximately 115 µg/m3 and peak values averaging nearly an order of magnitude higher. Average pre-fire particulate concentrations were commonly higher in the bedroom than in the common room (p < 0.05 for all sizes), possibly due to the bedroom being smaller and less air flow. Conversely, Hot Scene B particulate were generally higher in common room compared to bedroom, though statistically significant increases (p < 0.05) were limited to PM1, respirable and PM2.5 concentrations. Observations noted that peak particulate values appeared when fire debris on horizontal surfaces were disturbed as drywall or pieces of kitchen cabinets fell or were removed. Increases were also noted during simulated investigation activities that included shoveling and moving furnishings.
Warm and cold scene particulates
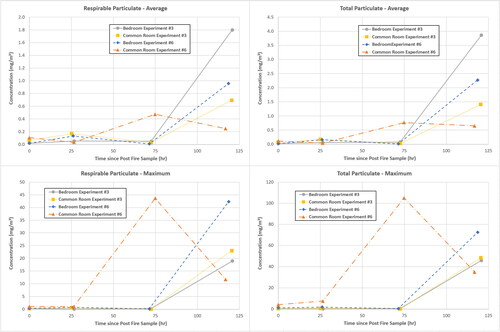
In most cases, the 60-min average and peak respirable and total particulate concentrations during the 1-day and 3-day post-fire investigation timeframe (Warm Scene) were similar in magnitude to Hot Scene B measurement though some variation occurred depending on investigation activities (). The 5-day post experiment (Cold Scene) deviated significantly across all particle sizes as drywall ceiling and wall were removed. Particulate concentrations increased dramatically during Cold Scene activities with peak values of respirable particulate well above 10,000 µg/m3 and in one case exceeding 40,000 µg/m3. Total particulate levels increased more so, possibly due to the difference in the size of particulate produced by the gypsum board and fiberglass insulation compared to products of combustion. Bedroom Experiment #3, Bedroom Experiment #6, and Common Room Experiment #3 followed similar trends, but the Common Room Experiment #6 was unique among this group. Of the four experiments studied in these extended time periods, this fire generated more damage to the room which resulted in some drywall falling from the ceiling prior to the Hot Scene B investigation and some additional drywall fell from the ceiling during the 3-day post-fire investigation.
Figure 4. Respirable (left) and total (right) 60-min average (top) and peak (bottom) particulate concentrations (µg/m3) for 4 experiments including Hot Scene B (immediately post-fire sample at time = 0 hr), Warm Scene (1-day and 3-day post-fire samples at approximately 24 and 72 hr) and Cold Scene (5-day post fire samples at approximately 120 hr).
Vapor phase results
While a wide range of vapors were detected during the study, and this paper will focus on BTEXS compounds, naphthalene, total VOCs (), and aldehydes (). Of the 12 aldehydes targeted by the DNPH/HPLC method, only compounds that were detected in more than 50% of all samples are included in .
Table 4. Airborne concentration of VOCs (µg/m3) as 60-min time-weighted averages for pre-fire and Hot Scene B and averaged over 30–41 min in Hot Scene A. Data are presented as median (range).
Table 5. Airborne concentration of aldehydes (µg/m3) as 60-min time weighted averages for pre-fire and Hot Scene B and averaged over 30–41 min in Hot Scene A. Data are presented as median (range).
Hot scene A and B vapors
While BTEXS compounds were identified in many of the pre-fire samples, concentrations of all compounds increased in Hot Scene A (all p < 0.05), and benzene (p < 0.001), ethyl benzene (p = 0.003), and styrene (p = 0.001) remained significantly elevated above pre-fire levels in the 60-min Hot Scene B sample. Average Hot Scene A concentrations of benzene were below the most conservative exposure limit (NIOSH recommended exposure limit (REL) of 320 µg/m3 (0.1 ppm. Naphthalene concentrations increased significantly during Hot Scene A (p = 0.012) but returned to levels similar to pre-fire concentrations during Hot Scene B sampling. Total VOCs also dramatically increased during Hot Scene A (p = 0.012) but returned to values lower than pre-fire on average during the Hot Scene B time period (p = 0.010). Much of the high pre-fire total VOC concentrations can be attributed to components of adhesives, solvents, and paint (e.g., Propanoic acid, 2-methyl-, 3-hydroxy-2,2,4-trimethylpentyl ester, and 2,2,4-Trimethyl-1,3-pentanediol monoisobutyrate), as well as freshly installed carpeting, curtains, and kitchen cabinetry/countertops that may have been off-gassing.
Several aldehydes were detected in the pre-fire samples, but concentrations of all aldehydes other than hexanal and pentanal increased significantly (p < 0.05) during Hot Scene A measurements. By Hot Scene B, formaldehyde had largely returned to pre-fire levels, while acetaldehyde (p < 0.001), benzaldehyde (p = 0.004), and propanal (p = 0.005) remained significantly elevated above pre-fire levels. In all eight of the experiments where Hot Scene A measurements were collected, concentrations of formaldehyde were above the NIOSH Ceiling limit of 123 µg/m3 (0.1 ppm). None of the Hot Scene B concentrations exceeded this ceiling limit, though 17 were above the most conservative NIOSH work-shift REL of 20 µg/m3 (0.016 ppm). Also of note, 13 of the pre-fire measurements exceeded this REL, and the largest pre-fire concentrations were found in the common room, possibly due to the off-gassing of newly installed cabinetry and countertop in these rooms. While Hot Scene A concentrations of acetaldehyde were measured up to 3,360 µg/m3, none of the acetaldehyde concentrations exceeded the ACGIH ceiling limit of 45,000 µg/m3 (25 ppm).
Warm and cold scene vapors
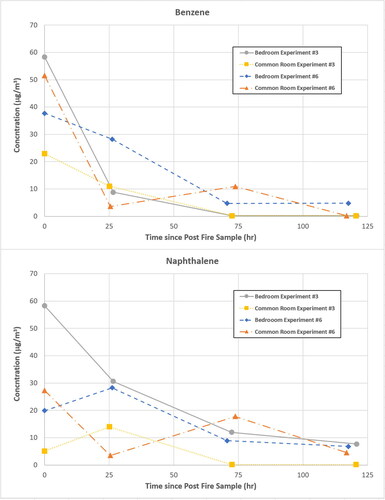
Benzene concentrations during the 1-day, 3-day, and 5-day post-fire investigation timeframes tend to decay from the relatively low levels in Hot Scene B to near non-detectable levels by the Cold Scene measurement period at the end of the experiment (). The Warm and Cold Scene trends for naphthalene concentrations were less consistent at 1 day post-fire but declined to below 10 µg/m3 by 5 days post-fire. The more heavily damaged Common Room Experiment #6 again displayed unique characteristics, particularly at 3-days post fire when additional ceiling material fell into the room being investigated.
Figure 5. Benzene (top) and naphthalene (bottom) 60-min time-weighted average concentrations (µg/m3) for four experiments including Hot Scene B (immediately post-fire sample at time = 0 hr), Warm Scene (1-day and 3-day post-fire samples at approximately 24 and 72 hr) and Cold Scene (5-day post-fire samples at approximately 120 hr).
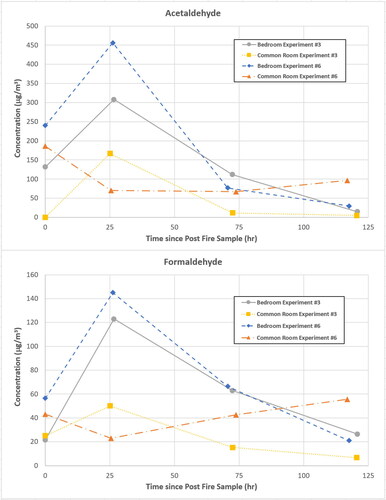
Acetaldehyde and formaldehyde concentrations during the 1-day post-fire investigation period were increased from the Hot Scene B measurements in three of the four experiments, prior to decaying to near pre-fire levels by the end of the experiment at 5 days post fire (). In Bedroom Experiment #3 and Bedroom Experiment #6, formaldehyde concentrations exceeded the NIOSH ceiling limit at 1-day post-fire and the NIOSH work-shift REL at 3 days post fire. Concentrations were typically lower in the common room experiments, possibly due to the proximity of the open door in that compartment which was used for egress. Common Room Experiment #6 again displayed unique characteristics, with an initial decrease in concentrations of both acetaldehyde and formaldehyde at 1 day post fire, but a subsequent increase after the partial ceiling collapse during the 3-day post-fire investigation period.
Figure 6. Acetaldehyde (top) and formaldehyde (bottom) 60-min time-weighted average concentrations (µg/m3) for 4 experiments including Hot Scene B (immediately post-fire sample at time = 0 hr), Warm Scene (1-day and 3-day post-fire samples at approximately 24 and 72 hr) and Cold Scene (5-day post-fire samples at approximately 120 hr).
Discussion
The most important findings of this study are that (1) elevated and hazardous levels of airborne particulate may be encountered during all phases of the post-fire scene investigation depending on the activities of the fire investigator and (2) airborne formaldehyde concentrations could exceed recommended exposure limits in extended phases of the post-fire investigation. This study provides the first controlled investigation experiment that allows fire scene investigation phases to be characterized from immediately after fire suppression through investigations that may occur up to 5 days after the fire. The fire damage that resulted from these experiments ranged from isolated damage with an obvious point of origin to full compartment involvement in fire even with identical fuel packages. This range of post-fire damage was considered to be typical based on authors’ experience who were also fire investigators GH, DM.
Particle concentrations throughout investigation
Exposure to fireground particulate has important health implications related to risks for both occupational cancer and sudden cardiac events, which are two of the primary health concerns in today’s fire service. Median PM2.5 levels encountered during Hot Scene B were 103.5 µg/m3 for all experiments and 191 µg/m3 for the subset of common room fires, which correspond to air quality index (AQI) values of 176 (Unhealthy) and 241 (Very Unhealthy) (AirNow.gov Citation2021). The lowest average PM2.5 concentration over the 60-min Hot Scene B timeframe was 16 µg/m3 (59 AQI – Moderate) while the highest was 498 µg/m3 (498 AQI – Hazardous). Note, AQI indices are based on 24-hr average outdoor concentrations and are intended for the general public, while these measurements are averaged over 1 hr. Still, the general public is encouraged to minimize their time outdoors (to lower their exposure time) when the AQI is at or exceeds the “Very Unhealthy” level.
The total particulate concentrations measured in this study (mean 211 µg/m3, median 127 µg/m3, range 19–823 µg/m3) are comparable to the nine total dust measurements reported by Sjostrom et al. (Citation2019) (mean 176 µg/m3, range 70–314 µg/m3). Likewise, Kinnes and Hine (Citation1998) measured respirable dust concentrations ranging from undetectable (<100 µg/m3) to 360 µg/m3 while the total dust concentrations ranged from 200 to 1,100 µg/m3 from four residential fire scenes (although one additional office fire where data was collected during time periods that appeared to be similar to Hot Scene A resulted in concentrations of 1,200 µg/m3 and 5,300 µg/m3, respectively). Finally, Fent et al. (Citation2013) reported widely varying PM10 concentrations during two largely identical simulated fire investigations (80 µg/m3 and 700 µg/m3). The current study compliments these small existing studies with a larger data set that includes a more detailed partitioning of particle dimensions. Additionally, the time resolved nature of these measurements allowed for the evaluation of transient events that led to increased particle levels, including handling drywall, furniture movement, and active shoveling.
By extending particulate data collection to several days after the immediate post-fire investigation period, important changes in concentration were determined. Peak concentrations from transient events were generally not as high as the immediate post-fire operations other than Common Room Experiment #6 when some additional ceiling collapsed. Importantly, at the 5-day post-fire investigation period, investigators actively removed drywall from the compartment ceilings and walls in order to inspect structural components and building systems that may have been compromised by the fire. During these days, the median respirable and total particulate levels over the 60-min investigation period were 826 µg/m3 and 1,841 µg/m3 with peak levels of 20,950 µg/m3 and 47,050 µg/m3.
Particulate in the respirable size range are capable of penetrating and depositing into the gas exchange regions of the respiratory system (Donaldson et al. Citation1998). While the exact composition of this particulate was not determined in this study, it would likely be composed of large hydrocarbon molecules and a variety of adsorbed toxicants. Epidemiologic studies have consistently shown strong associations between elevations in ambient fine particulate concentrations and increases in hospital admissions and mortality rates in the general population (Dockery et al. Citation1993; Seaton et al. Citation1995; Pope and Dockery Citation2006). In the fire service, exposure to particulate hazards has been proposed as an important contributing factor for sudden cardiac events (Baxter et al. Citation2010; Smith et al. Citation2013; Citation2016).
These results highlight the need for particulate respiratory protection during all phases of the fire investigation process, particularly when drywall is being removed or handled. In the fire service, terminology related to a “cold scene” or “cold zone” typically refer to a hazard-free condition, which may not be appropriate considering the particulate risks encountered during these fire investigation activities. Furthermore, while this study has focused on post-fire investigations, this information may also be useful to inform post-fire reconstruction occupations who are likely to be pulling down smoke- and fire-damaged drywall as they rehab the buildings.
Vapor concentrations throughout investigation
Many of the existing fireground exposure studies in the literature focus on PAH and VOC contamination, specifically naphthalene and benzene. For the investigation timeframes reported in this study, the concentrations of VOCs are low relative to exposure limits, particularly for Hot Scene B, Warm and Cold Scenes. The magnitude of benzene and naphthalene in Hot Scene B timeframe are slightly higher than concentrations found in the fire investigations reported by Sjostrom et al. (Citation2019)—30.6 vs. 19.3 µg/m3 and 9.9 vs. 4.6 µg/m3—but in both studies, concentrations were well below applicable exposure limits. Kinnes and Hine (Citation1998) reported similar naphthalene concentrations as our study (30 and 36 µg/m3) in the two residential fire scenes they studied. In two staged experiments where investigation occurred more rapidly after fire suppression, naphthalene increased to 99 and 200 µg/m3, which is within the range of Hot Scene A concentrations measured here.
The Hot Scene A measurements are best compared to studies evaluating overhaul exposures. During overhaul of a residential fire structure, Fent et al. (Citation2018) reported benzene concentrations of approximately ∼210 µg/m3 (0.065 ppm), which is slightly higher than 139 ± 79 µg/m3 measured in Hot Scene A here. The overhaul period in Fent et al. (Citation2018) lasted 11–19 min compared to the 30–41 min Hot Scene A period here which likely allowed more time for smoke dissipation. Bolstad-Johnson et al. (Citation2000) measured benzene in 53 of the 95 samples collected during overhaul, but average values among the detectable samples was 1,230 ± 1,365 µg/m3 (0.383 ± 0.425 ppm). During overhaul, Fent et al. (Citation2018) did not report any benzene concentrations over STEL, while Bolstad-Johnson et al. (Citation2000) reported two of 25 fires exceeded STEL. In this study, benzene samples found in Hot Scene A were not above the STEL. Bolstad-Johnson et al. (Citation2000) measured naphthalene at similar concentrations to what was reported in Hot Scene A. Overall, the concentration of the PAH and VOC compounds most commonly reported during overhaul activities are similar to those measured during Hot Scene A. This study shows a relatively consistent decline in concentrations from Hot Scene A to Hot Scene B, then in Warm and Cold Scene investigation periods. In all cases, the concentrations remained below applicable exposure limits.
However, aldehyde results present a different picture, with formaldehyde concentrations detected above the most protective work-shift REL and even exceeding the NIOSH Ceiling limit in multiple timeframes and experiments. During overhaul, Bolstad-Johnson et al. (Citation2000) reported detectable levels of formaldehyde in 86 of 96 samples collected with average concentrations of 307 ± 309 µg/m3 (0.25 ± 0.252 ppm) and maximum concentrations reaching 1,450 µg/m3 (1.18 ppm). The average sample concentration exceeded the NIOSH Ceiling limit and was similar, though slightly lower than our Hot Scene A concentrations (420.5 ± 25.6 µg/m3). Additionally, Bolstad-Johnson et al. (Citation2000) reported detectable levels of acetaldehyde in 71 of 96 samples collected with average concentrations of 615 ± 740 µg/m3 (0.34 ± 0.41 ppm) and maximum concentrations reaching 3,160 µg/m3 (1.75 ppm). Acetaldehyde had the highest detection rate and overall concentration levels and again was lower than our results (1,389 ± 940 µg/m3).
While the concentration of all aldehyde compounds dramatically declined from Hot Scene A to Hot Scene B, the formaldehyde levels remained above the NIOSH work-shift REL for a majority of the experiments. Furthermore, concentrations of formaldehyde were found to have increased beyond the Hot Scene B levels during subsequent investigation periods at 1 day and 3 days post-fire for several experiments. For both Bedroom Experiments #3 and #6, these values exceeded the NIOSH Ceiling limit at 1-day post. In three of these four experiments, detectable levels of formaldehyde remained at 5 days post-fire.
Current guidance for practicing fire investigators recommends the use of “Multi-gas area monitoring, including VOCs, PAHs, oxygen enrichment/deficiency, carbon monoxide, and hydrogen sulfide” (International Association of Arson Investigators Citation2020). Based on the results of this study, the authors would suggest that investigators also regularly monitor for formaldehyde in addition to the other compounds on this list to determine appropriate control measures such as respiratory protection. Many four-gas and six-gas monitors carried in the fire service do not contain sensors for this compound. Previous studies have shown that typical fire service monitoring for compounds such as carbon monoxide, oxygen, or hydrogen sulfide is not adequate to warn of the presence of other compounds such as formaldehyde. Additionally, these findings reinforce the need to consistently wear respiratory protection throughout the post-fire scene investigation. SCBA provides the highest level of respiratory protection from aldehydes, particulate and other unknown airborne hazards, however, use of SCBA isn’t always feasible during investigations due to logistics of maintaining air supply over long duration activities. The feasibility of using alternative respiratory protection measures such as powered air purifying respirators or full-face respirators with a CBRN cartridge should be studied for their application in this occupation. The results of this study support adding to the IAAI guidance the importance of vapor protection from formaldehyde at least through the Warm Scene investigation period.
Limitations
While this study greatly expands the available data for estimating risk during post-fire scene investigation, there are important limitations to consider. The number of samples collected remains relatively small, particularly with datasets focused on Warm and Cold Scenes. And while the data presented in this study are more tightly grouped than samples collected from field studies such as Bolstad-Johnson et al. (Citation2000) and Sjostrom et al. (Citation2019), important variability remains. Additionally, fire investigation activities were similar during these measurement periods other than Hot Scene A, but the actions taken did vary based on timing and amount of scene disturbance deemed necessary by the investigators during their observations. Finally, it is likely that varying levels of airborne contaminants would have been measured with different fuel packages and if other contaminants such as flame retardants or per- and polyfluoroalkyl substances (PFAS) were specifically targeted.
Future work
Future studies could expand on this area air sampling study by collecting data from personal air concentrations during specific investigation activities. It is also recommended that future studies characterize the presence of other contaminants of interest including asbestos fibers (or surrogates) isocyanates, flame retardants and PFAS and the potential for all of these compounds to cross-contaminate tools, vehicles and fire stations. Additionally, efforts to quantify chemical absorption during an investigation through biomonitoring could identify relative risk of exposure through dermal absorption or inhalation routes. These studies can improve fire investigators design and use of PPE. Finally, this work suggests the importance of studying exposure for post-fire reconstruction workers and insurance adjustors as well as canines used as accelerant detection animals during investigations.
Conclusions
This study provides the first series of controlled investigation experiments that allows fire scene investigation phases to be related to previously reported overhaul concentrations and extended out to 5 days after the fire. Elevated and hazardous levels of airborne particulate may be encountered during all phases of the post-fire scene investigation and depends on the activities of the fire investigator as much as the time since the fire. High levels of particulate across the size ranges measured here were noted when drywall was removed from the structure, highlighting the need to protect fire investigators’ airway from particulates any time this activity is conducted. Airborne concentrations of aldehydes were often higher than VOCs. While airborne concentrations of benzene and naphthalene are often reported in highest concentrations during live fire response and training, formaldehyde and acetaldehyde concentrations appeared to be the most predominant compounds (relative to their exposure limits) in Hot Scene A through Cold Scene investigation timeframes. In fact, it was found that formaldehyde concentration could exceed recommended exposure limits in several phases of the investigation, including ceiling limits during Hot Scene A and the 1-day post fire Warm Scene investigation session. This finding reinforces the importance of including vapor protection from formaldehyde at least through the Warm Scene investigation while also possibly carrying monitors to detect formaldehyde during investigations and potentially post-fire reconstruction activities. Furthermore, findings of high levels of particulate throughout all phases of investigation highlights the importance of post-investigation decontamination of PPE (on scene preliminary exposure reduce measures and advanced cleaning) and skin (including on-scene clean up and/or wipes as well as showering as quickly as possible).
Supplemental Material
Download MS Word (19.9 KB)Acknowledgments
The authors thank Sameual Horner and Nelson Tirado for their hard work in data collection and support from Mark Carpenter throughout the project. Craig Weinschenk, Keith Stakes, Jack Regan, Julie Bryant, Nick Dow, Joe Willi, Sarah Huffman, and the rest of the UL FSRI staff are thanked for planning and conducting the firefighting tactics experiments that produced investigation scenes studied in this work as well as supporting this collaboration. We would also like to thank Jeff Pauley and Barry Grimm of IAAI, Frank Leeb from FDNY, and Timothy Graves of the NYS Division of Homeland Security & Emergency Services for the guidance and insight provided during the design and conduct of these experiments.
Disclosure statement
There are no conflicts of interest regarding this work. The findings and conclusions are those of the author(s) and do not necessarily represent the official position of National Institute for Occupational Safety and Health, Centers for Disease Control and Prevention. Mention of any company or product does not constitute endorsement by the National Institute for Occupational Safety and Health, Centers for Disease Control and Prevention.
Additional information
Funding
References
- AirNow.gov. 2021. AQI Calculator; [accessed 2021 May 2]. https://www.airnow.gov/aqi/aqi-calculator-concentration/.
- Austin CC, Wang D, Ecobichon D, Dussault G. 2001a. Characterization of volatile organic compounds in smoke at experimental fires. J Toxicol Environ Health A. 63(3):191–206. doi:https://doi.org/10.1080/15287390151101547
- Austin CC, Wang D, Ecobichon D, Dussault G. 2001b. Characterization of volatile organic compounds in smoke at municipal structural fires. J Toxicol Environ Health A. 63(6):437–458.
- Baxter CS, Hoffman JD, Knipp MJ, Reponen T, Haynes E. 2014. Exposure of firefighters to particulates and polycyclic aromatic hydrocarbons. J Occup Environ Hyg. 11(7):D85–91. doi:https://doi.org/10.1080/15459624.2014.890286
- Baxter CS, Ross CS, Fabian T, Borgerson JL, Shawon J, Gandhi PD, Dalton JM, Lockey JE. 2010. Ultrafine particle exposure during fire suppression-is it an important contributory factor for coronary heart disease in firefighters? J Occup Environ Med. 52(8):791–796. doi:https://doi.org/10.1097/JOM.0b013e3181ed2c6e
- Bolstad-Johnson DM, Burgess JL, Crutchfield CD, Storment S, Gerkin R, Wilson JR. 2000. Characterization of firefighter exposures during fire overhaul. AIHAJ. 61(5):636–641. doi:https://doi.org/10.1080/15298660008984572
- Daniels RD, Bertke S, Dahm MM, Yiin JH, Kubale TL, Hales TR, Baris D, Zahm SH, Beaumont JJ, Waters KM, et al. 2015. Exposure–response relationships for select cancer and non-cancer health outcomes in a cohort of US firefighters from San Francisco, Chicago and Philadelphia (1950–2009). Occup Environ Med. 72(10):699–706. doi:https://doi.org/10.1136/oemed-2014-102671
- Daniels RD, Kubale TL, Yiin JH, Dahm MM, Hales TR, Baris D, Zahm SH, Beaumont JJ, Waters KM, Pinkerton LE, et al. 2014. Mortality and cancer incidence in a pooled cohort of US firefighters from San Francisco, Chicago and Philadelphia (1950-2009). Occup Environ Med. 71(6):388–397. doi:https://doi.org/10.1136/oemed-2013-101662
- Dockery DW, Pope CA, Xu X, Spengler JD, Ware JH, Fay ME, Ferris BG, Speizer FE. 1993. An association between air pollution and mortality in six U. N Engl J Med. 329(24):1753–1759. doi:https://doi.org/10.1056/NEJM199312093292401
- Donaldson K, Li XY, MacNee W. 1998. Ultrafine (nanometer) particle mediated lung injury. J. Aerosol Sci. 29(5–6):553–560. doi:https://doi.org/10.1016/S0021-8502(97)00464-3
- Engelsman M, Toms L-ML, Banks APW, Wang X, Mueller JF. 2020. Biomonitoring in firefighters for volatile organic compounds, semivolatile organic compounds, persistent organic pollutants, and metals: A systematic review. Environ Res. 188:109562.
- Fent KW, Eisenberg J, Evans D, Sammons D, Robertson S, et al. 2013. Evaluation of dermal exposure to polycyclic aromatic hydrocarbons in fire fighters. (Report #2010-0156-3196). Cincinnati (OH): U.S. Department of Health and Human Services.
- Fent KW, Evans DE, Babik K, Striley C, Bertke S, Kerber S, Smith D, Horn GP. 2018. Airborne contaminants during controlled residential fires. J Occup Environ Hyg. 15(5):399–412. doi:https://doi.org/10.1080/15459624.2018.1445260
- Fent KW, Mayer A, Bertke S, Kerber S, Smith D, Horn GP. 2019. Understanding airborne contaminants produced by different fuel packages during training fires. J Occup Environ Hyg. 16(8):532–543. doi:https://doi.org/10.1080/15459624.2019.1617870
- Fernando S, Shaw L, Shaw D, Gallea M, VandenEnden L, House R, Verma DK, Britz-McKibbin P, McCarry BE. 2016. Evaluation of firefighter exposure to wood smoke during training exercises at burn houses. Environ Sci Technol. 50(3):1536–1543. doi:https://doi.org/10.1021/acs.est.5b04752
- Gainey SJ, Horn GP, Towers AE, Oelschlager ML, Tir VL, Drnevich J, Fent KW, Kerber S, Smith DL, Freund GG, et al. 2018. Exposure to a firefighting overhaul environment without respiratory protection increases immune dysregulation and lung disease risk. PLoS One. 13(8):e0201830. doi:https://doi.org/10.1371/journal.pone.0201830
- Gill B, Britz-McKibbin P. 2020. Biomonitoring of smoke exposure in firefighters: a review. Curr Opin Environ Sci Health. 15:57–65. doi:https://doi.org/10.1016/j.coesh.2020.04.002
- Glass D, Sim M, Pircher S, Del Monaco A, Dimitriadis C, Miosge J. 2014. Final Report Australian Firefighters' Health Study. http://www.coeh.monash.org/downloads/finalreport2014.pdf.
- Hoppe-Jones C, Griffin SC, Gulotta JJ, Wallentine DD, Moore PK, Beitel SC, Flahr LM, Zhai J, Zhou JJ, Littau SR, Dearmon-Moore D, et al. 2021. Evaluation of fireground exposures using urinary PAH metabolites. J Expo Sci Environ Epidemiol. 31:913–922.
- Hornung RW, Reed LD. 1990. Estimation of average concentration in the presence of nondetectable values. Appl Occup Environ Hyg. 5(1):46–51. doi:https://doi.org/10.1080/1047322X.1990.10389587
- International Agency for Research on Cancer (IARC). 2010. Painting, firefighting, and shiftwork, in IARC monographs on the evaluation of carcinogenic risks to humans. Vol. 98. Lyon, France: World Health Organization.
- International Association of Arson Investigators, Inc. Health and Safety Committee. 2020. Fire investigator health and safety best practices. Bowie (MD): IAAI.
- Jalilian H, Ziaei M, Weiderpass E, Rueegg CS, Khosravi Y, Kjaerheim K. 2019. Cancer incidence and mortality among firefighters. Int J Cancer. 145(10):2639–2646. doi:https://doi.org/10.1002/ijc.32199
- Jankovic J, Jones W, Burkhart J, Noonan G. 1991. Environmental study of firefighters. Ann Occup Hyg. 35(6):581–602. doi:https://doi.org/10.1093/annhyg/35.6.581
- Keir JLA, Akhtar US, Matschke DMJ, Kirkham TL, Chan HM, Ayotte P, White PA, Blais JM. 2017. Elevated exposures to polycyclic aromatic hydrocarbons and other organic mutagens in Ottawa Firefighters participating in emergency, on-shift fire suppression. Environ Sci Technol. 51(21):12745–12755. doi:https://doi.org/10.1021/acs.est.7b02850
- Keir JLA, Akhtar US, Matschke DMJ, White PA, Kirkham TL, Chan HM, Blais JM. 2020. Polycyclic aromatic hydrocarbon (PAH) and metal contamiation of air and surfaces exposed to combustion emmisions during emergency fire suppression: implications for firefighters’ exposures. Sci Total Environ. 698:134211. doi:https://doi.org/10.1016/j.scitotenv.2019.134211
- Kinnes GM, Hine GA. 1998. Health hazard evaluation report: HETA-96-0171-2692, Bureau of Alcohol, Tobacco, and Firearms, Washington, DC. (Report #HETA 96-0171-2692). Cincinnati (OH): U.S. Department of Health and Human Services.
- Kirk KM, Logan MB. 2015. Firefighting instructors' exposures to polycyclic aromatic hydrocarbons during live fire training scenarios. J Occup Environ Hyg. 12(4):227–234. doi:https://doi.org/10.1080/15459624.2014.955184
- Lee DJ, Koru-Sengul T, Hernandez MN, Caban-Martinez AJ, McClure LA, Mackinnon JA, Kobetz EN. 2020. Cancer risk among career male and female Florida firefighters: evidence from the Florida Firefighter Cancer Registry (1981-2014). Am J Ind Med. 63(4):285–299. doi:https://doi.org/10.1002/ajim.23086
- LeMasters GK, Genaidy AM, Succop P, Deddens J, Sobeih T, Barriera-Viruet H, Dunning K, Lockey J. 2006. Cancer risk among firefighters: a review and meta-analysis of 32 studies. J Occup Environ Med. 48(11):1189–1202. doi:https://doi.org/10.1097/01.jom.0000246229.68697.90
- Pope CA, Dockery DW. 2006. Health effects of fine particulate air pollution: Lines that connect. J Air Waste Manag Assoc. 56(6):709–742. doi:https://doi.org/10.1080/10473289.2006.10464485
- Poutasse CM, Poston WSC, Jahnke SA, Haddock CK, Tidwell LG, Hoffman PD, Anderson KA. 2020. Discovery of firefighter chemical exposures using military-style silicone dog tags. Environ Int. 142:105818. doi:https://doi.org/10.1016/j.envint.2020.105818
- Pukkala E, Martinsen JI, Lynge E, Gunnarsdottir HK, Sparén P, Tryggvadottir L, Weiderpass E, Kjaerheim K. 2009. Occupation and cancer - follow-up of 15 million people in five Nordic countries. Acta Oncol. 48(5):646–790. doi:https://doi.org/10.1080/02841860902913546
- Seaton A, MacNee W, Donaldson K, Godden D. 1995. Particulate air pollution and acute health effects. Lancet. 345(8943):176–178. doi:https://doi.org/10.1016/s0140-6736(95)90173-6
- Sjostrom M, Julander A, Strandberg B, Lewne M, Bigert C. 2019. Airborne and dermal exposure to polycyclic aromatic hydrocarbons, volatile organic compounds, and particles among firefighters and police investigators. Ann Work Expo Health. 63(5):533–545. doi:https://doi.org/10.1093/annweh/wxz030
- Smith DL, Barr DA, Kales SN. 2013. Extreme sacrifice: sudden cardiac death in the US Fire Service. Extrem Physiol Med. 2(1):6. doi:https://doi.org/10.1186/2046-7648-2-6
- Smith DL, DeBlois JP, Kales SN, Horn GP. 2016. Cardiovascular strain of firefighting and the risk of sudden cardiac events. Exerc Sport Sci Rev. 44(3):90–97. doi:https://doi.org/10.1249/JES.0000000000000081
- Smith DL, Haller JM, Korre M, Fehling PC, Sampani K, Porto LGG, Christophi CA, Kales SN. 2019. The relation of emergency duties to cardiac death among US firefighters. Am J Cardiol. 123(5):736–741. doi:https://doi.org/10.1016/j.amjcard.2018.11.049
- Stec AA, Dickens KE, Salden M, Hewitt FE, Watts DP, Houldsworth PE, Martin FL. 2018. Occupational exposure to polycyclic aromatic hydrocarbons and elevated cancer incidence in firefighters. Sci Rep. 8(1):2476. doi:https://doi.org/10.1038/s41598-018-20616-6
- Tsai RJ, Luckhaupt S, Schumacher P, Cress R, Deapen D, Calvert G. 2015. Risk of cancer among firefighters in California, 1988-2007. Am J Ind Med. 58(7):715–729. doi:https://doi.org/10.1002/ajim.22466
- Weiss DC, Miller JT. 2011. A study on chemicals found in the overhaul phase of structure fires using advanced portable air monitoring available for chemical speciation. Tigard (OR): Tualatin Valley Fire & Rescue.
- Wingfors H, Nyholm J, Magnusson R, Wijkmark C. 2018. Impact of fire suit ensembles on firefighter PAH exposures as assessed by skin deposition and urinary biomarkers. Ann Work Expo Health. 62(2):221–231. doi:https://doi.org/10.1093/annweh/wxx097