
 ?Mathematical formulae have been encoded as MathML and are displayed in this HTML version using MathJax in order to improve their display. Uncheck the box to turn MathJax off. This feature requires Javascript. Click on a formula to zoom.
Abstract
Three-dimensional (3D) printing is an emerging and booming industry in Taiwan. Compared to traditional manufacturing, 3D printing has various advantages, such as advanced customization, additive manufacturing, reduced mold opening time, and reduced consumption of precursors. In this study, the real-time monitoring of particulate matter (PM) and total volatile organic compound (TVOC) emissions from various filaments is investigated using fused deposition modeling with material extrusion technology, a liquid-crystal display, a stereolithography apparatus based on vat photopolymerization technology, and binder jetting for occupational settings. An exposure assessment for nearby workers using the 3D printing process was performed, and improvement measures were recommended. Nine 3D printing fields were measured. The generation rate of ultrafine particles ranged from 1.19 × 10¹⁰ to 4.90 × 10¹² #/min, and the geometric mean particle size ranged from 30.91 to 55.50 nm. The average concentration of ultrafine particles ranged from 2.31 × 10³ to 7.36 × 10⁴ #/cm3, and the PM2.5 and PM10 concentrations in each field ranged from 0.74 ± 0.27 to 12.46 ± 5.61 μg/m3 and from 2.39 ± 0.60 to 30.65 ± 21.26 μg/m3, respectively. The TVOC concentration ranged from 0.127 ± 0.012 to 1.567 ± 0.172 ppm. The respiratory deposition (RDUFPs) dose ranged from 2.02 × 10¹³ to 5.54 × 10¹⁴ nm2/day. Depending on the operating conditions, appropriate control and protective measures should be employed to protect workers’ health.
Introduction
Recently, three-dimensional (3D) printing has become an emerging and booming industry in Taiwan. Unlike traditional manufacturing, 3D printing has many advantages, such as reducing material costs, simplifying the production process, customizing small-scale production, reducing material use, and improving efficiency (Kwon et al. Citation2017). According to the American Society for Testing and Materials (ASTM), 3D printing is a material bonding process. Computer-aided design (CAD) software is used to process 3D model data, and the materials are printed layer by layer to produce three-dimensional objects. The seven fundamental 3D printing technologies are vat photopolymerization (VP), material extrusion (ME), binder jetting (BJ), material jetting (MJ), powder bed fusion (PBF), direct energy deposition (DED), and sheet lamination (SL) (Stefaniak et al. Citation2017; Chen et al. Citation2020; Min et al. Citation2021; Stefaniak et al. Citation2021). The categories of domestic 3D printing technologies are shown in Figure S1 (Supplementary material).
A brief introduction to 3D printing technologies is as follows: vat photopolymerization (VP) uses ultraviolet laser light to irradiate liquid photocurable resins via a polymerization process. After irradiation, the resins change from liquid to solid and are stacked layer upon layer. VP can be divided into three categories: stereolithography apparatus (SLA), digital light processing (DLP), and liquid-crystal display (LCD) (Nugroho et al. Citation2021; Zhang et al. Citation2021). Material extrusion (ME) involves extrusion through a nozzle by applying pressure and heat. It is associated with a uniform cross-section and the desired stroke diameter. There are two common ME technologies, fused deposition modeling (FDM) and fused filament fabrication (FFF), which use high temperatures (200–240 °C) to melt filament materials, extrude the filament through the printing nozzle, and deposit the melted filament material upon heating of the build platform (Zisook et al. Citation2020; Hegab et al. Citation2023). Binder jetting (BJ) is usually performed on a powder in a machine, and then a single-layer pattern is printed by the nozzle. The binder is used to adhere to the powder layer. The materials fabricated by this technology include ceramics (glass or plaster) and metals (stainless steel). In material jetting (MJ), a liquid drop of photopolymer ink resin is commonly continuously injected via a print head nozzle onto the platform. The ink-like polymer resin is cured by ultraviolet illumination after the deposition process. The process is repeated layer upon layer to develop the products (Tan et al. Citation2020; Tyagi et al. Citation2022). Powder bed fusion (PBF) uses thermal energy to selectively fuze regions of a powder bed. This technique has two types: selective laser sintering (SLS) and selective laser melting (SLM). SLM requires the application of appropriate energy to the feedstock material to join layers together, while SLS operates by applying less energy to the feedstock material and fusing the layers on a molecular level (Singh et al. Citation2020; Stefaniak et al. Citation2021). Direct energy deposition (DED) uses an electron or laser beam as a heat source to melt the feedstock material, which is then deposited and fused on the melted substrate. Finally, the movement of the laser beam or an electron solidifies the materials (Pinheiro et al. Citation2021). Sheet lamination (SL) involves building materials and cutting methods. SL is classified into two types: “bond-then-form” and “form-then-bond” processes. It uses a polymer-based adhesive to bond the sheet materials (Nugroho et al. Citation2021).
Recently, the emission of hazardous pollutants (HPs) from 3D printing has gained attention due to potential health risks. According to previous studies, all 3D printing technologies except for DED and SL generate HPs, such as particulate matter (PM) and various types of volatile organic compounds (VOCs) (Stefaniak et al. Citation2017; Zhang et al. Citation2017). Various reports have suggested that PM emission rates increase with increasing nozzle temperature (Azimi et al. Citation2016; Steinle Citation2016; Jeon et al. Citation2020). High-temperature nozzles also lead to a significant change in concentration at the beginning of the boost (dramatic increase in emission) (Floyd et al. Citation2017; Zontek et al. Citation2017; Hayes et al. Citation2021). Commonly used filaments for 3D printing include polymers (thermoplastic), such as acrylonitrile butadiene styrene (ABS), polylactic acid (PLA), and polyethylene terephthalate glycol, with different composites and additives (Zhang et al. Citation2023). Previous research has shown that a printer using ABS filaments has a much higher PM emission rate than a printer using polylactic acid (PLA) feedstock, particularly ultrafine particles (UFPs) with an aerodynamic diameter less than 100 nm (Stephens et al. Citation2013; Azimi et al. Citation2016; Kwon et al. Citation2017; Zhang et al. Citation2019).
These nanoparticles can enter the alveoli of the human body and penetrate the alveoli into the blood circulation system, causing systemic health effects. PMs can cause allergic rhinitis, cough, asthma, breathing difficulties, cardiovascular disease (CVD), emphysema, damage to the alveoli, and lung malfunction (Warheit Citation2004; Oberdörster et al. Citation2005; Sioutas et al. Citation2005; Mokhtar et al. Citation2013; Zhang et al. Citation2017; Ding et al. Citation2019). In addition, 3D printing-induced PM emissions are affected by the environment of operation and parameters such as filling density, nozzle temperature, filament color, residence time, printing thickness, and printing speed (Azimi et al. Citation2016; Yi et al. Citation2016; Stabile et al. Citation2017; Manoj et al. Citation2021). Furthermore, most PM emitted during 3D printing is smaller than 100 nm in diameter (Vance et al. Citation2017; Zontek et al. Citation2017; Youn et al. Citation2019).
The VOCs generated from ABS filaments include styrene, 1,3-butadiene, and acrylonitrile, whereas polylactic acid and lactide come from PLA filaments (Stefaniak et al. Citation2017; Potter et al. Citation2019). Other VOCs are potentially produced from light-curable resins, which contain different VOC components due to additives and composites. These VOCs include benzaldehyde, acetone, 4-oxopentanal, and other VOCs (Du Preez et al. Citation2018; Davis et al. Citation2019; Stefaniak et al. Citation2019; Zisook et al. Citation2020). However, some studies have shown that other factors could affect the VOC emissions from the printing process. Examples include plasticizers, flame retardants, antioxidants, epoxy silanes, and other substances. In addition, filaments pyrolyzed during heating will generate semivolatile organic compounds, which could attach to the surface of particles (Gu et al. Citation2019; Stefaniak et al. Citation2019). Other studies have reported that the concentration of VOCs increased during the posttreatment process (Dunn et al. Citation2020; Viitanen et al. Citation2021); the main reason for this increase is most likely related to the emission of acetone and isopropanol, which are used in the posttreatment process for surface cleaning and smoothening (Manoj et al. Citation2021). The VOCs emitted from a 3D printer can potentially accumulate inside the casing and achieve a high concentration. (Stephens et al. Citation2013; Davis et al. Citation2019; Zhang et al. Citation2019). VOCs potentially cause respiratory damage, eye irritation, liver and kidney damage, reproductive system and cardiovascular damage, and cancer risks (Cristescu et al. Citation2011; Chan et al. Citation2018). Fortunately, there are some 3-D printers equipped with ventilation design to vent pollutants, but not all printers. However, the designs should be applied to all 3D printers (Viitanen et al. Citation2021).
Currently, there is no standard sampling method for 3D printing workplaces in Taiwan, and there is no on-site measurement data. Therefore, this study focuses on the research gaps in the exposure to PM and VOCs in 3D printing workplaces in Taiwan. This research aims to measure the exposure in real workplaces (on-site sampling), investigate the 3D printing pollution sources and their concentrations, and estimate their respiratory deposition dose. Finally, we suggest improvement strategies to reduce exposure and promote the health of 3D printing workers.
FDM, LCD, and SLA are gaining popularity among the public in Taiwan and are the most mainstream 3D printing technologies due to their convenient operation. Therefore, this study selected these three 3D printing technologies for investigation. The potential health risks of these hazardous pollutants to workers are a concern because 3D printing is now pervasive in everyday life and might pose health risks to consumers. Therefore, this study focused mainly on FDM, a type of ME technology; LCD and SLA, types of VP technology; and BJ. BJ was considered due to its use in domestic academic research institutions and the automobile, locomotive, and aerospace industries. Relevant information about the release of harmful substances during 3D printing operations was collected by examining the characteristics of 3D printing machines and the on-site operating environments in Taiwanese 3D printing industries. Pollutant exposure profiles and concentrations were measured in workplaces. The purpose of this study was to assess the exposure of workers in 3D printing workplaces in Taiwan.
Materials and methods
Sampling areas and their characteristics
Since ME and VP are the mainstream technologies on the market (Balletti et al. Citation2017), they are the focus of this study. The sampling areas of this study are five manufacturers (their products include survival game armor, lamp decoration, dolls, customized plastic objects, precision metal objects, etc.) and two academic institutes (teaching purposes) in Taiwan, and the conditions are established at various sites for real-time monitoring of the concentration changes during the printing process. The room volumes of the sampling areas ranged from 90 to 191 m3. The indoor temperatures were between 25.34 and 32.49 °C, and the relative humidity (RH) ranged from 47.1 to 64.8%. The specifications of the studied 3D printers and print setting parameters are summarized in , and the floor plan of one of the sampling areas (FDM02) among the 3D printing workplaces is shown in (the numbers from 1 to 5 are the sampling points for real-time monitoring of 3D printing emissions).
Figure 1. Floor plan of the FDM02 3D printing workplace.
The gray circles and the triangles represent the different types of 3D printers. The light-gray shapes represent operating printers, and the dark-gray shapes represent nonoperating printers. The numbers 1 to 5 indicate the sampling points. The sampling time for sampling point 1 was 2 hr, and those for sampling points 2, 3, 4, and 5 were 12 min. The timelines for the sampling points are shown in .
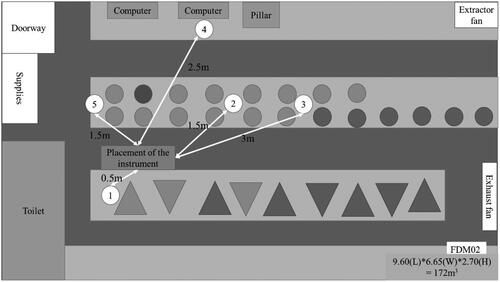
Table 1. Specifications of the studied 3-D printers and print conditions.
Emission measurement procedures
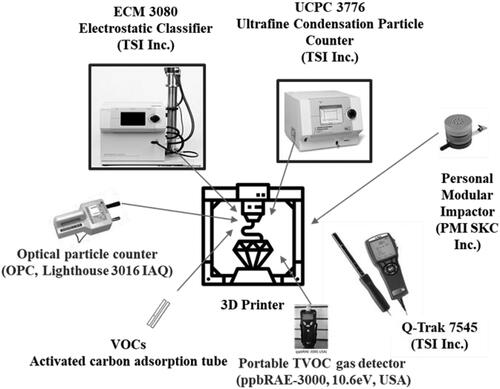
The particle concentration and size distribution in the 3D printing workplaces were monitored using a scanning mobility particle sizer (SMPS, Model 3936, TSI Inc., Shoreview, MN, USA) and optical particle counter (OPC, Model 3016 IAQ, Lighthouse Inc. USA). The VOC sampling method refers to the National Institute of Environmental Analysis of Taiwan “A71911C” and “A72170B,” and a constant-flow air sampling pump was used to draw the air samples to the activated carbon sampling tube (coconut shell charcoal, 100 mg/50 mg, 226–01–SKC, USA). The VOCs in the air samples adsorbed by the activated carbon sampling tube were extracted with an appropriate amount of organic solvent and a vibrator. Next, the extracts were injected into a gas chromatography–mass spectrometry (GC–MS) instrument to determine the concentrations of VOCs in the sampling areas. The analysis was conducted at the Environmental Technology Research Center, Yuan Ze University. The sampling probes of all the monitoring instruments were close to the nozzle of the 3D printers (approximately 1 m). This distance is suitable for operating 3D printers and observing printing situations, allowing better simulation of the exposure scenario of 3D-printed workers. The sampling procedure had three stages: Equation(1)(1)
(1) background measurement (9–60 min); Equation(2)
(2)
(2) the first point printing period (120 min to monitor the variation in emissions during the different 3D printing processes); and Equation(3)
(3)
(3) four additional points for spatial sampling (15 min for each sampling point). According to the questionnaire (provided in the supplementary material), the average operating time for 3D printing employees was approximately 3 hr, which is also their exposure time. Therefore, the overall sampling time was set as 3 h. The experimental setup is depicted in (Afshar-Mohajer et al. Citation2015).
Figure 2. Experimental setup for 3D printing in occupational settings.
Estimations of the emission rates
Emission of airborne particles
The airborne particle emission rate was calculated based on the mass-balance equation to estimate the number of particles generated per minute during the 3D printing process, and the influential factors included the on-site ventilation rate and field size. Assuming uniform indoor air mixing, the particle emission rate was estimated using EquationEquation (1)(1)
(1) .
(1)
(1)
where:
G = the particulate emission rate (#/min)
V = the room volume of each field (cm3)
Q = the ventilation flow (cm3/min)
Cinput = the particle number background concentration (#/cm3)
C = the particle number concentration (#/cm3).
Emission of TVOCs
The concentration of the VOCs in the solvent extract after the VOC fields were desorbed from the activated carbon adsorption tube was reported in units of mg/L. The VOC concentration unit was converted to mg/m3 using EquationEquation (2)(2)
(2) .
(2)
(2)
where:
Cair = the VOC concentration in the air (mg/m3)
C1 = the VOC concentration of the extract obtained from the activated carbon adsorption tube (mg/L)
E = the volume of the extract (0.001 L)
QF = the sampling flow (m3/min)
t = the sampling time of the VOC adsorption tube (approximately 180 min)
T = the average indoor temperature in each field (°C)
Pa = the atmospheric pressure.
Exposure and health risk assessment
UFP inhalation exposure assessment
The assessment of UFP inhalation exposure was based on three hundred questionnaires completed by 3D printing staff. The correlation between the surface area of the UFPs and the health effect is better than that between the mass concentration of the UFPs and the health effect (Yu et al. Citation2015). The following formula was used to convert the particle surface area concentration into respiratory deposition (RD) (Sze-To et al. Citation2012). The respiratory deposition dose of the UFPs (RDUFPs) considered that most particles emitted from 3D printing had aerodynamic diameters less than 100 nm, and the particle size range was focused on particles <100 nm in this study by applying EquationEquation (3)(3)
(3) .
(3)
(3)
where:
PMsurface = the average particle surface area concentration (nm2/m3) measured by the scanning mobility particle sizer (SMPS) in the 3D printing workplaces
IR = the inhalation rate (m3/day)
DF = the deposition fraction.
DF was estimated by summing the head airways (HA), tracheobronchial (TB), and alveolar regions (AL), as shown in the following equation:
(4)
(4)
where
DFHA = the deposition fraction in head airways, calculated as follows:
(5)
(5)
where:
dp = the particle diameter in µm
IF = the inhalable fraction is given by EquationEquation (6)(6)
(6) (Sharma and Balasubramanian Citation2020):
(6)
(6)
DFTB = the deposition fraction in the tracheobronchial region, calculated as follows (Hinds and Zhu Citation2022):
(7)
(7)
DFAL = the deposition fraction in the alveolar region, calculated as follows (Hinds and Zhu Citation2022):
(8)
(8)
TVOC carcinogenic risk assessment
The increase in inhalation unit risk [inhalation unit risk (per mg/m3)] was calculated by multiplying by the average concentration of inhaled carcinogenic air pollutants (Cair mg/m3). Cair is the 180-min average concentration at the first point of sampling. The parameters for TVOC carcinogenic risk assessment were based on the results obtained from three hundred questionnaires completed by 3D printing staff. The slope factors for each possible exposure to contaminants were calculated using Equations (9) and Equation(10)(9)
(9) . The carcinogenic risk reference concentrations and carcinogenic risk factors for pollutants that can potentially be detected in 3D printing workplaces are summarized in Table S2 (Supplementary material).
(9)
(9)
Or
(10)
(10)
where:
Cair = the VOC concentration (mg/m3) measured in the 3D printing workplaces.
CDI = the chronic daily intake or average daily inhalation dose over 70 years (mg/kg-day) based on the questionnaires completed by 300 3D printing workers.
SF = the slope factor, mainly referring to past literature and suitable for expressing the slope of the dose–response relationship (mg/kg-day)−1
ED = exposure duration (18 to 70 years, 53 years)
EF = exposure frequency (5 days of work per week, 52 wk per year) (day/year)
AT = average time to exposure (70 years = 25,567 days).
TVOC noncarcinogenic risk assessment
The reference concentration of chemical substances [mg/m3-day]−1 (RfC) was calculated using the following equation:
(11)
(11)
where:
NOAEL = the no observed adverse effect level
LOAEL = the lowest observed adverse effect level
UF = the uncertainty factor
MF = the modifying factor.
The hazard quotient (HQ) is the ratio of exposure to a chemical substance to the reference concentration of the chemical substance and is assessed in terms of the noncarcinogenic risk.
(12)
(12)
where: CDI = the long-term daily intake dose, exposure to chemical substances, or exposure dose (mg/kg-day) estimated based on the measurements performed in the 3D printing workplace and the results of three hundred questionnaires (supporting information) completed by 3D printing staff.
If there are multiple exposure routes for noncarcinogenic substances, the hazard index (HI) can be used to quantify the risk of noncarcinogenic substances:
(13)
(13)
The hazard risk is acceptable when the HI is less than 1. If the relative HI value is greater than 1, the hazard risk is unacceptable. A greater hazard index HI corresponds to greater noncarcinogenic harm to the human body.
Results and discussion
PM and TVOC profiles during 3D printing activities
The estimated PM and VOC concentrations during 3D printing activities in occupational settings are listed in . The emission rate and RDUFPS were determined considering that the emission characteristics of 3D printing are less than 100 nm. When FDM is used, the filament emission pollution shows the same trend with ABS > polyethylene terephthalate glycol (PETG) >PLA. Both LCD and SLA methods using photocuring technology (Quan et al. Citation2020) indicate high VOC concentrations due to the solvent used in the resin and printing process. The sampling area in which the BJ printer is used has more particle control equipment in place, such as box sealers, high-efficiency particulate air (HEPA) filters, filtered vacuum cleaners, and dust removers. As a result, the particle number concentration for the BJ printer was the lowest among all areas, but there was no control equipment for VOCs.
Table 2. Estimation of particulate matter and TVOCs during 3D printing in occupational workplaces.
Temporal particle size distribution
The monitoring data of the temporal particle size distribution of submicron particles for various sampling areas (FDM01, FDM02, FDM03, FDM04, FDM05, and FDM06) at their occupational settings are shown in and and Figures S1, S4, S2, and S3 (Supplementary material), respectively. The emission rates of nanoparticles in these fields are shown in . Before the beginning of printing, the number concentration and particle size distribution in all areas were relatively stable and had no significant changes. During the printing process, the printed objects were all stretched, and the thermoplastic filament melted at a high temperature, which generated hazardous pollutants.
Figure 3. Temporal submicron-particle size distribution for FDM01.
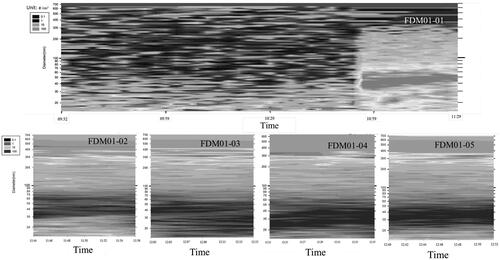
Figure 4. Temporal submicron-particle size distribution for FDM03.
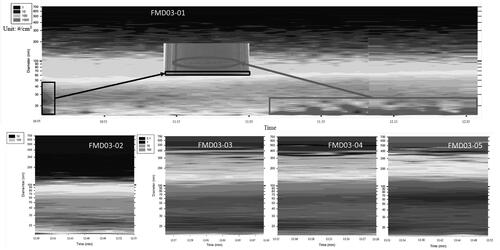
The overall average particle number concentrations in the sampling areas (FDM01, FDM02, FDM03, FDM04, FDM05, and FDM06) are shown in . Compared to the background particle number concentration (1.99 × 10³ #/cm3), all the areas showed an increasing trend. Compared to reported literature values for FDM01, FDM03, and FDM06, the particle number concentrations were lower, which might be due to the filament materials used, on-site control measures, and the distance from the printers to the exhaust fan (Floyd et al. Citation2017; Mendes et al. Citation2017; Stefaniak et al. Citation2021). In addition, the number concentration of particles produced by the ABS filament in the FDM03 area was 2.65 × 10⁴ #/cm3, which was approximately ten times higher than that in the FDM01 and FDM02 areas. The high-temperature nozzle was in direct contact with a filament at room temperature; this contact potentially caused thermal cracking of the filament, which generated nanoparticles. For example, the UFP concentration increased sharply after approximately 85 min (10:57). This was speculated to be due to the increased temperature setting of the printers at that time point, which made the molten filament fail to cool in time after extrusion, resulting in the generation of particles. In addition, at the beginning of printing (FDM03-01), it was found that the number of particles increased abruptly, and the particle size range was concentrated below 40 nm, as shown in . When printing the bottom support of an object, the temperature and printing density of the printer were increased to fix the object, and these settings resulted in higher UFP emissions. In addition, at 11:35, it was found that the particle concentration was concentrated below 20 nm, and the number concentration showed an increasing trend (FDM03-01). The possible reasons for this finding were that there were some problems in the extrusion process (e.g., the filament was stuck due to an inappropriate nozzle temperature) and more UFPs were generated, so the extruded materials were not completely bonded, which resulted in defects in the printed object, as shown in . Similarly, in FMD04, the nozzle extruded the molten filament in a suspended state due to misalignment of the printing position during the printing process, as shown in Figure S4 (Supplementary material).
In addition, the number concentration of nanoparticles increased with the sampling time at the FDM05 area due to an instantaneous high-voltage laser light source cutting wood (it is often used in a Maker workplace) nearby (Supplementary material,).
Similarly, the number concentration of the particles increased with the sampling time in the FDM06 area due to its low ventilation rate. Thus, the ventilation conditions of each workplace should be considered due to the potential health risks for workers. In all areas, the particle sizes were uniformly distributed below 300 nm, and the particle size was concentrated below 100 nm. The geometric mean diameter (GMD) and particle size range in all the areas are illustrated in and Figures S15–S20 (Supplementary material). Similar GMD results for nanoparticles have been reported by Gu et al. (Citation2019) and (Floyd et al. Citation2017) for the FDM02 and FDM03 areas, respectively, indicating that the FDM process emits nanoparticles with similar size distributions.
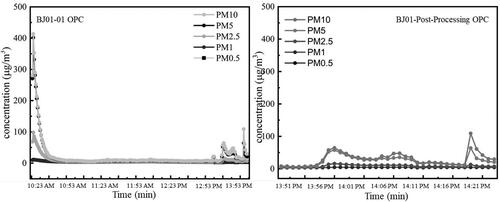
Similarly, the temporal particle size distributions of submicron particles in the LCD01, SLA01, and BJ01 areas are shown in , respectively. The emission rates of the nanoparticles were 2.33 × 10¹⁰ #/min, 2.07 × 10¹¹ #/min and 1.19 × 10¹⁰ #/min in the LCD01, SLA01 and BJ01 areas, respectively. Compared to the background particle number concentration (7.25 × 10³ #/cm3) in other 3D printer workplaces, much lower submicron-particle pollution was generated in the BJ01 area; BJ01 and BJ01 postprocessing was performed via a vacuum cleaner connected to a HEPA filter and positive-pressure personal respiratory protective equipment (PRPE) (Mostafaei et al. Citation2021), respectively, which were used to prevent the escape of most submicron particles and reduce the exposure to SUS-630 particles (a kind of stainless steel particle for BJ 3D printing). However, the vacuum cleaner also created a strong airflow that might produce internal turbulence during powder removal, causing indoor dust resuspension.
Figure 5. Temporal submicron-particle size distribution for LCD01.
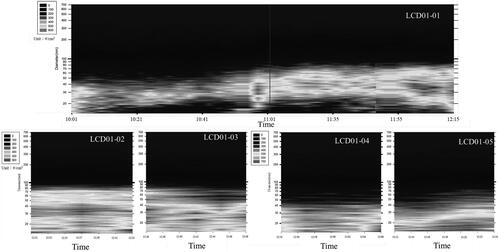
Figure 6. Temporal submicron-particle size distribution for SLA01.
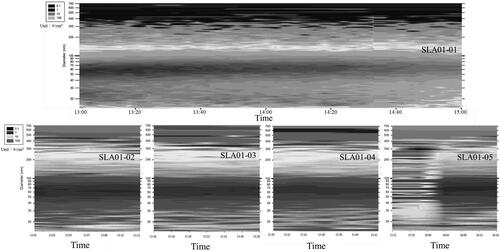
Figure 7. Temporal submicron-particle size distribution for BJ01.
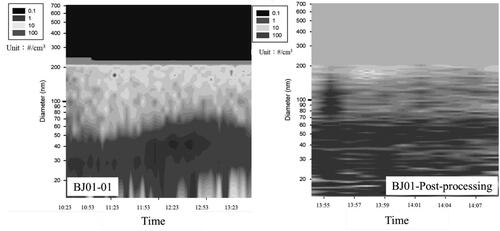
The average particle number concentration is shown in . The nanoparticle concentration for the LCD01 area was increased in different sampling time durations. This was potentially due to the isopropanol used in the posttreatment process and the overloading of the power supply on-site. The isopropanol was heated to remove the unformed resin on the 3D-printed object’s surface; this process formed aerosol particles due to condensation and resulted in a higher particle concentration and an increase in particle size. Emitted particles >300 nm were unable to be collected in the SLA01 area due to the nucleation and condensation of evaporated liquid light-curing resin, solvent, and additives. The GMD and particle size ranges in the areas are shown in and Figures S21–S23 (Supplementary material).
Instantaneous suspended particulate mass concentration
The temporal concentrations of PM in the various areas (FDM01, FDM02, FDM03, FDM04, FDM05, FDM06, LCD01, SLA01, and BJ01) at the workplace are displayed in . In all areas, the mass concentration of PM with a diameter below 2.5 µm was relatively stable, while the concentrations of PM2.5, PM5, and PM10 fluctuated significantly, which could be related to the resuspension of ground dust caused by the activities of on-site monitoring personnel.
Figure 8. Temporal PM concentration variation for FDM01 at the workplace.
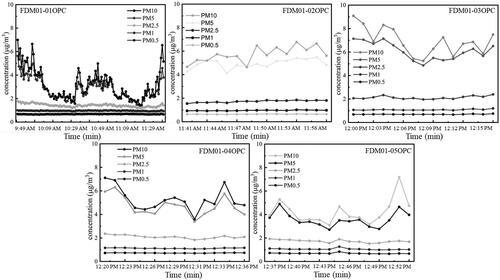
Figure 9. Temporal PM concentration variation for FDM02 at the workplace.
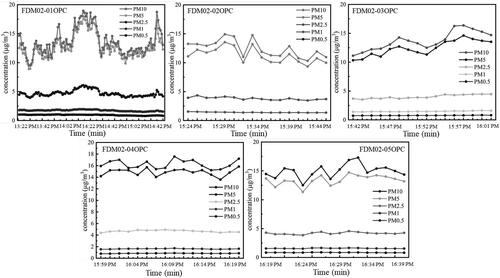
Figure 10. Temporal PM concentration variation for FDM03 at the workplace.
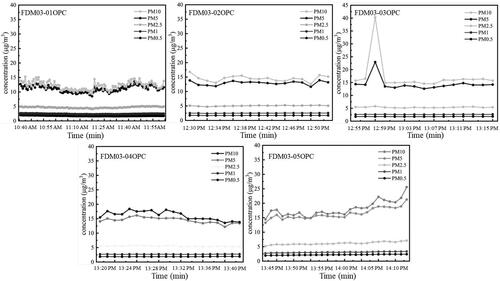
Figure 11. Temporal PM concentration variation for FDM04 at the workplace.
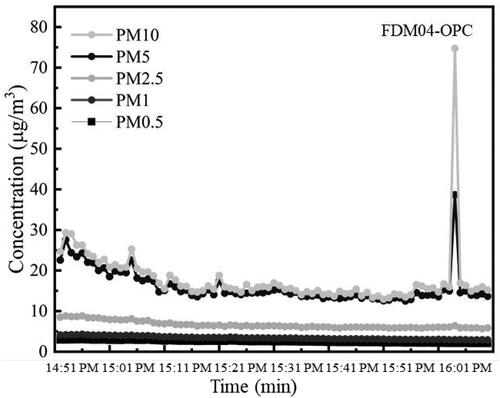
Figure 12. Temporal PM concentration variation for FDM05 at the workplace.
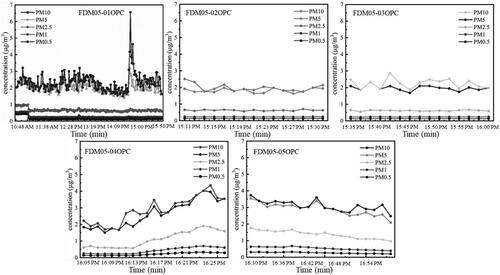
Figure 13. Temporal PM concentration variation for FDMO6 at the workplace.
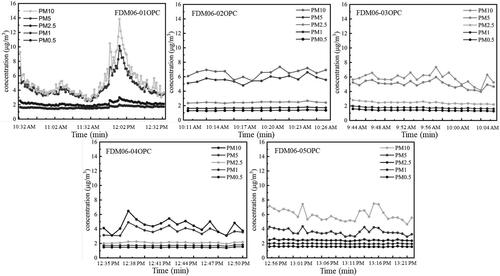
Figure 14. Temporal PM concentration variation for LCD01 at the workplace.
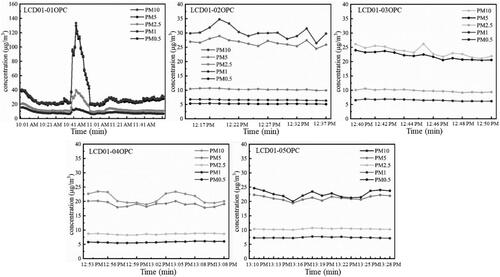
Figure 15. Temporal PM concentration variation for SLA01 at the workplace.
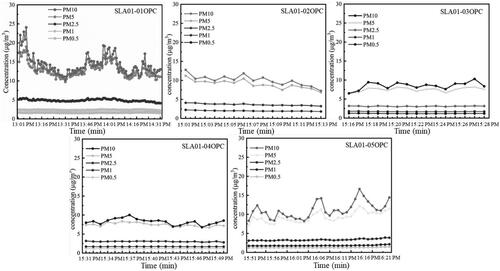
Figure 16. Temporal PM concentration variation for BJ01 at the workplace.
Emission rate of TVOCs
The temporal variations in TVOC concentrations in the FDM01, FDM02, FDM03, FDM04, FDM05, FDM06, LCD01, SLA01, and BJ01 areas are shown in Figures S5–S13 (Supplementary material). The average TVOC concentrations in these occupational settings were 372, 127.2, 407.4, 546, 402, 1,567, 1,434, 378, and 1,018 ppb for the FDM01, FDM02, FDM03, FDM04, FDM05, FDM06, LCD01, SLA01, and BJ01 areas, respectively. The TVOC concentrations in the FDM06, LCD01, and BJ01 areas were higher than those in the other fields. A possible reason is poor ventilation and the prefilling of LCD raw materials, including solvents and resins. The individual VOCs of all 3D printers are presented in , and none of them exceeded the “Standard of Permissible Exposure Limit at Job Site” (Taiwan, https://law.moj.gov.tw/index.aspx).
Table 3. Detection of VOCs during 3D printing in occupational settings.
Exposure assessment and risk estimation
Previous studies suggested that nanoparticle toxicity should be correlated with the surface area concentration (Oberdörster Citation2000), and this study calculated RDUFPs using formula conversion. In addition, most particles generated during 3D printing are nanoparticles. Therefore, the surface area concentration of the particles is more suitable for estimating the incremental lifetime carcinogenic risk (ILCRUFPs), and the assessment results are summarized in .
The estimated carcinogenic risk of VOCs in each area is summarized in Table S4 (Supplementary material). The risk results were obtained using EquationEquations (2)(2)
(2) and Equation(10)
(9)
(9) . All the results were below the acceptable level (<10−6) (Mohammadi et al. Citation2019). However, increasing the air exchange rates of the FDM05, FDM06, and BJ01 areas could reduce carcinogenic risk because the risk in these workplaces was higher than in other measurement sites.
The estimated noncarcinogenic risk of VOCs in each area is summarized in Table S5 (Supplementary material). Most areas investigated in this study had a noncarcinogenic hazard quotient (HQ) due to a VOC exposure of less than 1, which is within an acceptable range. However, the indoor air exchange rates of the FDM05, FDM06, and BJ01 areas were too low, and thus, improving the air exchange rate is recommended. For the FDM06 area, the HI (1.98) was greater than 1, indicating an unacceptable noncarcinogenic hazard to the occupants. Therefore, improving the working environment and reducing the exposure time is necessary to decrease the noncarcinogenic risk.
Limitations
Because this study was conducted during the level 3 alert for COVID-19 in Taiwan, the overall sampling willingness was not high, and some of the production processes were confidential. In addition, there were many potential confounding factors, such as nearby pollution sources other than 3D printers, affecting the measurement results of PM and VOC emissions during 3D printing. Thus, further research will be needed to consider potential confounding factors near 3D printers. Moreover, filaments for 3D printers are continuously being developed, and numerous new filament materials are created every year. Therefore, the emissions for the filaments used in this study are not standard for all technologies.
Furthermore, epidemiological studies could be conducted to validate the potential health hazards associated with 3D printing work.
Conclusion
In this study, we investigated the emission characteristics of PM and VOCs based on real-time monitoring during the 3D printing process and assessed the exposure of workers in 3D printing workplaces in Taiwan. The formation pathways of emission from 3D printing were thermal decomposition, aerosolization, and the use of organic solvents during feedstock deposition and posttreatment processes. Most nanoparticles produced by the 3D printer had similar GMDs and emission rates as observed in previous studies conducted in the laboratory, verifying that the calculation model could be applied to predict the UFP concentration in the 3D printing workplace. The TVOC concentrations and subsequent GC–MS analysis results for VOCs in 3D printing workplaces were affected by the ventilation rate but did not exceed the occupational exposure limit. The PM2.5 and PM10 concentrations measured by OPC in each field were lower than the indoor air quality guidelines and regulations. The RDUFPs ranged from 2.02 × 10¹³ to 5.54 × 10¹⁴ nm2/day, which could be used as an estimated ILCRUFPs value in the future. 3D printer users should be cautious because the hazardous pollutant emission rate during printing and postprocessing varies greatly under different conditions. Precautionary measures are advised during the 3D printing process, such as reducing exposure time, increasing the ventilation rate, and wearing appropriate personal respiratory protective equipment (PRPE).
Supplemental Material
Download MS Word (10.6 MB)Acknowledgments
The authors would like to thank all the 3D printing companies that participated in this study.
Data availability
Data will be provided by the authors upon request.
Disclosure statement
No potential conflict of interest was reported by the author(s).
Additional information
Funding
References
- Afshar-Mohajer N, Wu CY, Ladun T, Rajon DA, Huang Y. 2015. Characterization of particulate matters and total VOC emissions from a binder jetting 3D printer. Build Environ. 93:293–301. doi: 10.1016/j.buildenv.2015.07.013.
- Azimi P, Zhao D, Pouzet C, Crain NE, Stephens B. 2016. Emissions of ultrafine particles and volatile organic compounds from commercially available desktop three-dimensional printers with multiple filaments. Environ Sci Technol. 50(3):1260–1268. doi: 10.1021/acs.est.5b04983.
- Balletti C, Ballarin M, Guerra F. 2017. 3D printing: state of the art and future perspectives. J Cult Herit. 26:172–182. doi: 10.1016/j.culher.2017.02.010.
- Chan FL, House R, Kudla I, Lipszyc JC, Rajaram N, Tarlo SM. 2018. Health survey of employees regularly using 3D printers. Occup Med (Lond). 68(3):211–214. doi: 10.1093/occmed/kqy042.
- Chen R, Yin H, Cole IS, Shen S, Zhou X, Wang Y, Tang S. 2020. Exposure, assessment and health hazards of particulate matter in metal additive manufacturing: a review. Chemosphere. 259:127452. doi: 10.1016/j.chemosphere.2020.127452.
- Cristescu SM, Gietema HA, Blanchet L, Kruitwagen CLJJ, Munnik P, Van Klaveren RJ, Lammers JWJ, Buydens L, Harren FJM, Zanen P. 2011. Screening for emphysema via exhaled volatile organic compounds. J Breath Res. 5(4):046009. doi: 10.1088/1752-7155/5/4/046009.
- Davis AY, Zhang Q, Wong JPS, Weber RJ, Black MS. 2019. Characterization of volatile organic compound emissions from consumer level material extrusion 3D printers. Build Environ. 160:106209. doi: 10.1016/j.buildenv.2019.106209.
- Ding S, Ng BF, Shang X, Liu H, Lu X, Wan MP. 2019. The characteristics and formation mechanisms of emissions from thermal decomposition of 3D printer polymer filaments. Sci Total Environ. 692:984–994. doi: 10.1016/j.scitotenv.2019.07.257.
- Du Preez S, Johnson A, LeBouf RF, Linde SJL, Stefaniak AB, Du Plessis J. 2018. Exposures during industrial 3-D printing and post-processing tasks. Rapid Prototyping J. 24(5):865–871. doi: 10.1108/RPJ-03-2017-0050.
- Dunn KL, Hammond D, Menchaca K, Roth G, Dunn KH. 2020. Reducing ultrafine particulate emission from multiple 3D printers in an office environment using a prototype engineering control. J Nanopart Res. 22(5):112. doi: 10.1007/s11051-020-04844-4.
- Floyd EL, Wang J, Regens JL. 2017. Fume emissions from a low-cost 3-D printer with various filaments. J Occup Environ Hyg. 14(7):523–533. doi: 10.1080/15459624.2017.1302587.
- Gu J, Wensing M, Uhde E, Salthammer T. 2019. Characterization of particulate and gaseous pollutants emitted during operation of a desktop 3D printer. Environ Int. 123:476–485. doi: 10.1016/j.envint.2018.12.014.
- Hayes AC, Osio-Norgaard J, Miller S, Whiting GL, Vance ME. 2021. Air pollutant emissions from multi jet fusion, material-jetting, and digital light synthesis commercial 3D printers in a service bureau. Build Environ. 202:108008. doi: 10.1016/j.buildenv.2021.108008.
- Hegab H, Khanna N, Monib N, Salem A. 2023. Design for sustainable additive manufacturing: a review. Sustain Mater Technol. 35:e00576. doi: 10.1016/j.susmat.2023.e00576.
- Hinds W, Zhu Y. 2022. Aerosol technology: properties, behavior, and measurement of airborne particles. 3rd ed. New York (NY) Wiley.
- Jeon H, Park J, Kim S, Park K, Yoon C. 2020. Effect of nozzle temperature on the emission rate of ultrafine particles during 3D printing. Indoor Air. 30(2):306–314. doi: 10.1111/ina.12624.
- Kwon O, Yoon C, Ham S, Park J, Lee J, Yoo D, Kim Y. 2017. Characterization and control of nanoparticle emission during 3D printing. Environ Sci Technol. 51(18):10357–10368. doi: 10.1021/acs.est.7b01454.
- Manoj A, Bhuyan M, Banik SR, Ravi Sankar M. 2021. Review on particle emissions during fused deposition modeling of acrylonitrile butadiene styrene and polylactic acid polymers. Mater Today Proc. 44:1375–1383. doi: 10.1016/j.matpr.2020.11.521.
- Mendes L, Kangas A, Kukko K, Mølgaard B, Säämänen A, Kanerva T, Flores Ituarte I, Huhtiniemi M, Stockmann-Juvala H, Partanen J, et al. 2017. Characterization of emissions from a desktop 3D printer. J Indus Ecol. 21(S1):S94–S106. doi: 10.1111/jiec.12569.
- Min K, Li Y, Wang D, Chen B, Ma M, Hu L, Liu Q, Jiang G. 2021. 3D printing-induced fine particle and volatile organic compound emission: an emerging health risk. Environ Sci Technol Lett. 8(8):616–625. doi: 10.1021/acs.estlett.1c00311.
- Mohammadi AA, Zarei A, Majidi S, Ghaderpoury A, Hashempour Y, Saghi MH, Alinejad A, Yousefi M, Hosseingholizadeh N, Ghaderpoori M. 2019. Carcinogenic and non-carcinogenic health risk assessment of heavy metals in drinking water of Khorramabad, Iran. MethodsX. 6:1642–1651. doi: 10.1016/j.mex.2019.07.017.
- Mokhtar MA, Jayaratne R, Morawska L, Mazaheri M, Surawski N, Buonanno G. 2013. NSAM-derived total surface area versus SMPS-derived “mobility equivalent” surface area for different environmentally relevant aerosols. J Aerosol Sci. 66:1–11. doi: 10.1016/j.jaerosci.2013.08.003.
- Mostafaei A, Elliott AM, Barnes JE, Li F, Tan W, Cramer CL, Nandwana P, Chmielus M. 2021. Binder jet 3D printing—process parameters, materials, properties, modeling, and challenges. Prog Mater Sci. 119:100707. doi: 10.1016/j.pmatsci.2020.100707.
- Nugroho WT, Dong Y, Pramanik A. 2021. Chapter 4: 3D printing composite materials: a comprehensive review. In: Low I-M, Dong Y, editors. Composite materials: manufacturing, properties and applications. p. 65–115. Amsterdam (The Netherlands): Elsevier. doi: 10.1016/B978-0-12-820512-9.00013-7.
- Oberdörster G. 2000. Toxicology of ultrafine particles: in vivo studies. Philos Trans A Math Phys Eng Sci. 358:2719–2740. doi: 10.1098/rsta.2000.0680.
- Oberdörster G, Oberdörster E, Oberdörster J. 2005. Nanotoxicology: an emerging discipline evolving from studies of ultrafine particles. Environ Health Perspect. 113(7):823–839. doi: 10.1289/ehp.7339.
- Pinheiro ND, Freire RT, Conrado JAM, Batista AD, da Silveira Petruci JF. 2021. Paper-based optoelectronic nose for identification of indoor air pollution caused by 3D printing thermoplastic filaments. Anal Chim Acta. 1143:1–8. doi: 10.1016/j.aca.2020.11.012.
- Potter PM, Al-Abed SR, Lay D, Lomnicki SM. 2019. VOC emissions and formation mechanisms from carbon nanotube composites during 3D printing. Environ Sci Technol. 53(8):4364–4370. doi: 10.1021/acs.est.9b00765.
- Quan H, Zhang T, Xu H, Luo S, Nie J, Zhu X. 2020. Photo-curing 3D printing technique and its challenges. Bioact Mater. 5(1):110–115. doi: 10.1016/j.bioactmat.2019.12.003.
- Sharma R, Balasubramanian R. 2020. Evaluation of the effectiveness of a portable air cleaner in mitigating indoor human exposure to cooking-derived airborne particles. Environ Res. 183:109192. doi: 10.1016/j.envres.2020.109192.
- Singh R, Gupta A, Tripathi O, Srivastava S, Singh B, Awasthi A, Rajput SK, Sonia P, Singhal P, Saxena KK. 2020. Powder bed fusion process in additive manufacturing: an overview. Mater Today Proc. 26:3058–3070. doi: 10.1016/j.matpr.2020.02.635.
- Sioutas C, Delfino RJ, Singh M. 2005. Exposure assessment for atmospheric ultrafine particles (UFPs) and implications in epidemiologic research. Environ Health Perspect. 113(8):947–955. doi: 10.1289/ehp.7939.
- Stabile L, Scungio M, Buonanno G, Arpino F, Ficco G. 2017. Airborne particle emission of a commercial 3D printer: the effect of filament material and printing temperature. Indoor Air. 27(2):398–408. doi: 10.1111/ina.12310.
- Stefaniak AB, Bowers LN, Knepp AK, Luxton TP, Peloquin DM, Baumann EJ, Ham JE, Wells JR, Johnson AR, LeBouf RF, et al. 2019. Particle and vapor emissions from vat polymerization desktop-scale 3-dimensional printers. J Occup Environ Hyg. 16(8):519–531. doi: 10.1080/15459624.2019.1612068.
- Stefaniak AB, Du Preez S, Du Plessis JL. 2021. Additive manufacturing for occupational hygiene: a comprehensive review of processes, emissions, & exposures. J Toxicol Environ Health B Crit Rev. 24(5):1–50. doi: 10.1080/10937404.2021.1936319.
- Stefaniak AB, Lebouf RF, Yi J, Ham J, Nurkewicz T, Schwegler-Berry DE, Chen BT, Wells JR, Duling MG, Lawrence RB, et al. 2017. Characterization of chemical contaminants generated by a desktop fused deposition modeling 3-dimensional printer. J Occup Environ Hyg. 14(7):540–550. doi: 10.1080/15459624.2017.1302589.
- Steinle P. 2016. Characterization of emissions from a desktop 3D printer and indoor air measurements in office settings. J Occup Environ Hyg. 13(2):121–132. doi: 10.1080/15459624.2015.1091957.
- Stephens B, Azimi P, El Orch Z, Ramos T. 2013. Ultrafine particle emissions from desktop 3D printers. Atmos Environ. 79:334–339. doi: 10.1016/j.atmosenv.2013.06.050.
- Sze-To GN, Wu CL, Chao CYH, Wan MP, Chan TC. 2012. Exposure and cancer risk toward cooking-generated ultrafine and coarse particles in Hong Kong homes. HVAC&R Res. 18(1-2):204–216. doi: 10.1080/10789669.2011.598443.
- Tan LJ, Zhu W, Zhou K. 2020. Recent progress on polymer materials for additive manufacturing. Adv Funct Materials. 30(43). doi: 10.1002/adfm.202003062.
- Tyagi S, Yadav A, Deshmukh S. 2022. Review on mechanical characterization of 3D printed parts created using material jetting process. Mater Today Proc. 51:1012–1016. doi: 10.1016/j.matpr.2021.07.073.
- Vance ME, Pegues V, Van Montfrans S, Leng W, Marr LC. 2017. Aerosol emissions from fuse-deposition modeling 3d printers in a chamber and in real indoor environments. Environ Sci Technol. 51(17):9516–9523. doi: 10.1021/acs.est.7b01546.
- Viitanen AK, Kallonen K, Kukko K, Kanerva T, Saukko E, Hussein T, Hämeri K, Säämänen A. 2021. Technical control of nanoparticle emissions from desktop 3D printing. Indoor Air. 31(4):1061–1071. doi: 10.1111/ina.12791.
- Warheit DB. 2004. Nanoparticles: health impacts? Mater Today. 7(2):32–35. doi: 10.1016/S1369-7021(04)00081-1.
- Yi J, LeBouf RF, Duling MG, Nurkiewicz T, Chen BT, Schwegler-Berry D, Virji MA, Stefaniak AB. 2016. Emission of particulate matter from a desktop three-dimensional (3D) printer. J Toxicol Environ Health A. 79(11):453–465. doi: 10.1080/15287394.2016.1166467.
- Youn JS, Seo JW, Han S, Jeon KJ. 2019. Characteristics of nanoparticle formation and hazardous air pollutants emitted by 3D printer operations: from emission to inhalation. RSC Adv. 9(34):19606–19612. doi: 10.1039/c9ra03248g.
- Yu KP, Yang KR, Chen YC, Gong JY, Chen YP, Shih HC, Lung SC. 2015. Indoor air pollution from gas cooking in five Taiwanese families. Build Environ. 93:258–266. doi: 10.1016/j.buildenv.2015.06.024.
- Zhang F, Zhu L, Li Z, Wang S, Shi J, Tang W, Li N, Yang J. 2021. The recent development of vat photopolymerization: a review. Addit Manuf. 48:102423. doi: 10.1016/j.addma.2021.102423.
- Zhang Q, Pardo M, Rudich Y, Kaplan-Ashiri I, Wong JPS, Davis AY, Black MS, Weber RJ. 2019. Chemical composition and toxicity of particles emitted from a consumer-level 3D printer using various materials. Environ Sci Technol. 53(20):12054–12061. doi: 10.1021/acs.est.9b04168.
- Zhang Q, Weber RJ, Luxton TP, Peloquin DM, Baumann EJ, Black MS. 2023. Metal compositions of particle emissions from material extrusion 3D printing: emission sources and indoor exposure modeling. Sci Total Environ. 860:160512. doi: 10.1016/j.scitotenv.2022.160512.
- Zhang Q, Wong JPS, Davis AY, Black MS, Weber RJ. 2017. Characterization of particle emissions from consumer fused deposition modeling 3D printers. Aerosol Sci Technol. 51(11):1275–1286. doi: 10.1080/02786826.2017.1342029.
- Zisook RE, Simmons BD, Vater M, Perez A, Donovan EP, Paustenbach DJ, Cyrs WD. 2020. Emissions associated with operations of four different additive manufacturing or 3D printing technologies. J Occup Environ Hyg. 17(10):464–479. doi: 10.1080/15459624.2020.1798012.
- Zontek TL, Ogle BR, Jankovic JT, Hollenbeck SM. 2017. An exposure assessment of desktop 3D printing. J Chem Health Saf. 24(2):15–25. doi: 10.1016/j.jchas.2016.05.008.