Abstract
Proinflammatory effects caused by oligodeoxynucleotides (ODN) include cytokine production, splenomegaly and infiltration of mononuclear cells into tissues. Presence of one or more CpG motifs in an ODN sequence confers potency for proinflammatory properties. The objective of this research was to characterize the proinflammatory effects produced by CpG containing ODN as compared to non-CpG ODN using gene array analysis. Female CD-1 mice were administered equipotent dose regimens of a CpG ODN (ISIS 12449, 4 mg/kg sc, single or repeat dose for 7 d) or a non-CpG ODN (ISIS 2302, 50 mg/kg sc, q2d for 1 or 3 weeks) and tissues (liver and peripheral blood leukocytes) were harvested for immunohistochemical analysis or gene array analysis. Splenomegaly, a marker of ODN-induced inflammation, was greatest (3-fold above control) with ISIS 12449 when given at multiple doses. Immunohistochemical staining identified mainly monocytes/macrophages as the immune cell infiltrates in the liver following ISIS 12449 or ISIS 2302 treatment. Gene analysis of liver tissue indicated enhanced expression of chemokines (MIG, MIP-2β, MCP-1, IL-1β, CCR3), cell surface markers (CD14, CD18, CD86, CD11c, P-selectin), intracellular markers (NF-κBp65, MyD88, Survivin) and markers of cell proliferation (PCNA, Ki-67, CD71) was produced with ISIS 12449 or ISIS 2302. Although CpG and non-CpG containing ODN produced similar gene expression profiles, notable differences were observed to suggest that their mechanisms of immune modulation are not completely overlapping. MIG and MIP 1β were identified as potential biomarker for immune stimulation that may be used to further study the species specificity, sequence/structure dependence and time course of proinflammatory ODN and antisense inhibitors used as therapeutics.
INTRODUCTION
Antisense oligodeoxynucleotides (ODN) inhibit the translation of mRNA gene targets, and may be used as potential therapeutic agents for a number of diseases. The sequence specific binding of these molecules to the mRNA targets of interest affords these compounds the benefit of efficient and precise inhibition. However, these compounds can also bind to proteins in a manner that is independent of their hybridization to the mRNA gene target that results in unintended effects (Levin et al., Citation1998; Levin, Citation1999). The most well-studied of these is the proinflammatory changes produced in mice. The proinflammatory effects are characterized by the production of cytokines and chemokines, lymphoid hyperplasia, splenomegaly, and presence of mononuclear immune cells primarily in the spleen and liver (Lipford et al., Citation1997; Scheule, Citation2000; Wild and Sur, Citation2001; Krieg, Citation2002). The potency of the proinflammatory effects produced by ODN is mainly dependent on the presence of “CpG motifs” in the sequence. These motifs are characterized as sequences containing cytosine-guanosine phosphorothioate (CpG) linked dinucleotides flanked by two purine nucleotides on the 5′ end and two pyrimidine nucleotides on the 3′ end (Krieg, Citation2002). One or more of these CpG motifs dictates the potency and extent of the proinflammatory effects generated by an ODN (Krieg et al., Citation1995; Pisetsky and Reich, Citation1998; Agrawal, Citation1999; Krieg, Citation2002). In mice, the optimal proinflammatory motif contains a CpG flanked by two adenosine nucleotides or a guanine and an adenosine on the 5′ end and two thymidine nucleotides on the 3′ end (AACGTT or GACGTT).
The current understanding of the mechanisms of ODN-induced inflammation is predominantly based on research with molecules containing CpG motifs. These studies suggest that monocytes, macrophages, plasmacytoid dendritic cells and B-cells may be directly activated by CpG ODN in culture (Scheule, Citation2000; Wild and Sur, Citation2001; Peng, Citation2005; Wang et al., Citation2005). The activation of these cells is marked by increased cytokine and chemokine (TNFα, IL-6, IL-12, MIP-1, MIP-2, IFNα) production, signal transduction and transcription factor activation (MAP kinase and NF-κ B), enhanced expression of cell surface proteins (MHC II, ICAM-1, CD40, CD86) and enhanced cell survival and proliferation, among others (Jakob et al., Citation1998; Hartmann et al., Citation1999; Scheule, Citation2000; Wild and Sur, Citation2001). The proinflammatory effects of CpG containing ODN are triggered by receptor-mediated events (Imler and Hoffmann, Citation2001; Wagner, Citation2002). Specifically, Toll-like receptor (TLR)-9, a member of the pathogen associated molecular patterns (PAMP) receptor family, has been implicated as the receptor for CpG ODN (Imler and Hoffmann, Citation2001; Wagner Citation2002). The recruitment and activation of the signaling molecules MyD88, IRAK-1 and Traf6 following the engagement of TLR-9 are believed to lead to enhanced NF-κ B transcription factor activity and the subsequent proinflammatory properties manifested by CpG contianing ODN (Aderem and Ulevitch, Citation2000).
Because of the proinflammatory properties associated with CpG motifs contained within ODN sequences, compounds intended for antisense therapeutics are designed to avoid CpG motifs. These non-CpG ODN also possess other modifications to decrease the potential for proinflammatory effects such as methylation of cytosine nucleotides and addition of 2′methylethyloxy on the sugar base (Wang et al., Citation2005). Nonetheless, administration of non-CpG ODN at levels several fold above the therapeutic range can still produce a spectrum of proinflammatory changes (Henry et al., Citation1997b, Citation1999, Citation2000; Levin, Citation1999). The objective of this research was to compare the proinflammatory effects produced by CpG and non-CpG ODN. Liver and peripheral blood leukocyte (PBL) tissues were subject to gene microarray analysis to determine the proinflammatory changes characterized by CpG and non-CpG ODN. ISIS 2302, a first generation antisense inhibitor of human intracellular adhesion molecule-1 (ICAM-1) currently in late phase clinical trials for the treatment of Crohn's disease and ulcerative colitis, was used as a representative tool molecule to study the effects of non-CpG ODN. ISIS 12449 was used to represent the CpG class of molecules since it was designed to contain multiple mouse specific CpG motifs (AACGTT) (Krieg et al., Citation1995; Krieg, Citation2002). ISIS 12449 and ISIS 2302 were administered to mice at doses that achieve equipotent effects with regard to immune stimulation to determine if the immune cell types and proinflammatory signaling differed between CpG and non-CpG ODN, respectively.
METHODS
Chemicals
Chemicals and reagents were purchased from Sigma Chemical Company (St. Louis, MO). ODN were synthesized as previously described by Hoke et al. (Citation1991).
Treatment of Animals With Immunostimulatory ODN
Female CD-1 (6–8 weeks old) mice were purchased from Charles River Inc. (Wilmington, MA). The animals were housed in pans with bedding in an AAALAC-approved facility and received humane care. All animals had free access to food (Teklad #8604) and water and were allowed at least one wk of acclimation prior to use. Four groups of animals (10 mice/group) received the following subcutaneous treatment with ODN: Group 1-ISIS 12449 (4 mg/kg single dose for 1 wk), Group 2-ISIS 12449 (4 mg/kg every other d [q2d] for 1 wk), Group 3-ISIS 2302 (50 mg/kg q2d for 1 wk) and Group #4-ISIS 2302 (50 mg/kg q2d for 3 wk). Animals in Groups #5 and 6 received PBS vehicle as control administered every other d for 1 or 3 wk, respectively. Dose selection for ISIS 12449 (ACCGATAACGTTGCCGGTGACG) and ISIS 2302 (GCCCAAGCTGGCATCCGTCA) was set to produce similar effects on elevations in spleen weight. Animals in Groups 2–6 were sacrificed 24 hr following the last treatment dose, while animals in Group 1 were sacrificed 7 d after treatment. Five mice/group were euthanized by isoflurane inhalation, and blood was harvested for collection of peripheral blood leukocytes. Liver and spleen organ weights were recorded and the tissue was fixed in 10% formalin or frozen in OCT for histological and immunohistochemical analysis. Liver samples were also snap-frozen in liquid nitrogen for total RNA extraction. The remaining animals in each group were used to harvest non-parenchymal cells from the liver for RNA extraction. Tissue weight data was analyzed using One-Way Analysis of Variance (ANOVA) followed by Dunnett's post-hoc test (p < 0.05; GraphPad Prism Software V4, San Diego, CA).
Immunohistochemical Analysis
The liver was processed and sectioned for immunohistochemical analysis using standard methods as previously described by Henry et al. (Citation2000). Briefly, frozen tissue sections (4 μ m) were fixed onto glass slides and incubated with primary antibody against lysozyme (prediluted antibody solution; Cell Marque, Hot Springs, AR) or CD115 (5 μ g/ml; eBioscience, San Diego, CA). The tissue sections were then washed and incubated with horseradish peroxidase-conjugated anti-rat IgG (Jackson Immunoresearch Laboratories, West Grove, PA). Specific labeling was determined by peroxidase staining (Dako, Carpinteria, CA).
Isolation of Primary Cultured Non-Parenchymal Liver Cells From Mice
Non-parenchymal liver cells (NPLC) were isolated from mice using a two step in situ liver perfusion as previously described by (McQueen et al., Citation1989). Briefly, animals were anesthetized with Avertin (50 mg/kg, IP) and the portal vein was exposed. Hank's Balanced Salt Solution (Life Technologies, Grand Island, NY) was perfused through the portal vein for 3.5 min at 2 ml/min followed by Williams Medium E (WME: Life Technologies) containing 0.3 mg/ml collagenase B (0.4 1U/mg; Boehringer Mannheim, Mannheim, Germany) for 5.5 min. The liver was removed from the animal and massaged through gauze to obtain a suspension of cells. The resulting hepatic cell suspension was centrifuged (4 min at 500 rpm) and the supernatant containing the NPLC fraction was collected. This fraction was centrifuged (4 min at 500 rpm) to pellet residual hepatocytes from the solution. The supernatant was centrifuged at 1800 rpm for 10 min to pellet the NPLC which were snap-frozen in liquid nitrogen for RNA extraction.
Oligonucleotide Microarray Analysis
Total RNA was extracted from peripheral blood leukocytes (PBL), NPLC and whole liver tissue using a Qiagen Column Kit (Qiagen Inc., Valencia, CA). Briefly, blood was incubated with RBC lysis solution (Qiagen) to destroy red blood cells and then centrifuged at 1250 rpm for 10 min. The pelleted PBL were homogenized in RLT buffer and applied to Qiagen RNeasy mini-columns. After on column digestion with deoxyribonuclease 1 (InVitrogen Inc, Carlsbad, CA), RNA was eluted with RNase free water. For NPLC and liver (200 mg) tissue, samples were homogenized in RLT Buffer and the resulting homogenate was added to a guanidinium isothyocyanate solution (1:2, v/v). This solution was overlaid onto 0.5 ml cesium chloride (5.7 M) and centrifuged (55,000 rpm, 2 hr, 20°C) in a Beckman TL-100 ultracentrifuge (Beckman Inc, Fullerton, CA). The supernatant was discarded and the total RNA pellet was reconstituted in RNase free water and subjected to Qiagen columns as described previously. Gene microarray analysis was performed on all mRNA samples for NPLC and whole liver tissue (n = 5), while peripheral blood leukocyte samples were pooled from individual animals within each treatment group.
Low-density oligonucleotide microarrays (200 genes/chip spotted in duplicate) were designed to contain known genes associated with the immune system and inflammation. Briefly, 50-base 5′ amino linked gene specific capture oligonucleotide probes were suspended in print buffer (150 mM Na-PO4, pH 8.5) at 10 μM and spotted on Surmodics 3D-Link slides using a Cartesian synQUAD arrayer. Spots were air-dried then stored in a humidification chamber at 75% relative humidity until hybridization. Total RNA (10 μg) was reverse transcribed using oligo dT priming in the presence of 33-P dCTP using SuperScript II reverse transcriptase according to the manufacturer's protocol (InVitrogen, Inc.) to generate first-strand cDNA. The arrayed slides were hybridized with the labeled cDNA (overnight, 42°C). Microarray slides were then washed (2X SSC/0.1% SDS), dried and exposed using a Molecular Dynamics Phosphor-Imager (Piscataway, NJ). ArrayVision software (Imaging Research) was utilized to determine spot density values that were normalized to the mean expression of all genes across the microarray chip. For each experiment, the data was analyzed using ArrayStat software (Imaging Research) to construct a fitted curve that estimated the relevant error for each gene. A fold change value of ODN treated over PBS vehicle control was calculated for each gene and statistical analysis was performed using One-Way Analysis of Variance followed by the Bonferroni post-hoc test (p < 0.05).
RT-PCR Analysis
To support the data provided by gene array analysis on expression patterns, a list of genes of interest were analyzed by RT-PCR Taqman (Perken Elmer ABI Prism 7700 Sequence Detection System, Norwalk, CT) as described by Condon et al. (Citation2001). Briefly, primer-probe sets designed for a selected list of genes of interest were constructed (IDT, Inc., Coralville, IA). Total RNA (100 ng), the same preparation used for gene array analysis, was subjected to standard RT-PCR conditions as recommended by the manufacturer with slight modifications (Invitrogen, Carlsbad, CA). For each gene a mean expression intensity value was generated for each sample based on a RNA standard curve. This value was normalized to the mean expression intensity of the house keeping gene glyceraldehyde 3-phosphate dehydrogenase. RT-PCR data was analyzed using One-Way Analysis of Variance (ANOVA) followed by Dunnett's post-hoc test (p < 0.05; GraphPad Prism Software V4, San Diego, CA).
RESULTS
Effects of Immunostimulatory ODN on Liver and Spleen Weight
Treatment of mice with ISIS 2302 and ISIS 12449 increased liver and spleen weights, but with remarkable differences in dose and schedule. A single dose of 4 mg/kg ISIS 12449 produced a 2.3- and 1.3-fold increase in spleen and liver weight, respectively (). Similar increases on tissue weight (2.2-fold for spleen and 1.3-fold for liver) were produced with ISIS 2302 but required a dosing regimen of 50 mg/kg q2d for 3 wk. Thus, approximately 140 times more ISIS 2302 was necessary to produce equivalent increases in tissue weight as ISIS 12449. Treatment of 50 mg/kg ISIS 2302 q2d for 1 wk had a marginal effect on liver weight and no effect on spleen weight. In contrast, multiple administration of 4 mg/kg ISIS 12449 (q2d for 1 wk) produced the greatest increases on spleen (3.3-fold) and liver (1.6-fold) weights.
FIG. 1 Increased Tissue Weight Following Immunostimulatory ODN Treatment. Female mice were administered 50 mg/kg ISIS 2302 (q2d, sc) for 1 or 3 wk or 4 mg/kg ISIS 12449 as a single dose (S) or multiple dose (M; q2d for 1 wk). Liver and spleen weights were normalized as percent body weight and then expressed as fold change from the PBS control group. The insert table represents the cumulative dose of ODN exposure and the effect on organ weight. N = 4–8. aDenotes significant difference from PBS control. bDenotes significant difference from all groups.
Immune Cell Infiltrates in Liver Following Immunostimulatory ODN Treatment
The infiltration of immune cells to the liver, as well as other tissues, occurs during ODN-induced immune stimulation. Repeated administration of 4 mg/kg ISIS 12449 for 1 wk produced the greatest extent of immune cell infiltrates that typically surrounded and cuffed the vessels in the liver (). A single dose of 4 mg/kg ISIS 12449 or 50 mg/kg ISIS 2302 for 3 wk produced a similar (i.e., moderate) level of immune cell infiltrates in the liver ( and ), while 1 wk of ISIS 2302 had slight, if any, immune cell infiltrates (). For both compounds, regardless of dose or regimen, the immune cell infiltrates predominantly composed of mononuclear cells and very little, if any, appeared to be granulocytes. The immune cells formed pockets of infiltrates that localized perivascularly (periportal and centrilobular regions of the liver) but also extended to midzonal regions as the immune response increased.
FIG. 2 Immune Cell Infiltrates in Liver Following Immunostimulatory ODN Treatment. Female mice were administered 50 mg/kg ISIS 2302 (q2d, sc) for 1 or 3 wk or 4 mg/kg ISIS 12449 as a single dose (S) or multiple dose (M; q2d for 1 wk). Liver was fixed in 10% formalin and sections were stained with Hemotoxilin/Eosin. The panels are representative photomicrographs of each treatment group: A, PBS; B, ISIS 2302 (1 wk); C, ISIS 2302 (3 wk); D, ISIS 12449 S; E, ISIS 12449 M.
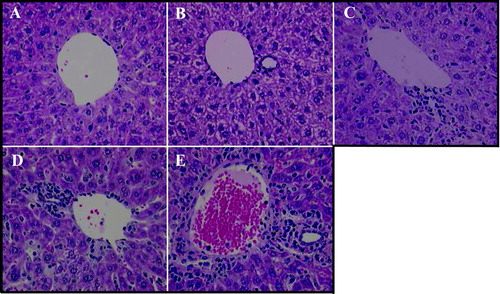
The parenchyma of the liver appeared to be normal based on histological evaluation in all ODN treatment groups. However, single cell hepatocellular death was present in the livers that contained mononuclear immune cell infiltrates. This focal hepatocyte cell death was minimal, but was greatest with multiple administration of ISIS 12449.
Characterization of Immune Cell Infiltrates
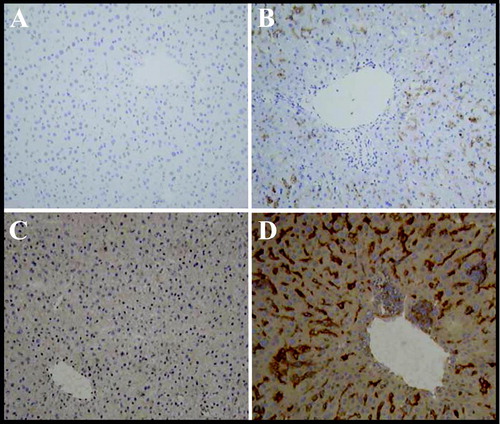
Immunohistochemical staining for monocytes and lymphocytes was performed to characterize the type of immune cells infiltrating the liver. Protein expression of the histiocyte marker lysozyme and the monocyte/macrophage marker CD115 were enhanced following ISIS 12449S treatment () and localized to the sinusoidal spaces. There was minimal to moderate staining by the aggregated infiltrating cells. The pattern of expression of lysozyme and CD115 was similar in ISIS 2302 (3 wk) and ISIS 12449 M treatment groups (data not shown). The staining for CD19 (B-cells) and CD3 (T-cells) was negative in the liver (data not shown).
FIG. 3 Immunohistochemical Detection of Histocyte Cell Markers Lysozyme and CD 115. Female mice were administered 4 mg/kg ISIS 12449 as a single dose (S) for 1 wk. Liver was frozen in OCT and sections were incubated with the primary antibodies lysozyme (Panel A,B) or CD115 (Panel C,D) and then with a HRP-labeled secondary antibody. Peroxidase specific staining is indicated by the dark brown staining. The panels are representative photomicrographs of each treatment group: A, C, PBS; B, D ISIS 12449S.
Gene Microarray Analysis of Non-Parenchymal Liver Cells
Gene array analysis was performed on non-parenchymal liver cell (NPLC) fractions from animals treated with ODN. Because each gene array experiment was performed separately the gene expression profiles among treatment groups were compared qualitatively. The results of the gene expression analysis were grouped into five gene categories (). Increased gene expression of cytokines and chemokines (TNFα, MIP-2β, MIG, IL-1β, IL-1 RA and IL-1 BCE) occurred only in the ISIS 12449 treatment groups. MIP-1β and IL-10 were increased with both ISIS 2302 or 12449 treatment, while SCYA5 was only elevated by ISIS 2302 treatment. Interestingly, the gene expression of IL-6, a cytokine known to be up regulated during ODN-induced immune stimulation, was not altered. Genes identified as growth factors were also unchanged during ODN-induced immune stimulation.
FIG. 4 Gene Microarray Analysis of Non-Parenchymal Liver Cells and Peripheral Blood Leukocytes Following Immunostimulatory ODN Treatment. Female mice were administered 50 mg/kg ISIS 2302 (q2d, sc) for 1 or 3 wk or 4 mg/kg ISIS 12449 as a single dose (S) or multiple dose (M; q2d for 1 wk). Whole blood was harvested for collection of leukocytes while the non-parenchymal cells were isolated from the liver. Total RNA from these tissue fractions was subjected to oligoarray analysis as detailed in Materials and Methods. Genes are categorized into five groups and data is represented as fold change from PBS control. (A) Data obtained from non-parenchymal liver cells, N = 4; (B) data obtained from peripheral blood leukocytes. *Denotes significant difference from PBS control.
The signal transduction pathways known to be involved in CpG ODN mediated immune cell activation were up-regulated by ISIS 12449. For example, the mRNA expression of MyD88 and NF-κB (P65 subunit) were elevated with ISIS 12449 treatment. Genes associated with the activator protein 1 pathway were reduced (MEKK-1, JNK-2, Akt-2) or unchanged (PKC-theta, p-38). In contrast, ISIS 2302 treatment did not alter the gene expression profiles of these intracellular signaling pathways. Genes categorized as markers of cell proliferation were upregulated with both ISIS 12449 and ISIS 2302. The mRNA expression of Ki-67 and the anti-apoptosis factor survivin were increased with ISIS 2302 (3 wk) or 12449 treatment in NPLC. Other genes associated with cell proliferation such as PCNA and CD71 were also upregulated by ISIS 12449M treatment. The mRNA levels of leukocyte surface markers (CD18, CD11a, CD14, MHC II and genes associated with leukocyte adhesion (L- and P-selectin and VCAM-1)) were also elevated with ISIS 12449. In contrast, only CD18 was increased with ISIS 2302. The adhesion molecule CD44 and the dendritic cell marker CD11c were increased during both ISIS 2302 (3 wk) and ISIS 12449 treatment in NPLC fractions. The mRNA levels of cytokine and chemokine receptors (CCR3, IL-2R and IL-8R) were also elevated with ISIS 12449 administration, but not ISIS 2302.
Gene Microarray Analysis of Peripheral Blood Leukocytes
Peripheral blood leukocytes (PBL) that contain both myeloid and lymphoid immune cells were harvested from ODN and PBS treated animals and subjected to microarray gene analysis. Overall, the number of genes that were altered by ODN treatment in PBL samples was lower than that in NPLC fractions. The most pronounced response to ODN treatment was the enhanced mRNA expression of the chemokine MIG (). MIG was markedly upregulated with single or multiple ISIS 12449 treatments and was marginally increased with ISIS 2302 (3 wk). The expression of the cytokines IL-1 RA, IL-1 BCE and SYCA5 were also elevated with ISIS 12449 and ISIS 2302 along with the toll like receptor (TLR) signaling factors MyD88 and IRAK-1. However, the gene expression profiles of factors downstream of the TLR cascade were not altered, except for enhanced NF-κ B (p50 subunit) mRNA levels in the ISIS 2302 (3 wk) treatment group. The anti-apoptosis molecule survivin showed modest increases in all ODN treated groups, even in the ISIS 2302 (1 wk) PBL samples. However, the expression pattern of PCNA and Ki-67 were unchanged in PBL. The mRNA levels of genes expressed on the cell surface were the least affected by ODN treatment.
Comparing Gene Microarray Analysis Across Tissues
Gene expression analysis was performed in whole liver tissue and was compared to the profile observed in NPLC fractions to determine the overall effect of ODN treatment on this organ and the contribution of hepatocellular gene expression profiles on the gene patterns of NPLC. In general, the pattern of gene expression in whole liver tissue was very similar with 70–80% correlation to that observed in NPLC for ISIS 12449 and ISIS 2302 treatment groups (data not shown). The gene expression profiles obtained from the ISIS 12449M group were utilized to provide a more detailed description of this comparison (). As illustrated in , there was strong agreement in the mRNA expression patterns of surface and cell proliferation associated genes between whole liver and NPLC fractions. A moderate level of alignment was observed for genes involved in intracellular signaling and cytokines/chemokines between these tissues that is highlighted by MIG and IL-1 RA. Moreover, there did not appear to be a class of genes that were altered in whole liver and unchanged in NPLC fractions. To identify biomarkers of ODN-induced immune stimulation the gene expression patterns in liver and NPLC fractions were also compared to that in PBL. The mRNA encoding for the genes MIG, survivin and MHCII were upregulated in all three tissues. In contrast, the gene expression of IRAK-1 was only observed in PBL.
FIG. 5 Gene Microarray Analysis Across Tissues. Female mice were administered 4 mg/kg ISIS 12449 q2d for 1 wk. Whole blood was harvested for collection of leukocytes while the non-parenchymal cells were isolated from the liver. Total RNA from these tissue fractions as well as from whole liver was subjected to oligoarray analysis as detailed in Materials and Methods. A selected list of genes are shown and represented as fold change from PBS control. *Denotes significant difference from PBS control.
RT-PCR Analysis of Selected Genes
RT-PCR (Taqman) analysis for a selected list of genes was performed to corroborate the changes observed by the gene microarray studies (). Overall, the microarray changes observed in liver tissue were highly reproducible with RT-PCR analysis. Only one (TLR-9) out of the 10 genes tested by both methods had dissimilar gene expression patterns. In contrast, there was significant disparity amongst the gene array and RT-PCR data for PBL tissue. The pooling of PBL samples for gene array analysis may have contributed to differences in gene expression of that from RT-PCR.
TABLE 1 Comparing gene array and RT-PCR analysis on liver and peripheral blood leukocytes for specific genes of interest following immunostimulatory ODN treatment
In general, the fold increase in gene expression was greater for ISIS 12449 as compared to ISIS 2302. For example, ISIS 2302 (1 wk) produced a 2-fold increase in hepatic CD11c as compared to a 10-fold increase with ISIS 2302 (3 wk), while ISIS 12449 S and M produced 20- and 17-fold elevations, respectively. The chemokine receptors CXCR-3 and CCR7, not tested in the gene array analysis, had modest elevations in mRNA levels in liver tissue following ISIS 12449 treatment. In contrast, the mRNA levels of CCR7 were drastically reduced in PBL in this treatment group. Interesting, the TLR signaling molecules MyD88 and IRAK-1 showed no changes in gene expression by RT-PCR analysis in both tissues examined, except for a 4-fold increase in MyD88 expression in liver by ISIS 12449M. However, RT-PCR results show an increase in TLR-9 in the liver in all treatment groups that was greatest for ISIS 12449.
DISCUSSION AND CONCLUSIONS
Several antisense ODN are currently in preclinical and clinical testing in indications for oncology and metabolic disease (Jiang et al., Citation2005; Wang et al., Citation2005). The drug development of this class of molecules has uncovered a number of nonspecific properties that collectively can be described as being proinflammatory. In rodents, these proinflammatory effects include production of cytokines and chemokines, splenomegaly and infiltration of immune cells in several organ systems. The presence of CpG motifs is the primary driver for the potency of these effects. In fact, proinflammatory ODN designed to contain CpG motifs are currently being tested in disease conditions where immunomodulation may be therapeutically beneficial such as in the treatment of cancer or as vaccine adjuvants (Uhlmann and Vollmer, Citation2003; Klinman, Citation2004). In contrast, proinflammatory effects are not desired for antisense therapeutics, and great effort has been undertaken to remove these properties from ODN (Henry et al., Citation1997a; Levin et al., Citation1998; Levin, Citation1999). Indeed, antisense ODN are typically devoid of CpG motifs and, by in large, do not produce meaningful proinflammatory effects at therapeutically relevant doses (Henry et al., Citation2000). However, proinflammatory effects may manifest at higher doses (Henry et al., Citation1997b, Citation1997c; Levin et al., Citation2001). We were able to generate proinflammatory effects with ISIS 2302, a typical antisense phosphorothioate oligodeoxynucleotide molecule that does not contain CpG motifs, at doses 2- to 5-fold above the anticipated clinical dose (Barish, Citation2005). ISIS 2302 targets the human ICAM-1 gene with no cross-reactivity to the mouse gene and has completed Phase 2 clinical testing for ulcerative colitis (Barish, Citation2005). To get a better understanding of the differential proinflammatory effects produced by non-CpG ODN to those with optimal sequences for immunomodulation (i.e., ODN with CpG motifs) we also studied ISIS 12449. The sequence of ISIS 12449 contains several adjacent cytosine and guanosine nucleotides and a mouse optimal CpG motif (AACGTT). The dose and treatment schedule of ISIS 12449 and ISIS 2302 in this study were selected to produced similar increases in splenomegaly, a key indicator of the proinflammatory effects in vivo in rodents based on previously conducted time course and dose response studies (Krieg et al., Citation1995; Krieg, Citation2002). Mice received a single dose of ISIS 12449 (4 mg/kg for 1 wk) or every other day treatment with ISIS 2302 (50 mg/kg for 3 wk) and developed similar increases in spleen weight. The extent of infiltrating mononuclear immune cells in the liver was also similar among these treatment groups. Therefore, approximately 140-times more ISIS 2302 was needed to produce similar degree of splenomegaly as ISIS 12449. This highlights the importance of CpG motifs in the production of the proinflammatory effects observed with phosphorothioate ODN and the relatively weak activity of antisense ODN for modulating the immune system.
Gene microarray analysis was used to understand the transcriptome profile during immune modulation and how this differs between CpG and non-CpG containing ODN. The liver was profiled for gene expression analysis since this tissue is susceptible to infiltration of immune cells (Henry et al., Citation1997c). Moreover, the characteristics of the immune cells that infiltrate into the liver, as well as other tissues, has not been well described. The gene array results in whole liver tissue identified the expression of cell surface markers that are commonly expressed by histiocytes. For example, the mRNA levels of CD11b, CD18 and CD11c were increased to a similar degree with equipotent dose regimens of ISIS 12449 and ISIS 2302, while panmarker genes of B- and T-cells (e.g., CD19 and CD4, respectively) were undetected in the liver. This gene expression pattern suggests that monocytes (CD11b, CD18), macrophages (CD14, CD11b, CD18), and/or dendritic cells (CD11c, MHCII) (Kansas et al., Citation1990; el-Gabalawy et al., Citation1996; Short et al., Citation1996) likely comprise, in part, the immune cell infiltrates. The CD18 and CD11c gene markers appear quite sensitive as they were slightly elevated in animals that received ISIS 2302 for 1 wk where little, if any, immune cell infiltrates were observed microscopically in the liver. We found that lysozyme and CD115 protein expression, two surface markers of histiocytes, were co-localized with the immune cell infiltrates. The protein levels of CD11b and CD18 have also been detected in the liver following ODN treatment in agreement with our gene expression findings (Henry et al. Citation2000). The role of dendritic cells, specifically plasmacytoid dendritic cells, have been shown to be activated in vitro by CpG ODN, similar in sequence and potency to ISIS 12449, which then trigger the activation of monocytes, macrophages, B-cells and NK cells (Hartmann et al., Citation1999; Asselin-Paturel et al., Citation2001; Nakano et al., Citation2001). The presence of lyzozyme staining along with the gene expression of dendritic cell surface markers (CD11c, MHC II) implicates the involvement of dendritic cells in the immunostimulatory properties of ODN in vivo. Our data is in agreement with the morphologic description of these cells upon microscopic evaluation as being histiocytic in nature, and is consistent with other studies that describe the immune cell infiltrates as monocytic (Henry et al., Citation2000; Levin et al., Citation2001). A difference in the surface marker expression between ISIS 2302 and ISIS 12449 is the increase of CD14, MHCII and CCR-7 genes with ISIS 12449. This indicates that CpG containing ODN may activate additional immune cells compared to non-CpG ODN, which is not distinguished histologically.
The gene expression of cytokines and chemokines in NPLC was distinct between ISIS 12449 and ISIS 2302 treatment. Both compounds produced a clear pattern of mRNA transcripts that favored induction of mainly TH-1 type cytokines while TH-2 factors were unchanged or marginally reduced. This profile of a shift to the production of TH-1 type cytokines has been described for CpG ODN (Lipford et al., Citation1997; Zhao et al., Citation1997; Zhang et al., Citation2001) and as demonstrated here also exists for non-CpG ODN. MIP-1β and IL-10 were increased to a similar degree by ISIS 2302 (3 wk treatment group) and ISIS 12449 (single dose group) by approximately 2- and 3-fold, respectively. ISIS 12249 treatment also produced increased (10–14-fold) expression of MIG to the greatest degree, followed by, MIP-2β, and IL-1 associated genes. Although not examined in our study, the protein expression of cytokines and chemokines such as MIP and IL-6 has been reported to be increased in the liver following both CpG and non-CpG ODN treatment (Lipford et al., Citation1997; Zhao et al., Citation1997; Zhang et al., Citation2001). MIG and the MIP proteins function as chemokines to recruit monocytes and leukocytes to sites of inflammation or injury (Lalor et al., Citation2002). The expression of MIG is induced by subsets of high endothelial venules of lymph nodes during inflammation and regulates the migration of monocytes from the systemic circulation to this tissue (Jinquan et al., Citation2000; Janatpour et al., Citation2001; Muller, Citation2001). The receptor for MIG, CXCR3, was also upregulated in the liver in these treatment groups. Since CXCR3 is expressed mainly by monocytes and dendritic cells the induction of MIG may play a key role in the chemotaxis of histiocytes from the systemic circulation to target organs. Interestingly, the presence of elevated expression of MIP-2β and IL-1 and greater up-regulation of MIG with ISIS 12449 correlates with the increased CD14, MHC II, and CCR-7 surface marker genes that were not produced with ISIS 2302. The differential cytokine/chemokine expression may relate to differences in infiltrating histiocytic cell populations in the liver following CpG and non-CpG ODN treatment.
Gene array analysis of circulating PBL was performed to better understand the role these cells play in the proinflammatory effects produced by immunomodulatory ODN. The most pronounced change was the increase in MIG mRNA expression in circulating PBL by 12- and 49-fold above control (based on RT-PCR) with ISIS 2302 (3 weeks) and ISIS 12449 (single dose) treatment, respectively. The elevation of MIG mRNA in PBL was accompanied by increases in other cytokines such as IL-1 RA, IL-1 BCE and SYCA5. The protein levels of IL-1 associated cytokines as well as MCP, MIP-1, IL-6, among others are also increased in serum soon after immunomodulatory ODN treatment in mice (Levin et al., Citation2001; Kandimalla et al., Citation2003). Given the role of MIG in chemotaxis, its increased expression in both circulating PBL and the immune cell infiltrates in the liver provides insight on the possible mechanism(s) of how histiocytes are recruited to tissues via high endothelial venules. Moreover, the enhanced gene expression of MIG in PBL may also serve as a sensitive biomarker for the immunostimulatory effects of ODN and may be an indicator of immune cell infiltration in tissues. Interestingly, the increase in MIG up-regulation was markedly greater with ISIS 12449 than with ISIS 2302 treatment by 4-fold at equipotent dose regimens for splenomegaly. This suggests that the stimulus for immune cell infiltrates may be greater with CpG versus non-CpG ODN, although we did not qualitatively discern any differences in the amount of immune cell infiltrates in the liver between these treatment groups.
Furthermore, this finding also suggests that the proinflammatory property of splenomegaly may not represent the potential for producing other proinflammatory effects in the same way. It is likely that the mechanism(s) for the various proinflammatory effects are independent or vary between CpG and non-CpG ODN. Indeed, it has been reported that non-CpG ODN produce proinflammatory effects in TLR-9 deficient mice to a similar degree as in wild-type mice (Senn et al., Citation2005). In contrast, the proinflammatory effects generated by CpG ODN were dramatically reduced in TLR-9 deficient mice. Although CpG ODN are active in other TLR (e.g., TLR-2 and 4) knockout models (Schnare et al., Citation2000), it would be fruitful to determine the proinflammatory activity of non-CpG ODN in these models since we and others (Senn et al., Citation2005) describe differences in the proinflammatory effects of these immune modulators.
The distinct expression of surface markers and cell proliferation genes in NPLC were unchanged in circulating PBL. For example, the gene expression of the cell proliferation markers Ki-67 and PCNA were increased in ISIS 2302 and ISIS 12449 groups in liver but not PBL tissue. Although modest up-regulation of the anti-apoptotic factor survivin was observed in PBL, the trigger for cell proliferation appears to occur once immune cells infiltrate the liver. The shift or switch of the gene expression patterns of PBL and NPLC also brings attention to the role of Kupffer cells, the resident hepatic macrophages, and the liver endothelium. The gene expression patterns we observed may be from activated Kupffer cells, which may be involved in the mechanism(s) of immune cell infiltration. It is difficult from our analysis to distinguish the effects of Kupffer cell activation from those of activated infiltrating immune cells. Adhesion molecules such as L- and P-selectin, VCAM-1 and CD44 were also upregulated in NPLC with ISIS 2302 and ISIS 12449 treatment, but not in PBL. In addition to the immune cell infiltrates, endothelial cells in the liver also express these adhesion molecules and may, in part, be induced from activation of the endothelium in the liver (Cichy and Pure, Citation2003; Ulbrich et al., Citation2003). Finally, the dramatic shift in the cell populations that comprise the NPLC fraction following treatment with ISIS 2302 and ISIS 12449 also contribute to the changes in gene expression and questions if the induction of some genes, especially surface markers, are due to simple increases in cell number. Investigating the gene expression profiles in liver at earlier time points prior to the presence of cell infiltrates, which is a limitation of this study, may provide more insight on the role of the endothelial and resident non-parenchymal cell populations of the liver following ODN treatment.
In summary, this work has demonstrated that gene expression profiles, as a whole, are similar for a CpG and a non-CpG ODN utilizing ISIS 12449 and ISIS 2302, respectively. However, there are distinct differences in the potency and molecular signatures between these oligonucleotides despite similar effects on spleen weight and extent of immune cell infiltrates that suggest differences do exist in the proinflammatory effects between immunomodulatory ODN that possess optimal CpG motifs versus those designed as antisense oligonucleotides (non-CpG ODN). Therefore, it is important to keep in context the relative potency of the proinflammatory effects for CpG containing ODN that are designed for immunomodulatory activity as compared to standard antisense ODN when determining therapeutic indexes.
REFERENCES
- Aderem A., Ulevitch R. J. Toll-like receptors in the induction of the innate immune response. Nature 2000; 406: 782–787, [CSA]
- Agrawal S. Importance of nucleotide sequence and chemical modifications of antisense oligonucleotides. Biochim. Biophys. Acta 1999; 1489: 53–68, [CSA]
- Asselin-Paturel C., Boonstra A., Dalod M., Durand I., Yessaad N., Dezutter-Dambuyant C., Vicari A., O'Garra A., Biron C., Briere F., Trinchieri G. Mouse Type I IFN-producing cells are immature APCs with plasmacytoid morphology. Nat. Immunol. 2001; 2: 1144–1150, [CSA]
- Barish C. F. Alicaforsen therapy in inflammatory bowel disease. Expert Opin. Biol. Ther. 2005; 5: 1387–1391, [CSA]
- Cichy J., Pure E. The liberation of CD44. J. Cell Biol. 2003; 161: 839–843, [CSA]
- Condon T. P., Flournoy S., Sawyer G. J., Baker B. F., Kishimoto T. K., Bennett C. F. ADAM17 but not ADAM10 mediates tumor necrosis factor-alpha and L-selectin shedding from leukocyte membranes. Antisense Nucl. Acid Drug Dev. 2001; 11: 107–116, [CSA]
- el-Gabalawy H., Canvin J., Ma G. M., Van der Vieren M., Hoffman P., Gallatin M., Wilkins J. Synovial distribution of alpha d/CD18, a novel leukointegrin. Comparison with other integrins and their ligands. Arthritis Rheum. 1996; 39: 1913–1921, [CSA]
- Hartmann G., Weiner G. J., Krieg A. M. CpG DNA: A potent signal for growth, activation, and maturation of human dendritic cells. Proc. Natl. Acad. Sci. USA 1999; 96: 9305–9310, [CSA]
- Henry S. P., Bolte H., Auletta C., Kornbrust D. J. Evaluation of the toxicity of ISIS 2302, a phosphorothioate oligonucleotide, in a 4-week study in cynomolgus monkeys. Toxicology 1997a; 120: 145–155, [CSA]
- Henry S. P., Grillone L. R., Orr J. L., Brunner R. H., Kornbrust J., Kornbrust D. J. Comparison of the toxicity profiles of ISIS 1082 and ISIS 2105, phosphorothioate oligonucleotides, following subacute intradermal administration in Sprague–Dawley rats. Toxicology 1997b; 116: 77–88, [CSA]
- Henry S. P., Stecker K., Brooks D., Monteith D., Conklin B., Bennett C. F. Chemically-modified oligonucleotides exhibit decreased immune stimulation in mice. J. Pharmacol. Exp. Ther. 2000; 292: 468–479, [CSA]
- Henry S. P., Taylor J., Midgley L., Levin A. A., Kornbrust D. J. Evaluation of the toxicity of ISIS 2302, a phosphorothioate oligonucleotide in a 4-week study in CD-1 mice. Antisense Nucl. Acid Drug Dev. 1997c; 7: 473–481, [CSA]
- Henry S. P., Templin M. V., Gillett N., Rojko J., Levin A. A. Correlation of toxicity and pharmacokinetic properties of a phosphorothioate oligonucleotide designed to inhibit ICAM-1. Toxicol. Pathol. 1999; 27: 95–100, [CSA]
- Hoke G. D., Draper K., Freier S., Gonzalez C., Driver V. B., Zounes M. C., Ecker D. J. Effects of phosphorothioate capping on antisense oligonucleotide stability, hybridization and antiviral efficacy versus herpes simplex virus infection. Nucl. Acids Res. 1991; 19: 5743–5748, [CSA]
- Imler J. L., Hoffmann J. A. Toll receptors in innate immunity. Trends Cell Biol. 2001; 11: 304–311, [CSA]
- Jakob T., Walker P. S., Krieg A. M., Udey M. C., Vogel J. C. Activation of cutaneous dendritic cells by CpG-containing oligodeoxynucleotides: A role for dendritic cells in the augmentation of TH1 responses by immunostimulatory DNA. J. Immunol. 1998; 161: 3042–3049, [CSA]
- Janatpour M. J., Hudak S., Sathe M., Sedgwick J. D., McEvoy L. M. Tumor necrosis factor-dependent segmental control of MIG expression by high endothelial venules in inflamed lymph nodes regulates monocyte recruitment. J. Exp. Med. 2001; 194: 1375–1384, [CSA]
- Jiang G., Li Z., Liu F., Ellsworth K., Dallas-Yang Q., Wu M., Ronan J., Esau C., Murphy C., Szalkowski D., Bergeron R., Doebber T., Zhang B. B. Prevention of obesity in mice by antisense oligonucleotide inhibitors of stearoyl-CoA desaturase-1. J. Clin. Invest. 2005; 115: 1030–1038, [CSA]
- Jinquan T., Quan S., Jacobi H. H., Jing C., Millner A., Jensen B., Madsen H., Ryder L. P., Svejgaard A., Malling H. J., Skov P. S., Poulsen L. K. CXC chemokine receptor 3 expression on CD34(+) hematopoietic progenitors from human cord blood induced by granulocyte-macrophage colony-stimulating factor: Chemotaxis and adhesion induced by its ligands, interferon gamma-inducible protein 10 and monokine induced by interferon gamma. Blood 2000; 96: 1230–1238, [CSA]
- Kandimalla E. R., Bhagat L., Zhu F., Yu D., Cong Y., Wang D., Tang J. X., Tang J., Knetter C. F., Lien E., Agrawal S. A dinucleotide motif in oligonucleotides shows potent immunomodulatory activity and overrides species-specific recognition observed with CpG motif. Proc. Natl. Acad. Sci. USA 2003; 100: 14303–14308, [CSA]
- Kansas G. S., Muirhead M. J., Dailey M. O. Expression of the CD11/CD18, leukocyte adhesion molecule 1, and CD44 adhesion molecules during normal myeloid and erythroid differentiation in humans. Blood 1990; 76: 2483–2492, [CSA]
- Klinman D. M. Immunotherapeutic uses of CpG oligodeoxynucleotides. Nat. Rev. Immunol. 2004; 4: 249–258, [CSA]
- Krieg A. M. CpG motifs in bacterial DNA and their immune effects. Annu. Rev. Immunol. 2002; 20: 709–760, [CSA]
- Krieg A. M., Yi A., Matson S., Waldschmidt T. J., Bishop G. A., Teasdale R., Koretzky G. A., Klinman D. M. CpG motifs in bacterial DNA trigger direct B-cell activation. Nature 1995; 374: 546–549, [CSA]
- Lalor P. F., Shields P., Grant A., Adams D. H. Recruitment of lymphocytes to the human liver. Immunol. Cell. Biol. 2002; 80: 52–64, [CSA]
- Levin A. A. A review of issues in the pharmacokinetics and toxicology of phosphorothioate antisense oligonucleotides. Biochim. Biophys. Acta 1999; 1489: 69–84, [CSA]
- Levin A. A., Henry S. P., Monteith D., Templin M. Toxicity of Antisense Oligonucleotides. Antisense Drug Technology, S. T. Crooke. Marcel Dekker, Inc., New York 2001
- Levin A. A., Monteith D. K., Leeds J. M., Nicklin P. L., Geary R. S., Butler M., Templin M. V., Henry S. P. Toxicity of oligodeoxynucleotide therapeutic agents. Antisense Research and Application, S. T. Crooke. Springer, Heidelberg 1998
- Lipford G. B., Sparwasser T., Bauer M., Zimmermann S., Koch E., Heeg K., Wagner H. Immunostimulatory DNA: Sequence-dependent production of potentially harmful or useful cytokines. Eur. J. Immunol. 1997; 27: 3420–3426, [CSA]
- McQueen C. A., Rosado R. R., Williams G. M. Effect of nalidixic acid on DNA repair in rat hepatocytes. Cell Biol. Toxicol. 1989; 5: 201–206, [CSA]
- Muller W. A. New mechanisms and pathways for monocyte recruitment. J. Exp. Med. 2001; 194: F47–51, [CSA]
- Nakano H., Yanagita M., Gunn M. D. CD11c(+)B220(+)Gr-1(+) cells in mouse lymph nodes and spleen display characteristics of plasmacytoid dendritic cells. J. Exp. Med. 2001; 194: 1171–1178, [CSA]
- Peng S. L. Signaling in B-cells via Toll-like receptors. Curr. Opin. Immunol. 2005; 17: 230–236, [CSA]
- Pisetsky D. S., Reich C. F. The influence of base sequence on the immunological properties of defined oligonucleotides. Immunopharmacology 1998; 40: 199–208, 3rd.[CSA]
- Scheule R. K. The role of CpG motifs in immunostimulation and gene therapy. Adv. Drug Delivery Rev. 2000; 44: 119–134, [CSA]
- Schnare M., Holt A. C., Takeda K., Akira S., Medzhitov R. Recognition of CpG DNA is mediated by signaling pathways dependent on the adaptor protein MyD88. Curr. Biol. 2000; 10: 1139–1142, [CSA]
- Senn J. J., Burel S., Henry S. P. Non-CpG-containing antisense 2′ MOE oligonucleotides activate a proinflammatory response independent of TLR-9 or MyD88. J. Pharmacol. Exp. Ther. 2005; 314: 972–979, [CSA]
- Short M. L., Nickel J., Schmitz A., Renkawitz R. Lysozyme gene expression and regulation. Cell Growth Differ. 1996; 75: 243–257, [CSA]
- Tan J., Quan S., Jacobi H. H., Jing C., Millner A., Jensen B., Madsen H. O., Ryder L. P., Svejgaard A., Malling H. J., Skov P. S., Poulsen L. K. CXC chemokine receptor 3 expression on CD34(+) hematopoietic progenitors from human cord blood induced by granulocyte-macrophage colony-stimulating factor: Chemotaxis and adhesion induced by its ligands, interferon gamma-inducible protein 10 and monokine induced by interferon gamma. Blood 2000; 96: 1230–1238, [CSA]
- Uhlmann E., Vollmer J. Recent advances in the development of immunostimulatory oligonucleotides. Curr. Opin. Drug Discov. Devel. 2003; 6: 204–217, [CSA]
- Ulbrich H., Eriksson E. E., Lindbom L. Leukocyte and endothelial cell adhesion molecules as targets for therapeutic interventions in inflammatory disease. Trends Pharmacol. Sci. 2003; 24: 640–647, [CSA]
- Wagner H. Interactions between bacterial CpG-DNA and TLR9 bridge innate and adaptive immunity. Curr. Opin. Microbiol. 2002; 5: 62–69, [CSA]
- Wang H., Rayburn E., Zhang R., Zhang R. Synthetic oligodeoxynucleotides containing deoxycytidyl-deoxyguanosine dinucleotides (CpG ODNs) and modified analogs as novel anticancer therapeutics. Curr. Pharm. Des. 2005; 11: 2889–2907, [CSA]
- Wild J. S., Sur S. CpG oligonucleotide modulation of allergic inflammation. Allergy 2001; 56: 365–376, [CSA]
- Zhang Y., Shoda L. K., Brayton K. A., Estes D. M., Palmer G. H., Brown W. C. Induction of interleukin-6 and interleukin-12 in bovine B-lymphocytes, monocytes, and macrophages by a CpG oligodeoxynucleotide (ODN 2059) containing the GTCGTT motif. J. Interferon Cytokine Res. 2001; 21: 871–81, [CSA]
- Zhao Q., Temsamani J., Zhou R., Agrawal S. Pattern and kinetics of cytokine production following administration of phosphorothioate oligonucleotides in mice. Antisense Nucl. Acid Drug Dev. 1997; 7: 495–502, [CSA]