
Abstract
Sodium dichromate dihydrate (SDD), an inorganic compound containing hexavalent chromium (Cr(VI)), is a common environmental contaminant of groundwater sources due to widespread industrial use. There are indications in the literature that Cr(VI) may induce immunotoxic effects following dermal exposure, including acting as both an irritant and a sensitizer; however, the potential immunomodulatory effects of Cr(VI) following oral exposure are relatively unknown. Following the detection of Cr(VI) in drinking water sources, the National Toxicology Program (NTP) conducted extensive evaluations of the toxicity and carcinogenicity of SDD following drinking water exposure, including studies to assess the potential for Cr(VI) to modulate immune function. For the immunotoxicity assessments, female Fischer 344/N (F344/N) and Sprague Dawley (SD) rats and female B6C3F1 mice were exposed to SDD in drinking water for 28 consecutive days and evaluated for alterations in cellular and humoral immune function as well as innate immunity. Rats were exposed to concentrations of 0, 14.3, 57.3, 172, or 516 ppm SDD while mice were exposed to concentrations of 0, 15.6, 31.3, 62.5, 125, or 250 ppm SDD. Final mean body weight and body weight gain were decreased relative to controls in 250 ppm B6C3F1 mice and 516 ppm SD rats. Water consumption was significantly decreased in F344/N and SD rats exposed to 172 and 516 ppm SDD; this was attributed to poor palatability of the SDD drinking water solutions. Several red blood cell-specific parameters were significantly (5–7%) decreased in 250 ppm mice; however, these parameters were unaffected in rats. Sporadic increases in the spleen IgM antibody response to sheep red blood cells (SRBC) were observed, however, these increases were not dose-dependent and were not reproducible. No significant effects were observed in the other immunological parameters evaluated. Overall, exposure to Cr(VI) in drinking water had limited effects on the immune system in both rats and mice.
Introduction
Sodium dichromate dihydrate (SDD), one of many inorganic compounds containing hexavalent chromium (Cr(VI)), is an environmental contaminant of drinking water sources; a recent report by the Environmental Working Group (EWG) indicated the detection of low levels of Cr(VI) in drinking water sources in all 50 US states, potentially exposing over 200 million individuals (EWG Citation2016). Cr(VI), along with trivalent chromium (Cr(III)), is a common form of elemental chromium, which occurs naturally in rocks, plants, and soil; Cr(VI) and Cr(III) are also the most stable oxidation states of chromium. Cr(III) is a proposed essential nutrient, while Cr(VI) is predominantly produced during industrial activities. Cr(VI) has both acidic and strongly oxidizing properties and can form some soluble salts, leading to the use of Cr(VI) in a variety of industries including wood preservation, leather tanning, and stainless steel production. Cr(VI) is also found in a range of consumer products, including dyes, paints, inks, plastics, and pigments in photography (USEPA Citation2010). The effects of inhalation exposure to Cr(VI) compounds have been extensively researched, and the National Toxicology Program (NTP) Report on Carcinogens lists Cr(VI) compounds as known human carcinogens due to increased rates of lung cancer in occupationally-exposed workers (NTP Citation2016). Cr(VI) has also been classified as an occupational carcinogen by both the International Agency for Research on Cancer (IARC; Group 1) and the U.S. Environmental Protection Agency (USEPA; Group A).
The presence of Cr(VI) in drinking water sources has been a health concern in multiple states, but has recently been revived as a public health issue in North Carolina due to controversy regarding sources of Cr(VI) contamination as well as what groundwater levels of Cr(VI) are believed to be safe. The North Carolina groundwater quality standard for total Cr is currently set at 10 parts per billion (ppb), with a health screening level of 0.07 ppb; the EPA Maximum Contaminant Level (MCL) for total Cr is currently 100 ppb (NC DENR Citation2015). In a press release dated 21st April 2015, the NC Department of Environmental Quality (DEQ) reported levels of contaminants, including Cr, that exceeded state groundwater standards (i.e. >10 ppb) in samples of well water from homes near coal ash ponds (NC DEQ Citation2015). There have been conflicting reports on the source of the water contamination, however, as it is unclear whether the high levels of Cr are due to the nearby coal ash ponds or occur naturally in the region. Vengosh et al. (Citation2016) performed geochemical analysis to better identify the source of the high levels of Cr and Cr(VI) and determined that the Cr(VI) was likely naturally occurring in groundwater due to the geochemistry of the North Carolina Piedmont. Regardless of the source, however, Cr(VI) in drinking water remains a public health concern.
Due to the detection of Cr(VI) in drinking water sources and a lack of adequate information in the literature at the time regarding the toxicity and/or carcinogenicity of Cr(VI) following oral exposure, Cr(VI) was nominated to the NTP in 2000 and 2001 by the California Congressional Delegation, the California Environmental Protection Agency, and the California Depart-ment of Health Services. The NTP conducted extensive evaluations of the toxicity and carcinogenicity of SDD (NTP Citation2007, Citation2008; Stout et al. Citation2009; Collins et al. Citation2010; Witt et al. Citation2013), including studies to assess the capability of Cr(VI) to modulate immune function. The program of work performed by the NTP played a prominent role in the establishment of an enforceable standard for Cr(VI) in drinking water in California, which was the first in the United States (CDPH Citation2014; Xie et al. Citation2016). Along with the evaluations performed by the NTP, the toxicity and carcinogenicity of Cr(VI) have been assessed in several reviews and manuscripts (IARC Citation1980; Costa Citation1997; USEPA Citation1998; Proctor et al. Citation2002; Sedman et al. Citation2006; ATSDR Citation2012; Thompson et al. Citation2012, Citation2013).
Multiple targets have been identified for Cr(VI)-mediated toxicity, including the liver and kidney, the respiratory and alimentary tracts, and the hematological and immune systems. Cr(VI) has been demonstrated to act as an irritant and sensitizer following dermal exposure and humans working with Cr(VI) can become allergic following constant contact (Bruynzeel et al. Citation1988; Kimura Citation2007). Inhalation exposure to Cr(VI), as sodium dichromate, has also been shown to be immunotoxic in experimental animals, and rats exposed to 25–200 μg/m3 (≈ 0.0023–0.0187 ppm, based on the molecular weight of sodium dichromate) Cr(VI) for 28 or 90 days had increased spleen weights and an increased response to sheep red blood cells (SRBC) (Glaser et al. Citation1985). Inhalation exposure to Cr(VI) also enhanced responses to antigens, amplified serum immunoglobulin (Ig) concentrations, and increased numbers of granulocytes and lymphocytes in bronchoalveolar lavage (BAL) fluid; numbers of macrophages decreased following subchronic exposure (Glaser et al. Citation1985). Immunomodulatory effects have been reported in rats following oral exposure to Cr(VI), including alterations in the proliferative response of splenocytes to mitogens and allogenic spleen cells (Snyder and Valle Citation1991). A second study was also identified demonstrating that exposure of male and female Sprague Dawley rats to Cr(VI) (0–25 ppm; as potassium dichromate) in drinking water resulted in significant accumulation of Cr in the spleen after one year of exposure (MacKenzie et al. Citation1958).
The immune system is vital to surveillance and protection against pathogens and tumor development and plays a significant role in the maintenance of homeostasis and overall health. The goal of these studies was to assess the potential for Cr(VI) to modulate immune function following oral exposure. Female Fischer 344/N (F344/N) rats, Sprague Dawley (SD) rats, and B6C3F1 mice were exposed to Cr(VI) in drinking water for 28 days and evaluated for alterations in cellular and humoral immune responses as well as innate immunity (Luster et al. Citation1988). Overall, exposure to Cr(VI) in drinking water had limited effects on the immune system in both rats and mice.
Materials and methods
Chemicals
Hexavalent chromium (Cr(VI)) was obtained from Aldrich Chemical (Milwaukee, WI) as sodium dichromate dihydrate (SDD) (MW: 298.0, CAS #7789-12-0) and prepared at Virginia Commonwealth University (VCU) following procedures previously established by Battelle for the National Toxicology Program (NTP). Stability studies performed by the National Institute of Environmental Health Sciences (NIEHS) indicated that SDD formulations were stable for up to 42 days when stored at 25 °C and protected from light exposure. Fresh SDD solutions were prepared weekly in tap water, stored refrigerated, and administered to animals in red polycarbonate screw top bottles with Teflon/Silicone septa (Sigma, St. Louis, MO). Tap water was used as the vehicle control.
Cyclophosphamide (CPS; Sigma) served as the positive control for the evaluation of selected organ weights, hematological parameters, B-cell, T-cell, and T-cell subset surface markers, the spleen IgM antibody-forming response, and the mixed leukocyte response. Animals exposed to the positive control were administered CPS in phosphate-buffered saline (PBS, pH 7.4) by intraperitoneal (IP) injection on each of the last 4 days of the 28 day study. All rats received 50 mg/kg by injection of 10 mg/ml CPS at 0.05 ml/10 g body weight, while B6C3F1 mice received 50 mg/kg by injection of 5 mg/ml CPS at 0.1 ml/10 g body weight.
Rabbit anti-asialo GM1 (AAGM1) antibody (Wako BioProducts, Richmond, VA) was diluted in sterile physiological saline and administered as the positive control in the natural killer (NK) cell assay. AAGM1 was administered by intravenous (IV) injection 24 h prior to determination of NK activity. F344/N and SD rats received 1.0 ml of a 1:10 dilution while B6C3F1 mice received 0.2 ml of a 1:10 dilution.
Animals
Female Fischer 344/N rats and female Sprague Dawley rats were purchased from Charles River Laboratories (Portage, MI) and were 6–8 (F344/N) or 8–10 (Sprague Dawley) weeks of age upon receipt. Female B6C3F1 mice were purchased from Taconic Farms (Germantown, NY) and were 8–10 weeks of age when the study began. Animals were ordered virus antibody free and were quarantined for at least 5–7 days prior to the beginning of the study. Rats and mice were individually identified by tail marking and housed two (rats) or four (mice) animals per cage in plastic shoe box cages with sawdust (hardwood) bedding. Cages were cleaned and sanitized twice per week. The cages were covered with filtered bonnets and placed on the rack such that individual dose groups were not all on one level. Animal holding rooms were maintained at 64.4–78.8 °F and 30–70% relative humidity with a 12-h light/dark cycle. All animal studies were conducted at VCU under NTP contract #N01-ES-55538. All animal procedures were approved by the VCU Animal Care and Use Committee.
Rats and mice were maintained on the NIH 07 diet and given ad libitum access to tap water (vehicle) or sodium dichromate dihydrate (SDD) solution from water bottles. Rats were administered SDD solutions at concentrations of 14.3, 57.3, 172, or 516 ppm, while mice were administered SDD solutions at concentrations of 15.6, 31.3, 62.5, 125, or 250 ppm. Water consumption was calculated twice weekly during the 28-day exposure period. Control drip bottles were placed on empty cages identical to those used in the study and positioned on each rack in the animal holding room to account for water loss during cage handling and unintentional rack movement.
Rats and mice were randomized using a computer-generated randomization procedure. Following randomization, animals were assigned to study groups, with each group consisting of 8 (F344/N rats, B6C3F1 mice) or 10 (Sprague Dawley rats) animals. Two rat strains were utilized to capture potential effects in both an inbred (F344/N) and outbred (Sprague Dawley) rat model. Two repeat studies were performed in mice. All animals received vehicle control or SDD solution for 28 consecutive days and were evaluated for immunological or toxicological parameters on Day 29 at study termination. Doses of SDD were selected based on the doses utilized in the NTP’s studies of SDD in order to maintain consistency across studies (NTP Citation2007, Citation2008). The assay cohorts and groups utilized in these studies are detailed in .
Table 1. Exposure endpoints.
General toxicology endpoints
All animals were observed for clinical signs of toxicity each time the SDD solutions were changed during the study period. Body weights were measured on the first day of exposure, on Days 8, 15, 22, and on Day 29 at study termination.
Organ weights
The liver, spleen, lungs, thymus, and kidneys with adrenals were removed from each animal at study termination, cleaned of connective tissue, and weighed. These organs, along with the bone marrow (femur) and mesenteric lymph nodes, were fixed in 10% neutral buffered formalin and retained for optional future histopathological analysis.
Hematology
At study termination, animals were anesthetized with CO2 and blood was collected from the retro-orbital plexus (rats) or sinus (mice) of each animal into EDTA tubes for hematological analysis. A Sysmex K-1000 Hematology Analyzer (TOA Medical Electronics Co. LTD., Kobe, Japan) was used to analyze the following hematological parameters: number of erythrocytes and leukocytes, hemoglobin, hematocrit, mean corpuscular volume (MCV), mean cell hemoglobin (MCH) and mean cell hemoglobin concentration (MCHC), and platelets. Reticulocyte numbers were evaluated using thiazole orange (Becton Dickinson, San Jose, CA), an RNA stain, in conjunction with flow cytometric analysis. Leukocyte differentials were determined from blood smears prepared from each animal at the time of blood collection. Blood smears were allowed to air-dry, fixed with methanol, and then stained with Wright-Giemsa (Thermo Fisher Scientific, Waltham, MA) for leukocyte differential determination.
Immunology endpoints
Quantification of lymphocyte sub-populations
Flow cytometry was utilized to determine T-cell subsets and total numbers of T-cells, B-cells, NK cells, and monocytes in SDD-treated animals via a previously published method (Guo et al. Citation2000). On the day of study termination, spleen single cell suspensions from each animal were prepared by either using a Stomacher 80 lab blender (rats) or pressing the spleen in-between the frosted ends of two microscope slides (mice). The suspensions were treated with ammonium chloride to lyse red blood cells and then seeded at 106 cells/well into a 96-well microtiter plate; analysis of each spleen preparation required six wells. The Fc receptor was blocked with anti-CD16/CD32 and spleen cell suspensions were washed with staining buffer (1% bovine serum albumin [BSA] and 0.1% sodium azide in PBS). Monoclonal antibody (100 µl; diluted 1:80 in staining buffer) labeled with either phycoerythrin (PE) or fluorescein isothiocyanate (FITC) was added to each well and allowed to incubate for 30 min at 4 °C. Following incubation, cells were washed twice and treated with 100 μl propidium iodide (PI), a DNA-specific fluorescent stain used to assess viability.
Antibodies utilized for flow cytometric analysis of mouse spleen cell suspensions included: goat anti-mouse Ig-FITC, rat anti-mouse CD4-PE (TH cells), rat anti-mouse CD8a-FITC (TCTL cells), Armenian hamster anti-mouse CD3-FITC (mature T-lymphocytes), mouse anti-mouse NK1.1 (NK cells), and rat anti-mouse Mac3-FITC (monocytes). Specific monoclonal antibodies used for rat (both strains) spleen cell suspensions included: OX-19-PE (CD5+ T-cells), OX-38-FITC (CD4+ T-cells; TH), OX-8-FITC (CD8+ T-cells; TCTL), OX-19+-OX-19+-FITC (CD4+CD8+ T-cells), OX-33-FITC (CD45+ B-cells), NKR-P1A-FITC (splenic NK cells), OX-8-PE (splenic NK cells), and HIS36-PE (splenic macrophages). Isotype-matched antibodies to irrelevant epitopes were utilized as controls.
Samples were analyzed using a FACScan (Becton Dickinson, San Jose, CA) flow cytometer with CellQuest software. Cell preparations in control wells were run and viewed as a dot plot of forward scatter (FSC) on the X-axis, and side-scatter (90°; SSC), on the Y-axis in the linear mode. The majority of the red cell population and debris was eliminated electronically by increasing the threshold setting on FSC. Photomultiplier tubes (PMT) for fluorescence operated in the log mode. Non-viable cells were eliminated by setting a live gate on FL3 (red fluores-cence; PI). Cells stained with FITC were detected by the FL1 PMT (green fluorescence) and cells stained with PE were detected by the FL2 PMT (orange fluorescence). Five thousand cells were counted for each sample and data for all samples were acquired in list mode with no other gating. Following acquisition, the list data for each sample were recalled from the computer memory. The remainder of debris and any red cells remaining after lysis was eliminated from analysis by electronic gating of a FSC by SSC dot plot. The percentage of B cells and T-cells in the gated population was calculated from histograms of fluorescence intensity vs. cell number. The T-cell subsets were calculated from dot plots of FL1 vs. FL2, with the subset being positive for both FL1 and FL2.
IgM antibody response to T-dependent antigen SRBC
Spleen
The primary IgM antibody-forming cell (AFC) response to sheep red blood cells (SRBC) was evaluated via a modification of the Jerne and Nordin (Citation1963) hemolytic plaque assay previously described by White et al. (Citation2010). Rats and mice were immunized intravenously with 2 × 10⁸ (rats) or 7.5 × 10⁷ (mice) SRBC (Lampire Biological Laboratory, Pipersville, PA) on Day 25 of the exposure period. On Day 29 at study termination, a single cell suspension of splenocytes was prepared from each animal and diluted in Earle’s Balanced Salt Solution (EBBS; GIBCO, Grand Island, NY) and counted. Single aliquots of spleen cells were added to individual test tubes containing guinea pig complement, SRBC, and warm agar, and mixed well. The cell mixture was then plated in a petri dish, covered with a microscope slide cover slip, and allowed to incubate at 37 °C for 3 h. Following incubation, plaques that had developed were counted at 6X magnification using a Bellco plaque viewer. Counts were then expressed as specific activity (AFC/106 spleen cells) and total spleen activity (AFC/spleen).
Serum
Serum primary IgM antibody titers to SRBC were determined in B6C3F1 mice and SD rats using a modified enzyme-linked immunosorbent assay (ELISA) previously described by Temple et al. (Citation1993). SRBC antigen was prepared by adding 1.0 ml of the SRBC preparation to 100 ml PBS. The high-salt release SRBC antigens were applied to Immulon 2 (Dynex Labs, Chantilly, VA) flat-bottom microtiter plates and incubated at 4 °C overnight. Following incubation, plates were blocked with 0.05% Tween-20 in PBS to prevent non-specific binding. Serum from animals also utilized for the hemolytic plaque assay was serially diluted (starting at 1:16) in 0.05% Tween-20 in PBS, added to the plates, and the plates were incubated at room temperature (RT) for ≈ 90 min. The plates were then washed and secondary antibody (affinity-purified horseradish peroxidase-conjugated goat anti-IgM mouse) (Southern Biotechnology Associates, Birmingham, AL) at a 1:500 dilution and added to the plates. The plates were incubated with secondary antibody for ≈ 90 min at RT. Following incubation the plates were washed again to remove unbound antibody and a peroxidase substrate (2,2′-azino-bii[3-ethyl-benzthiazoline-6-sulfonic acid], Sigma) was added. The plates were then incubated until the first dilution of serum reached an optical density between 1.2 and 2 (with background subtracted) and read at 405 nm using a Thermomax plate reader (Molecular Devices, Sunnydale, CA). Final antibody titers were calculated using SoftMax software Version 2.32 as previously described (Kawabata et al. Citation1995).
Serum IgM antibody response to T-dependent antigen KLH
F344/N rats were sensitized intravenously with keyhole limpet hemocyanin (KLH) (2 mg/rat; 0.5 ml) on Day 21 of the exposure period and serum was isolated on Day 29 at study termination. On the day prior to ELISA, Immulon 2 flat-bottom plates (Dynex Labs, Chantilly, VA) were coated with 0.5 μg KLH/well in a PBS coating buffer and incubated overnight at 2–8 °C. ELISA plates were washed and blocked with 200 μl blocking buffer (PBS with 0.05% Tween 20) for 1 hr at RT. Following blocking, plates were washed, serum samples were added using a double dilution procedure, and the plates were incubated for 1 h at RT. After 1 h plates were washed again and 100 μl goat anti-rat IgM-HRP antibody (diluted 1:500 in blocking buffer) was added to each well. The plates were incubated 1 h at RT, washed with buffer (PBS with 0.05% Tween-20), and 100 μl 2,2′-azino-bis-(3-ethylbenzthiazoline 6-sulfonic acid) diammonium (ABTS) substrate was added to each well. Following a 45-min incubation, wells were evaluated at 405 nm using the plate reader. Levels of KLH antibody in unknown samples were determined based on rat IgM standards run in parallel.
Mixed leukocyte response to DBA/2 mouse spleen cells
The mixed leukocyte response in SDD-treated B6C3F1 mice was evaluated using a 4:1 ratio of DBA/2 allogenic cells as previously described (Holsapple et al. Citation1983). Responder splenocytes from exposed B6C3F1 mice (100 μl; 106 cells/ml) were co-cultured with stimulator cells (DBA/2 spleen cells) in a U-bottom microtiter plate (Costar 3799; Sigma). Stimulator cells were treated with mitomycin C prior to co-culture in order to inhibit cell proliferation. The cells were co-cultured for 5 days and [3H]-thymidine (1 μCi; PerkinElmer, Waltham, MA) was added during the last 18 hr. Cells were collected using a cell harvester and were counted in a liquid scintillation counter (LKB, Victoria, AUS). Incorporation of [3H]-thymidine into DNA was utilized as the measure of cell proliferation and data was expressed as counts per minute (cpm)/105 cells.
Anti-CD3 antibody-mediated T-cell proliferation
The spleen cell proliferative response to anti-CD3 antibody-mediated T-cell proliferation was assayed as previously described (Guo et al. Citation2001). Single cell suspensions were prepared from spleens harvested from rats and mice at study termination, counted, and adjusted to 5 × 10⁶ (rats) or 2 × 10⁶ (mice) cells/ml in RPMI 1640 media (Sigma) supplemented with 10% fetal calf serum (FCS; HyClone, Logan, UT) and 50 µM 2-mercaptoethanol (Sigma). Sterile flat-bottom microtiter plates were treated with either 100 μl anti-CD3 antibody (Pharmingen, San Diego, CA) (0.1 μg/well), 100 μl PBS, or left untreated, and were incubated overnight at 4 °C prior to the addition of cell suspensions. Following incubation, cell suspensions were added to the treated plates (5 × 10⁵ or 2 × 10⁵/well for rats or mice, respectively) and cultured for 3 days and 1 μCi [3H]-thymidine was added to the cells during the last 18–24 h of culture. Cells were collected using a cell harvester and counted in a LKB liquid scintillation counter. Incorporation of [3H]-thymidine into the DNA of proliferating cells was measured and the data was expressed as CPM/5 × 105 cells (rats) or CPM/2 × 105 cells (mice).
Natural killer cell activity
The activity of natural killer (NK) cells in SDD-treated rats and mice was determined using a modified technique previously described by Reynolds and Herberman (Citation1981). Spleens were harvested at study termination from both rats and mice and single cell suspensions of splenocytes (effector cells) were prepared. Target YAC-1 cells (maintained in a stock culture at VCU) were adjusted to a concentration of 107 cells/ml and labeled via incubation with 500 μCi of [51Cr] (as sodium chromate in normal saline; PerkinElmer) for 90 min at 37 °C with frequent agitation. Following incubation, cells were washed with RPMI 1640 media four times (rats) or a balanced salt solution with 25 mM HEPES (Sigma) three times (mice), counted, and adjusted to 105 nucleated cells/ml. Prior to the final wash, the [51Cr]-YAC cells were incubated at RT.
Serial dilutions of splenocytes (2 × 10⁷, 1 × 10⁷, 5 × 10⁶, 2.5 × 10⁶, 1.25 × 10⁶, and 0.625 × 10⁶ cells/ml) were prepared in duplicate in RPMI 1640/10% FCS media and plated (100 μl/well) in 96-well round-bottom microtiter plates. [51Cr]-labeled YAC-1 targets were prepared at a level of 105 cells/ml and 100 µl aliquots were added to each well to yield 200:1, 10:1, 50:1, 25:1, 12.5:1, and 6.25:1 effector:target ratios. Maximum release was determined by adding 100 μl Triton X-100 (0.1%) to 12 replicate wells containing only target cells. Spontaneous release was determined by adding 100 μl media to each effector:target well and incubating for 4 h at 37 °C at 5% CO2. Following incubation, the plates were centrifuged at 400 × g for 10 min and 100 μl supernatant was removed from each well. [51Cr] release was counted in each aliquot of supernatant using a γ-counter to obtain CPM, and the mean (± SE) percent cytotoxicity at each effector concentration was determined (Kiessling et al. Citation1975). Cytotoxicity values for exposure groups were compared to values for the respective vehicle control animals (F344/N rats, SD rats, or B6C3F1 mice). Percent cytotoxicity was calculated as: 100 × [(CPMexp − CPMspon)/(CPMtotal − CPMspon)], where CPMexp = counts per minute in experimental wells, CPMspon = spontaneous release, and CPMtotal = total release upon the addition of 0.1% Triton X-100.
Statistical analysis
The type of analysis conducted was determined by the Bartlett’s test for homogeneity (Bartlett Citation1937). Homogenous data was analyzed using a one-way analysis of variance (ANOVA) (Kruskal and Wallis Citation1952) and differences between vehicle control and exposed groups were determined using the Dunnett’s test (Dunnett Citation1955). Non-homogenous data was analyzed using a non-parametric ANOVA (Wilson Citation1956) and differences between vehicle control and exposed groups were determined using the Wilcoxon Rank test. (Gehan-Wilcoxon Test Citation1975) The Student’s t-test (Sokal and Rohlf Citation1981) was used to compare positive controls to vehicle controls, and the Jonckheere’s test (Hollander and Wolfe Citation1973). was utilized to analyze dose-related trends across the vehicle control and SDD-exposed groups. p-Values of ≤0.05 were considered statistically significant (*p ≤ 0.05; **p ≤ 0.01 as compared to the respective vehicle control group). The term “significant” in the text indicates that the response was statistically significant at p ≤ 0.05 or less.
Results
Survival
All animals survived to the end of the study.
Drinking water consumption
Drinking water consumption (grams/animal/day) was calculated as described in the “Methods” section. Statistically significant decreases in drinking water consumption were calculated at all timepoints in both F344/N and SD rats at the two highest dose levels (172 and 516 ppm) and at seven of eight timepoints in B6C3F1 mice at the highest dose level (250 ppm) (data not shown). These decreases in water consumption were attributed to poor palatability. Drinking water consumption was not affected at any other dose levels in either rat strain. Significant increases in drinking water consumption were observed in mice at the two lowest dose levels (15.6 and 31.3 ppm), however, these only occurred at the final timepoint (Day 29) (data not shown).
Body weights and weight gain
The periodic body weights of F344/N and SD rats were generally unaffected by SDD exposure. The periodic body weights of SD rats exposed to 172 and 516 ppm SDD were decreased relative to vehicle controls, however, the observed decreases were not statistically significant. There was a significant decrease in body weight gain (45% lower) relative to control between Days 1–8 of the study in F344/N rats exposed to 516 ppm SDD (). This was not believed to be attributed to the observed decrease in water consumption, as body weight and body weight gain were not affected at any other timepoints in the two highest exposure groups. Body weight gain was significantly decreased relative to control at all time-points (54%, Days 1–8; 34%, Days 1–15; 27%, Days 1–22; 28%, Days 1–29) in SD rats exposed to 516 ppm SDD and was also significantly decreased between Days 1–15 (27% lower) and 1–22 (19% lower) in SD rats exposed to 172 ppm SDD (). The observed decreases in body weight gain were consistent with the calculated decreases in water consumption at the two highest dose groups. B6C3F1 mice exposed to 250 ppm SDD lost weight between Days 1 and 8 of the study period, and were also observed with significantly decreased periodic body weights (5–8%) at all timepoints as well as a significant decrease in terminal body weight gain (63%) relative to vehicle controls (). A statistically significant decrease in terminal body weight gain (26%) was also observed in mice exposed to 125 ppm SDD. Exposure to cyclophosphamide (CPS; positive control) caused a significant decrease in body weight gain in F344/N rats (albeit only in second of two studies), SD rats, and B6C3F1 mice (albeit only in one of two studies).
Figure 1. Mean body weight gain in female Fischer 344/N and Sprague Dawley rats and B6C3F1 mice following exposure to SDD in drinking water for 28 days. Mean body weight gain (g) reported for Days 1–8, 1–15, 1–22, and 1–29 (study termination). Mean body weight gain of (A) Fischer 344/N rats, (B) Sprague Dawley rats, and (C) B6C3F1 mice. Data are expressed as mean ± SEM. *p ≤ 0.05, **p ≤ 0.01 for exposed groups compared to vehicle contol. N = 32 for F344/N rats. N = 40 for SD rats and B6C3F1 mice. VH: vehicle control.
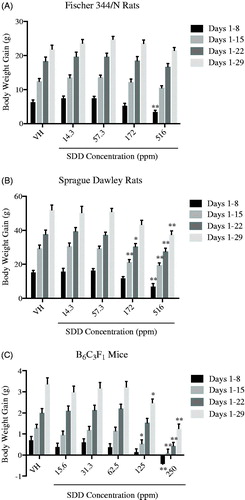
Table 2. MCV and MCH levels in the blood of Fischer 344/N and Sprague Dawley rats.
Organ weights and histopathology
Relative liver weights were significantly decreased in F344/N rats exposed to 14.3 and 172 ppm SDD (8% and 11% lower, respectively), however, this trend was not dose-dependent and these effects did not occur in a second study; exposure to SDD did not significantly affect absolute or relative liver weights in SD rats (data not shown). There were no significant differences in absolute or relative spleen weight in F344/N or SD rats (data not shown). Relative kidney weights were significantly decreased (8%) in F344/N rats exposed to 14.3 ppm SDD, however, this effect was not dose-dependent and did not occur in the second study (data not shown). There were no significant differences in absolute or relative thymus weights in either rat strain (data not shown). No gross pathological lesions were observed in either rat strain at study termination.
There was a statistically significant decrease in relative spleen weight (16%) in B6C3F1 mice exposed to 31.3 ppm SDD, however, this effect was not dose-dependent and did not repeat in the second study (data not shown). Exposure to 250 ppm resulted in a significant increase in the relative liver weight (6%) of the mice; however, there were no significant differences in absolute or relative liver weight in a second mouse study (data not shown). There were no significant differences in the relative weights of the thymus, lungs, or kidneys in SDD-exposed mice (data not shown). No gross pathological lesions were observed in mice at study termination.
Hematological parameters
Blood was collected from both rat strains and mice at Day 29 for evaluation of hematological parameters. Erythrocyte and leukocyte counts, mean cell hemoglobin concentration (MCHC), platelets, and reticulocytes were unaffected by SDD exposure in both species. Hemoglobin in F344/N and SD rats was unaffected by SDD exposure, but was significantly decreased in mice exposed to 250 ppm SDD in both studies (4% and 5%, respectively). Hematocrit in F344/N and SD rats was also unaffected by SDD exposure, but significantly decreased (4%) in mice exposed to 250 ppm SDD, albeit only in one of the two studies (data not shown).
Mean corpuscular volume (MCV) and mean cell hemoglobin (MCH) were slightly increased in F344/N rats in all SDD treatment groups, relative to vehicle control, however the response was not dose-dependent (). MCV was significantly increased in F344/N rats exposed to 14.3 (3%) or 516 (4%) ppm SDD, however, the maximum increase of 4% at the high dose level was not deemed biologically significant. MCV was unaffected by SDD exposure in SD rats (). A dose-dependent decrease in MCV was observed in mice in both studies, with statistically significant decreases occurring at the three highest and four highest dose levels in the first and second studies, respectively (). The largest decrease in MCV in mice was 6%, which occurred at the highest dose level (250 ppm) in the first study. MCH was significantly increased in F344/N rats exposed to 14.3 (7%) or 57.3 (7%) ppm SDD, but was significantly decreased in SD rats exposed to 57.3 (3%) or 516 (4%) ppm SDD (). The significance of the effects on MCH appeared to be due to the variability of this parameter, however, the lack of a consistent pattern between species and/or strains suggests that the response may not be biologically relevant. MCH was significantly decreased (5%) in mice exposed to 250 ppm SDD, albeit only in one of the two studies ().
Table 3. MCV and MCH levels in the blood of B6C3F1 mice.
Exposure to SDD did not significantly affect absolute or percent leukocyte counts in F344/N rats, SD rats, or B6C3F1 mice with the exception of a statistically significant increase in the absolute number of leukocytes in F344/N rats exposed to 14.3 ppm SDD. This increase correlated with the mild increases in cell number and percentage of neutrophils observed in this group (data not shown). As expected, in both F344/N and SD rats, exposure to the positive control, CPS, resulted in significant decreases in both reticulocytes (89% and 91%, respectively) and leukocytes (76% and 78%, respectively). In both studies in B6C3F1 mice, CPS exposure significantly decreased reticulocytes and leukocytes by ≈60%.
Spleen lymphocyte sub-populations
Flow cytometry and surface marker analysis were utilized to calculate the absolute and percent numbers of spleen lymphocyte sub-populations in F344/N and SD rats and B6C3F1 mice exposed to SDD ( and ). Spleen cell suspensions were prepared from each animal and the sub-populations evaluated included spleen T-lymphocytes, immature T-lymphocytes, T-helper cells (TH), T-cytotoxic cells (TCTL), B-lymphocytes, NK cells, and monocytes. Absolute numbers of NK cells and macrophages were significantly increased (63% and 38%) in F344/N rats exposed to 172 or 14.3 ppm SDD, respectively (). Percent values of macrophages were significantly increased (51% and 41%, respectively) in SD rats exposed to 14.3 and 516 ppm SDD (). Percent values of B cells were significantly increased (6%) in mice exposed to 250 ppm SDD (). Percent values of TH cells were significantly increased in mice exposed to 15.6 (5%), 62.5 (9%), 125 (9%), and 250 (17%) ppm SDD (). Percent values of TCTL were also significantly increased in mice at the two highest exposure groups (11–15%). Absolute numbers of macrophages were significantly decreased in mice exposed to 31.3 (20%) and 125 (33%) ppm SDD; percent values were also significantly decreased in the 31.3, 62.5, and 125 ppm groups (). SDD exposure did not significantly affect total spleen cell numbers or absolute and percent numbers of any other spleen phenotypes in rats or mice ( and ). Exposure to the positive control, CPS, resulted in significant decreases in the absolute numbers of all cell populations evaluated in both species ( and ). Treatment with the positive control for the NK cell assay, anti-asialo GM1 (AAGM1), significantly decreased the number of splenic NK cells in both rats and mice ( and ).
Table 4. Spleen lymphocyte sub-populations in Fischer 344/N and Sprague Dawley rats.
Table 5. Spleen lymphocyte sub-populations in B6C3F1 mice.
Spleen and serum IgM antibody responses to SRBC
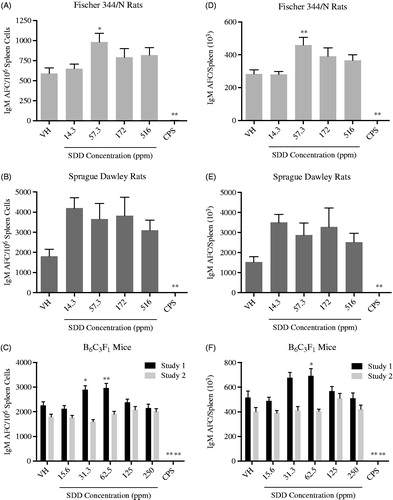
F344/N and SD rats and B6C3F1 mice were exposed to SDD for 28 days and immunized with SRBC on Day 25 of the study period. The spleen IgM antibody-forming cell (AFC) response was evaluated on Day 29, four days post-immunization, which is considered the peak day of the SRBC IgM response. The AFC response was measured as either AFC/106 spleen cells (specific activity) or AFC/spleen (total spleen activity). In both rat strains, exposure to SDD enhanced the IgM response at all dose levels when evaluated as either specific () or total activity (). In F344/N rats this increased response reached statistical significance at 57.3 ppm SDD for both specific (66%) and total spleen activity (62%). Exposure to 31.3 ppm SDD significantly increased specific spleen activity in mice (28.6%) while exposure to 62.5 ppm SDD significantly increased both specific (31.7%) and total (34%) spleen activity (). These increases were not dose-dependent, however, and did not repeat in a second study. As expected, exposure to the positive control, CPS, significantly decreased both specific and total spleen activity in F344/N and SD rats and B6C3F1 mice.
Figure 2. IgM antibody-forming cell (AFC) response to sheep red blood cells (SRBC) in female Fischer 344/N and Sprague Dawley rats and B6C3F1 mice following exposure to SDD in drinking water for 28 days. The AFC response to SRBC was evaluated in splenocyte suspensions prepared from previously immunized animals and reported as either specific activity (AFC/106 spleen cells) or total activity (AFC/spleen). Specific activity (AFC/106 spleen cells) in (A) F344/N rats, (B) SD rats, and (C) B6C3F1 mice. Total activity (AFC/spleen) in (D) F344/N rats, (E) SD rats, and (F) B6C3F1 mice. Data are expressed as mean ± SEM. *p ≤ 0.05, **p ≤ 0.01 for exposed groups compared to vehicle contol. N = 7 (VH, 14.3 and 172 ppm) or 8 (57.3 and 516 ppm) for F344/N rats. N = 10 for SD rats. N = 8 for B6C3F1 mice. VH: vehicle control; CPS: cyclophosphamide positive control (50 mg/kg).
Serum was collected from SD rats and B6C3F1 mice immunized with SRBC and analyzed for IgM anti-SRBC antibodies utilizing a previously developed ELISA procedure (Temple et al. Citation1993). There was no observed effect on serum IgM antibody titers following SDD exposure in either species (). Exposure to CPS significantly decreased anti-SRBC antibody titers in both species.
Table 6. Serum IgM antibody titers to SRBC in Sprague Dawley rats and B6C3F1 mice.
Serum IgM response to KLH
F344/N rats were exposed to SDD for 28 days and immunized with KLH on Day 23 of the study period. The serum IgM antibody response to KLH was measured on Day 29, six days post-immunization, which is considered the peak day of the KLH IgM response. IgM levels were calculated as μg/ml serum, and were not significantly affected by exposure to SDD at any dose level (data not shown). Exposure to CPS resulted in significant suppression (95%) of the IgM response to KLH.
Mixed leukocyte response to DBA/2 mouse spleen cells
Spleen cell suspensions were prepared from B6C3F1 mice on Day 29 of the study and the spleen response to allogeneic lymphocytes was assessed via a one-way mixed leukocyte reaction (MLR). No significant differences in this measure of cell-mediated immunity were observed in mice exposed to SDD relative to vehicle controls (data not shown). Exposure to the positive control, CPS, significantly suppressed the MLR in mice in both studies, as expected.
Spleen cell anti-CD3-mediated proliferative response
On Day 29 of the study period, spleen cells were isolated from SDD-treated F344/N and SD rats and B6C3F1 mice and cultured with and without anti-CD3 antibody to stimulate the T-cell proliferative response. Treatment with SDD did not significantly affect the CD-3-mediated proliferative response in stimulated spleen cells from either species, while treatment with the positive control, CPS, significantly suppressed the response in both stimulated and unstimulated spleen cell cultures from rats and mice (data not shown).
Natural Killer (NK) cell activity
Spleen cell suspensions were prepared from SDD-treated F344/N and SD rats and B6C3F1 mice on Day 29 of the study period for assessment of NK cell activity. Six ratios of effector-to-target cells were utilized in a 4-hr [51Cr]-release assay, with a linear response region calculated between 100:1 and 25:1 effector:target ratios. NK cell activity was calculated as percent cytotoxicity at each effector:target ratio, with SDD exposure having no significant effect on NK cell activity at any dose level in F344/N rats and B6C3F1 mice. There was a slight, albeit not significant, increase in NK cell activity at various ratios in spleen cell cultures from SD rats exposed to the two highest doses (172 and 516 ppm) (data not shown). The positive control, anti-asialo GM1 (AAGM1), significantly suppressed NK cell activity at all effector:target ratios in both species, with the exception of the 6.25:1 ratio in SD rats and B6C3F1 mice (Study 1).
Discussion
Studies of inhalation and dermal exposure to Cr(VI) indicate sensitizing and immunomodulatory effects in both humans and experimental animals (Cohen et al. Citation1998; Hansen et al. Citation2003). Inhalation exposure to Cr(VI) has been shown to induce hypersensitivity reactions in response to chromium (Cr) challenge in humans and to increase T-cell-dependent antigen responses to sheep red blood cells (SRBC) and levels of immunoglobulin (Ig) in animals (Glaser et al. Citation1985). Significant data gaps exist regarding the immunotoxicity of Cr(VI) following oral exposure, however, and the goal of this study program was to address the effects of drinking water exposure to Cr(VI) on the innate and acquired immune systems. Exposure to SDD via drinking water did not induce the significant immunomodulatory effects that have been reported with dermal or inhalation exposure; this is likely due to differences in the absorption, distribution, metabolism, and excretion of SDD following oral exposure.
In the present study, female Fischer 344/N (F344/N) rats, Sprague Dawley (SD) rats, and B6C3F1 mice were administered Cr(VI), as SDD, in drinking water for 28 days. Significant decreases in water consumption were noted in both strains of rats at the two highest doses (172 and 516 ppm) and in mice at the highest dose (250 ppm); this was attributed to poor palatability of the SDD drinking water solutions. The decreases in water consumption in these dose groups were associated with slight, albeit significant, decreases in body weight gain relative to control in F344/N rats exposed to 516 ppm SDD and decreases in both mean body weight and body weight gain relative to control in B6C3F1 mice exposed to 250 ppm SDD. There was also a decrease in body weight gain in SD rats at the highest exposure level (516 ppm), however, it was not significant. Similar effects have been reported in 3-month and 2-year studies of rats exposed to SDD in drinking water (NTP Citation2007, Citation2008). While the observed decreases in body weight were significant, they were likely a result of poor palatibility of the high doses of SDD and subsequent decreased water consumption, and not directly related to SDD toxicity. There were sporadic but stastically significant changes in relative and absolute organ weights in both rats and mice, but these were not deemed toxicologically significant due to a lack of a dose-response trend. Likewise, changes in organ weights noted in the mice did not repeat between two studies.
Following exposure, SDD is dispersed through the bloodstream and taken up by erythrocytes, where it is then reduced to trivalent chromium, or Cr(III). Cr(III) binds hemoglobin and forms a stable complex that is maintained in erythrocytes until cell death (ATSDR Citation2012). Reports of hematological effects in occupationally-exposed individuals are inconsistent; however, small alterations in hematological parameters may still fall in a normal range and be difficult to detect (ATSDR Citation2012). The only significant hematological alterations observed in this study were in the levels of MCV and MCH, which were increased in F344/N rats but decreased in B6C3F1 mice at multiple doses, and hemoglobin, which was significantly decreased in B6C3F1 mice at the highest dose (250 ppm) of SDD. Slight decreases in MCH were observed in SD rats, but these were not dose-dependent and therefore, not deemed biologically significant. While there were differences between the effects on MCV and MCH in rats and mice, the magnitude of change was too low to confirm species-specific anemic responses to SDD exposure. The results observed in mice in these studies were generally consistent with the 3-month and 2-year studies of oral SDD exposure performed by the NTP, in which a microcytic hypochromic anemia was reported in both rats and mice exposed to sodium dichromate dihydrate (NTP Citation2007, Citation2008). In both the 3-month and 2-year NTP studies, evidence of anemia in rats was indicated by decreases in hematocrit, hemoglobin, and erythrocyte counts, which were not affected in either rat strain in this study. Similar effects, albeit less severe, were observed in mice in the NTP studies, and also included decreases in MCV and MCH (NTP Citation2007, Citation2008). The small decreases in MCV and MCH in B6C3F1 mice were the only evidence of microcytosis observed in these immunotoxicity studies; this may have been due to the shorter exposure duration.
Percent values of NK cell differentials were significantly increased in F344/N rats exposed to the two highest doses of SDD (172 and 516 ppm), while absolute values of NK cells and splenic macrophages were significantly increased at 172 and 14.3 ppm, respectively. NK cell differentials were unaffected in SD rats, however, there were slight, but significant, increases in the percent values of macrophages at 14.3 and 172 ppm. Absolute and percent values of splenic macrophages were significantly increased in B6C3F1 mice at 31.3 and 125 ppm SDD, while NK cell differentials were unaffected. NK cell activity was evaluated in these immunotoxicity studies to assess innate immunity, and the observed lack of effect was consistent with reports from other studies. Yücesoy et al. (Citation1999) assessed the immunomodulatory effects of chromium, lead, nickel, and cadmium on NK cell activity in vitro and reported no effects on NK cell function. These data suggest species and strain-specific differences in the NK cell response, however the toxicological relevance of these results is unclear as it does not appear that the alterations in splenocyte differentials impacted functional immune capabilities.
Multiple assays were utilized to assess adaptive (e.g. humoral, cell-mediated) and innate immunity and, overall, the immune responses examined were generally unaffected by SDD exposure. Cell-mediated immunity, evaluated as anti-CD3 antibody-mediated proliferation, was unaffected by exposure to SDD in both rat strains and in mice. These data differ from those reported in in vitro studies of Cr, in which human peripheral blood T-lymphocytes exposed to cobalt-chromium-molybdenum (CoCrMo) had a decreased CD3-mediated proliferative response and murine lymphocytes exposed to cobalt-chromium particles had reduced proliferation of both T-cells and B-cells (Shrivastava et al. Citation2002); these differences could be due to the effects of the additional metals utilized those studies or due to the nature of in vitro vs. in vivo exposure.
Lawrence (Citation1981) evaluated the ability of numerous metals to alter the in vitro humoral immune response to SRBC. Lead (Pb2+) and nickel (Ni2+) significantly increased the antibody-forming cell (AFC) response in spleen cells, while mercury (Hg2+), copper (Cu2+), cadmium (Cd2+), and cobalt (Co2+) significantly reduced the response. Chromium (Cr3+), a different form than the Cr6+ assessed in these studies, exhibited slight inhibitory effects, however, these effects were inconsistent across the concentrations tested. In this oral exposure study, SDD enhanced the IgM antibody-forming cell (AFC) response to SRBC at all doses of SDD in both rat strains, however, the response only reached statistical significance in F344/N rats exposed to 57.3 ppm SDD and the response in SD rats was highly variable. A significant increase in the IgM AFC response to SRBC was noted in B6C3F1 mice exposed to 62.5 ppm SDD in Study 1, however, the toxicological significance of this result was questionable as this response did not repeat in Study 2. While the significance of the enhanced IgM AFC response is unclear, it is important to note that increases were observed in all three rodent models, and that responses tapered at the higher doses where effects on body weight and water consumption were noted. Glaser et al. (Citation1985) reported similar results in rats exposed to SDD via inhalation for 28 and 90 days.
Hypersensitivity is defined as: “excessive humoral or cellular immune responses to an otherwise innocuous antigen, which can lead to tissue damage” (Rooney et al. Citation2012). Hypersensitivity reactions are two-step processes, beginning with induction, or sensitization, and followed by elicitation. Sensitization involves initial induction of an immune response (i.e. antibody production or differentiation of lymphocytes) following antigen exposure, and elicitation of that immune response (i.e. inflamation) then occurs during additional exposures (Rooney et al. Citation2012). The relationship between stimulation of the immune response and sensitization is not well-understood, however, it is accepted that unintended stimulation of immune measures, including the AFC response, has the potential to be detrimental and can increase the risk for hypersensitivity and autoimmunity. The direct impact of that excess stimulation is unclear, however, the Food and Drug Adminstration (FDA) considers inadvertant stimulation of both immune responses and adjuvant activity to be potentially harmful, and acknowledges that such incidental stimulation could result in hypersensitivity, chronic inflammation, and/or autoimmunity (USFDA Citation1999).
It has been proposed that exposure to chemicals or toxicants can initiate hypersensitivity reactions and enhance the inflammatory response to other immune challenges; for example, exposure to air pollution may enhance sensitization to allergens (Gilmour et al. Citation2006; Steerenberg et al. Citation2005; IPCS Citation2012). Along with hypersensitivity, toxicant- or chemical-induced stimulation of the immune response can induce immunostimulation or immimmunosuppression; all of which have the potential to affect autoimmunity. It has been reported that hypersensitivity and autoimmunity are both related to metals exposure; in particular, occupational exposure to heavy metals has been linked to numerous autoimmune diseases (Rooney et al. Citation2012). Mercury, in particular, is well-known for its role in autoimmune disease and is an excellent example of the dichotomy of immunosuppression and immunostimulation.
The immunomodulatory effects of different metals have been extensively reviewed by Hultman and Pollard (Citation2015). While hypersensitivity and autoimmunity were not specifically evalauated in the studies reported here, hypersensitivity reactions are reported to be associated with exposure to Cr, Hg, Ni, Co, beryllium, and gold, while autoimune reactions are proposed to be associated more with mercury, lead, and cadmium (Hultman and Pollard Citation2015). Similarly, Leffel et al. (Citation2003) reported exacerbation of autoimmune disease in mice following exposure to cadmium in drinking water and Koller (1980) reported significant immunosuppressive effects following exposure to Pb and Hg, including reduction of the host response to bacterial and viral infections and alterations in antibody synthesis. Chromium was also reported to have immunosuppressive effects, however, not to the same extent as some of the other metals (Koller Citation1980). The results of the present studies are not in agreement with previous reports that oral exposure to Cr(VI) can induce immunomodulatory effects in rats, including alterations in the proliferative response of splenoctye to mitogens and allogenic spleen cells (Snyder and Valle Citation1991). The current study observed either a lack of effect or inconsistent effects for all immunological parameters evaluated, including T-cell proliferation and the mixed leukocyte response in mice; some of these inconsistencies may be due to differences in response between rodent species.
Conclusions
Cr(VI), when administered in the drinking water as SDD for 28 days, produced minimal toxicological and immunotoxic effects in female F344/N rats, SD rats, and B6C3F1 mice. These results suggest that human exposure to the EPA MCL of Cr(VI) in drinking water, 0.1 ppm for total Cr, is not likely to induce immunomodulatory or immunotoxic effects.
Acknowledgements
The authors would also like to express their appreciation to Ms. Deborah Musgrove and Mrs. Ronnetta Brown for their technical assistance.
Disclosure statement
The authors declare no conflicts of interest. The authors alone are responsible for the content of this manuscript.
Additional information
Funding
References
- Agency for Toxic Substances and Disease Registry(ATSDR). 2012. Toxicological Profile for Chromium. U.S. Department of Health and Human Services, Public Health Service. September, 2012. [Accessed 2016 Sep 7]. www.atsdr.cdc.gov/toxprofiles/tp7.pdf.
- Bartlett M. 1937. Sub-sampling for attributes. J Royal Stat Soc. 4:131.
- Bruynzeel D, Hennipman G, van. Ketel WG. 1988. Irritant contact dermatitis and chrome-passivated metal. Contact Dermatitis 19:175–179.
- California Department of Public Health (CDPH). 2014. Memorandum: State Adoption of a Hexavalent Chromium MCL. Sacramento, CA; [Accessed 2017 Jan 10]. http://www.waterboards.ca.gov/drinking_water/certlic/drinkingwater/documents/chromium6/LettertoPWS-StateAdoptionofaHexavalentChromiumMCL-20140620.pdf.
- Cohen M, Zelikoff J, Chen L, Schlesinger R. 1998. Immunotoxicologic effects of inhaled chromium: Role of particle solubility and co-exposure to ozone. Toxicol Appl Pharmacol. 152:30–40.
- Collins B, Stout M, Levine K, Kissling G, Melnick R, Fennell T, Walden R, Abdo K, Pritchard J, Fernando R. 2010. Exposure to hexavalent chromium resulted in significantly higher tissue chromium burden compared with trivalent chromium following similar oral doses to male F344/N rats and female B6C3F1 mice. Toxicol Sci. 118:368–379.
- Costa M. 1997. Toxicity and carcinogenicity of Cr(VI) in animal models and humans. Crit Rev Toxicol. 27:431–442.
- Dunnett C. 1955. A multiple comparison procedure for comparing several treatments with a control. J Am Stat Assoc. 50:1096–1121.
- Environmental Working Group(EWG). 2016; [Accessed 2017 Jan 10]. http://www.ewg.org/research/chromium-six-found-in-us-tap-water.
- Gehan-Wilcoxon Test. 1975. In: Gross A, and Clark V, editors. Survival distributions: Reliability applications in the biomedical sciences. New York (NY): John Wiley and Sons; p. 225–256.
- Gilmour M, Jaakkola M, London S, Nel A, Rogers C. 2006. How exposure to environmental tobacco smoke, outdoor air pollutants, and increased pollen burdens influences the incidence of asthma. Environ Health Perspect. 114:627–633.
- Glaser U, Hochrainer D, Klöppel H, Kuhnen H. 1985. Low level chromium (VI) inhalation effects on alveolar macrophages and immune functions in Wistar rats. Arch Toxicol. 57:250–256.
- Guo T, McCay J, Brown R, Musgrove D, Butterworth L, Munson A, Germolec D, White K. 2000. Glycidol modulation of the immune responses in female B6C3F1 mice. Drug Chem Toxicol. 23:433–457.
- Guo T, McCay J, Zhang L, Brown R, You L, Karrow N, Germolec D, White K 2001. Genistein modulates immune responses and increases host resistance to B16F10 tumor in adult female B6C3F1 mice. J Nutr. 131:3251–3258.
- Hansen M, Johansen J, Mennè T. 2003. Chromium allergy: Significance of both Cr(III) and Cr(VI). Contact Dermatitis 49:206–212.
- Hollander M, Wolfe D, editors. 1973. Jonckheere’s test. In: Non-parametric statistical methods. New York (NY): John Wiley and Sons; p. 120–123.
- Holsapple M, Munson A, Munson J, Bick P. 1983. Suppression of cell-mediated immunocompe-tence after subchronic exposure to diethylstilbestrol in female B6C3F1 mice. J Pharmacol Exp Ther. 227:130–138.
- Hultman P, Pollard K. 2015. Immunotoxicology of metals. In: Nordberg G, Fowler B, Nordberg M, editors. Handbook on the toxicology of metals. Oxford (UK): Elsevier; p. 379–398.
- International Agency for Research on Cancer (IARC). 1980. Chromium and chromium compounds. In: IARC monographs on the evaluation of the carcinogenic risk of chemicals to humans, vol. 23: Some metals and metallic compounds. Lyon (France): IARC; p. 205–323.
- International Programme on Chemical Safety (IPCS). 2012. Guidance for immunotoxicity risk assessment for chemicals: Assessment of immunostimulation. Geneva: World Health Organization; Harmonization Project Document No. 10. [Accessed 2017 Mar 1]. http://www.inchem.org/documents/harmproj/harmproj/harmproj10.pdf.
- Jerne N, Nordin A. 1963. Plaque formation in agar by single antibody-producing cells. Science 140:405.
- Kawabata T, Babcock L, Gauggel D, Asquith T, Fletcher E, Horn P, Ratajczak H, Graziano FM. 1995. Optimization and validation of an ELISA to measure specific guinea pig IgG1 antibody as an alternative to the in vivo passive cutaneous anaphylaxis assay. Fundam Appl Toxicol. 24:238–246.
- Kiessling R, Klein E, Wigzell H. 1975. Natural killer cells in the mouse. I. Cytotoxic cells with specificity for mouse Moloney leukemia cells: Specificity and distribution according to genotype. Eur J Immunol. 5:112–117.
- Kimura T. 2007. Contact hypersensitivity to stainless steel cages (chromium metal) in hairless descendants of mexican hairless dogs. Environ Toxicol. 22:176–184.
- Koller L. 1980. Immunotoxicology of heavy metals. Int J Immunopharmacol. 2:269–279.
- Kruskal W, Wallis W. 1952. Use of ranks in one-criterion variance analysis. J Am Stat Assoc. 47:583–621.
- Lawrence D. 1981. Heavy metal modulation of lymphocyte activities: I. In vitro effects of heavy metals on primary humoral immune responses. Toxicol Appl Pharmacol. 57:439–451.
- Leffel E, Wolf C, Poklis A, White K. 2003. Drinking water exposure to cadmium, an environmental contaminant, results in the exacerbation of autoimmune disease in the murine model. Toxicology 188:233–250.
- Luster M, Munson A, Thomas P, Holsapple M, Fenters J, White K, Lauer L, Germolec D, Rosenthal G, Dean J. 1988. Development of a testing battery to assess chemical-induced immunotoxicity: National Toxicology Program’s guidelines for immunotoxicity evaluation in mice. Fundam Appl Toxicol. 10:2–19.
- MacKenzie R, Byerrum R, Decker C, Hoppert C, Langham R. 1958. Chronic toxicity studies. II: Hexavalent chromium and trivalent chromium administered in drinking water to rats. Am Med Assoc Arch Ind Health. 18:232–234.
- North Carolina Department of Environment and Natural Resources (NC DENR). 2015. Health Risk Explanation Fact Sheet. [Accessed 2017 Mar 22]. https://ncdenr.s3.-amazonaws.com/s3fs-public/document-library/07.28.15_Risk%20explanation%20FAQ.pdf.
- North Carolina Department of Environmental Quality (NC DEQ). 2015. Most Results from Drinking well Tests Show Exceedances of State Groundwater Standards Near Coal Ash Ponds. [Accessed 2017 Feb 27]. http://portal.ncdenr.org/c/journal/view_article_content? groupId =4711509&articleId =24861488.
- National Toxicology Program (NTP). 2007. NTP Technical Report on the Toxicity Studies of Sodium Dichromate Dihydrate (CAS No. 7789-12-0) Administered in Drinking Water to Male and Female F344/N rats and B6C3F1 mice and Male BALB/c and am3-C57BL/6 mice. January, 2007 [Accessed 2016 Dec 7]. http://ntp.niehs.nih.gov/ntp/htdocs/st_rpts/tox072.pdf.
- National Toxicology Program (NTP). 2008. NTP Technical Report on the Toxicology and Carcinogenesis Studies of Sodium Dichromate Dihydrate (CAS No. 7789-12-0) in F344/N rats and B6C3F1 mice (Drinking Water Studies). July, 2008 [Accessed 2016 Dec 7]. https://ntp.niehs.nih.gov/ntp/htdocs/lt_rpts/tr546.pdf.
- National Toxicology Program (NTP). 2016. Report on Carcinogens, 14th Edition. Research Triangle Park, NC; [Accessed 2017 Mar 22]. http://ntp.niehs.nih.gov/go/roc.
- Proctor D, Otani J, Finley B, Paustenbach D, Bland J, Speizer N, Sargent E. 2002. Is hexavalent chromium carcinogenic via ingestion? A weight-of-evidence review. J Toxicol Environ Health 65:701–746.
- Reynolds C, Herberman R. 1981. In vitro augmentation of rat natural killer (NK) cell activity. J Immunol. 126:1581–1585.
- Rooney A, Luebke R, Selgrade M, Germolec D. 2012. Immunotoxicology and its application to risk assessment. In: Luch A, editor. Molecular, clinical and environmental toxicology, vol. 3. New York (NY): Springer International Publishing; p. 251–282.
- Sedman R, Beaumont J, McDonald T, Reynolds S, Krowech G, Howd R. 2006. Review of the evidence regarding carcinogenicity of hexavalent chromium in drinking water. J Environ Sci Health C. 24:155–182.
- Shrivastava R, Upreti R, Seth P, Chaturvedi U. 2002. Effects of chromium on the immune system. FEMS Immunol Med Microbiol. 34:1–7.
- Snyder C, Valle C. 1991. Immune function assays as indicators of chromate exposure. Environ Health Perspect. 92:83–86.
- Sokal R, Rohlf E., editors. 1981. In: Biometry. San Francisco (CA): Freeman; p. 222–229.
- Steerenberg PA, Withagen CET, van Dalen WJ, Dorma JAMA, Heisterkamp SH, van Loveren H, Cassee FR. 2005. Dose dependency of adjuvant activity of particulate matter from five European sites in three seasons in an ovalbumin-mouse model. Inhal Toxicol. 17:133–145.
- Stout M, Herbert R, Kissling G, Collins B, Travlos G, Witt K, Melnick R, Abdo K, Malarkey D, Hooth M. 2009. Hexavalent chromium is carcinogenic to F344/N rats and B6C3F1 mice after chronic oral exposure. Environ Health Perspect. 117:716–722.
- Temple L, Kawabata T, Munson A, White K. 1993. Comparison of ELISA and plaque-forming cell assays for measuring the humoral immune response to SRBC in rats and mice treated with benzo[a]pyrene or cyclophosphamide. Fundam Appl Toxicol. 21:412–419.
- Thompson C, Proctor D, Suh M, Haws L, Hébert C, Mann J, Shertzer H, Hixon J, Harris M. 2012. Comparison of the effects of hexavalent chromium in the alimentary canal of F344 rats and B6C3F1 mice following exposure in drinking water: Implications for carcinogenic modes of action. Toxicol Sci. 125:79–90.
- Thompson C, Proctor D, Suh M, Haws L, Kirman C, Harris M. 2013. Assessment of the mode of action underlying development of rodent small intestinal tumors following oral exposure to hexavalent chromium and relevance to humans. Crit Rev Toxicol. 43:244–274.
- United States Environmental Protection Agency (USEPA). 1998. Toxicological Review of Hexavalent Chromium. In support of the Integrated Risk Information System, Office of Research and Development, Washington, DC [Accessed 2016 Sep 9]. http://www.epa.gov/iris/toxreviews/0144tr.pdf.
- United States Environmental Protection Agency (USEPA). 2010. Toxicological Review of Hexavalent Chromium. In support of the Integrated Risk Information System, Office of Research and Development, Washington, DC; [Accessed 2016 Sep 9]. https://cfpub.epa.gov/ncea/iris_drafts/recordisplay.cfm?deid =221433.
- United States Food and Drug Administration (USFDA). 1999. Guidance for industry: Immunotoxicity testing guidance. Report. Rockville (MD): Center for Devices and Radiological Health.
- Vengosh A, Coyte R, Karr J, Harkness J, Kondash A, Ruhl L, Merola R, Dywer G. 2016. Origin of hexavalent chromium in drinking water wells from the Piedmont aquifers of North Carolina. Environ Sci Technol Lett. 3:409–414.
- White K, Musgrove D, Brown R. 2010. The sheep erythrocyte T-dependent antibody response (TDAR). Methods Mol Biol. 598:173–184.
- Wilson K. 1956. A distribution-free test of analysis of variance hypotheses. Psychol Bull. 53:96–101.
- Witt K, Stout M, Herbert R, Travlos G, Kissling G, Collins B, Hooth M. 2013. Mechanistic insights from the NTP studies of chromium. Toxicol Pathol. 41:326–342.
- Xie Y, Holmgren S, Andrews D, Wolfe M. 2017. Evaluating the impact of the U.S. National Toxicology Program: A case study on hexavalent chromium. Environ Health Perspect. 125:181–188.
- Yücesoy B, Mirshahidi S, Yücesoy C, Karakaya A. 1999. In vitro effects of various metal on natural killer cell activity in cultured human lymphocytes. Immunopharmacol Immunotoxicol. 21:599–607.