
Abstract
Vanadium is an air pollutant that imparts immunosuppressive effects on NK cell immune responses, in part, by dysregulating interleukin (IL)-2/IL-2R-mediated JAK signaling pathways and inducing apoptosis. The aim of the present study was to evaluate effects of vanadium pentoxide (V2O5) on other IL-2 receptor-mediated signaling pathways, i.e. PI3K-AKT-mTOR and Ras-MAPK. Here, IL-2-independent NK-92MI cells were exposed to different V2O5 doses for 24 h periods. Expression of PI3K, Akt, mTOR, ERK1/2, MEK1, PTEN, SHP1, BAD and phosphorylated forms, as well as caspases-3, -8, -9, BAX and BAK in/on the cells were then determined by flow cytometry. The results show that V2O5 was cytotoxic to NK cells in a dose-related manner. Exposure increased BAD and pBAD expression and decreased that of BAK and BAX, but cell death was not related to caspase activation. At 400 µM V2O5, expression of PI3K-p85 regulatory subunit increased 20% and pPI3K 50%, while that of the non-pPI3K 110α catalytic subunit decreased by 20%. At 200 μM, V2O5 showed significant decrease in non-pAkt expression (p < 0.05); the decrease in pAkt expression was significant at 100 μM. Non-pmTOR expression displayed a significant downward trend beginning at 100 μM. Expressions of pMEK-1/2 and pERK-1/2 increased substantially at 200 μM V2O5. No differences were found with non-phosphorylated ERK-1/2. PTEN expression increased significantly at 100 μM V2O5 exposure whereas pPTEN decreased by 18% at 25 μM V2O5 concentrations, but remained unchanged thereafter. Lastly, V2O5 at all doses decreased SHP1 expression and increased expression of its phosphorylated form. These results indicated a toxic effect of V2O5 on NK cells that was due in part to dysregulation of signaling pathways mediated by IL-2 via increased PTEN and decreased SHP1 expression. These results can help to explain some of the known deleterious effects of this particular form of vanadium on innate immune responses.
Introduction
A predominant source of vanadium (V), an important pollutant in the air of major cities (Fortoul et al. Citation2002), is the increased combustion of fuel products that have high V content (Ivancsits et al. Citation2002; Shafer et al. Citation2012). Inhaled V can enter the systemic circulation of an organism, subsequently exerting toxicities in other organs and tissues (Fortoul et al. Citation2002; Nemmar et al. Citation2004). The toxic effects of V are related to the chemical nature of the V agent itself (i.e. oxidation state, free or complexed forms, etc.) (Korbecki et al. Citation2012). Inhalation of vanadium pentoxide (V2O5) by mice affects the histology and function of the majority of tissues and organs including the spleen (Pinon-Zarate et al. Citation2008; Colin-Barenque et al. Citation2015). The general outcome from exposure to V agents is a suppression of the host´s adaptive and innate immune response (Fortoul van der Goes et al. Citation2014).
The main cell types in the innate immune system are natural killer (NK) cells, macrophages, neutrophils, dendritic cells, eosinophils and basophils (Rivera et al. Citation2016). Mice and humans exposed to pollutants derived from burning coal or diesel exhaust particles show a diminished NK cell function (Hurd and Whalen Citation2011; Dutta et al. Citation2012; Wortham et al. Citation2012; Muller et al. Citation2013). Interleukin (IL)-2, a cytokine required for NK cell proliferation and activation (Suzuki et al. Citation1983; Bi et al. Citation2014; Leon et al. Citation2014) has its effects mediated through IL-2 receptors and subsequently janus kinase/signal transducers and activators of transcription (JAK/STAT), phosphoinositide 3-kinase-protein kinase B-mechanistic target of Rapamycin (PI3K-Akt-mTOR) and mitogen-activated protein kinase (MAPK) signaling pathways (Lu et al. Citation1998; Liao et al. Citation2013). Impairment of the IL-2/IL-2 receptor signaling pathway suppresses immune cell proliferation and other functions (Wu et al. Citation2009). V2O5 is an inorganic V oxide that deregulates JAK signaling pathways mediated by IL-2, prevents cell proliferation through sustained JAK3 phosphorylation, and induces apoptosis in NK cells (Gallardo-Vera et al. Citation2016).
The aim of the study here was to determine potential effects of V2O5 (as vanadium oxide model) on other IL-2 receptor-mediated signaling pathways, specifically PI3K-Akt-mTOR and rat sarcoma (Ras)-MAPK in NK cells. Using an IL-2-independent human NK-92MI cell line phenotypically considered an NKbright cell, the studies showed that V2O5 modified both pathways, in part, via enhancement of phosphatase and tensin homolog (PTEN) and decreases in Src homology region 2 domain-containing phosphatase-1 (SHP1) expression in these cells.
Material and methods
Cell line and culture
The IL-2-independent human NK cell line NK-92MI (#CLR-2408) was obtained from American Type Culture Collection (ATCC; Manassas, VA, USA). This stable line, transfected with human IL-2 cDNA, was cultured in α-minimum essential medium without ribonucleosides and deoxyribonucleosides, but supplemented with 12.5% heat-inactivated fetal bovine serum (FBS), 12.5% horse serum, 100 IU penicillin/ml, 100 IU streptomycin/ml, 2 mM L-glutamine, 0.2 mM inositol, 20 mM folic acid, and 100 µM 2-mercaptoethanol. All culture media and supplements, as well as all reagents, were purchased from Gibco (Life Technologies, Grand Island, NY, USA) and Sigma (St. Louis, MO, USA). Cells were grown to confluence in 25-cm2 polystyrene tissue culture flasks (Corning Costar, Cambridge, MA, USA) at 37 °C in a humidified atmosphere containing 5% CO2. Cell aliquots were frozen in in 10% dimethyl sulfoxide and kept in liquid nitrogen until use. Freshly thawed cells with a 95% cell viability determined by trypan blue assay were used for all the experiments.
A 10 mM stock solution of V2O5 (Sigma; 99.99%) in phosphate-buffered saline (PBS, pH 7.4) was prepared. This stock solution was then used to generate all final concentrations (in μM) of the agent used in the experiments.
Flow cytometry
Cell viability was evaluated according to the methodology described in Gallardo-Vera et al. (Citation2016). Following V2O5 exposure, cells were fixed and then permeabilized with, respectively, Fix Buffer I and Perm Buffer III (BD Phosflow, San Jose, CA, USA), according to manufacturer instructions. Cells were then suspended in FACS buffer [PBS containing 0.09% (w/v) sodium azide, supplemented with 1% FBS] and incubated at 4 °C overnight with primary antibodies at the indicated dilutions (previously determined as optimal by titration). For the labeling, the following rabbit anti-human antibodies were purchased from Cell Signaling Technology (Beverly, MA, USA): anti-PI3Kp85 (1:200), anti-p-PI3Kp85 (Tyr458)/p55 (Tyr199) (1:100), anti-p-ERK1/2 (extracellular signal-regulated kinases, 1:200), anti-caspase-9 (1:100), (monoclonal) anti-PI3K p110α (1:200), anti-p-PTEN (Ser380/Thr382/383) (1:100), anti-p-SHP1 (Tyr564) (1:100), anti-cleaved caspase-8 (Asp391) (1:100), as well as Alexa Fluor (AF) 488-labeled anti-AKT (1:800), anti-mTOR (1:800) and anti-p-ERK1/2 (Thr202/Tyr204) (1:50), AF 647-anti-p-AKT (Ser473) (1:200), phycoerythrin (PE)-labeled anti-p-Bad (Ser112) (1:50), and Pacific blue-labeled anti-cleaved caspase-3 (Asp175) (1:100).
Mouse monoclonal anti-human SHP1 (1:100), AF 647-anti-p-MEK1/2 (Mitogen-activated protein kinase kinase, Ser218/222) (1:50), PE-anti-p-mTOR (Ser2448) (1:400), anti-PTEN (1:400), and anti-MEK-1 (1:50) were all obtained from BD PhosFlow. Rabbit anti-human Bax (Bcl-2-associated X protein, 1:100) and rabbit monoclonal DyLight AF 488-anti-human BAD (Bcl-2-associated death promoter, 1:800) were bought from Abcam (San Francisco, CA, USA). Mouse monoclonal AF 488-anti-human BAK (Bcl-2 homologous antagonist/killer, NBP1–74026AF488, 1:400) was purchased from Novus Biologicals, LLC (Littleton, CO, USA). As secondary antibodies, Cy5-conjugated goat anti-rabbit IgG (H + L, 1:800) and/or AF-488-labeled goat anti-mouse IgG (H + L, 1:400) were used (ThermoFisher Scientific Inc., Waltham, MA, USA).
After incubation, cells were washed twice in FACS buffer by gentle centrifugation (5 min, 250g) and incubated (when necessary) with the specified secondary antibody for 1 h. Some experiments were performed labeling the cells with one antibody (single cell assays) while others used two different antibodies; results of the latter were represented as zebra plots. Flow cytometry was then performed using an Attune Acoustic Focusing Cytometer-Blue/Red and Cytometer Violet/Red System (Applied Biosystems, Thermo Fisher Scientific). After staining, gating of cells was performed on the basis of forward- and side-scatter properties, followed by gating on FSC-A × FSC-H (single cell). All experiments included a proper antibody isotype control. For each sample, a minimum of 20,000 live cells was acquired. All data obtained were analyzed using FlowJo (v. X.0.7, Tree Star Inc., Ashland, OR). Data was evaluated in terms of mean fluorescence intensity (MFI) values or in terms of percentage of positive cells.
Confocal microscopy
Sorted cells (in 100 μl PBS) were stained with DAPI (4′,6-diamidino-2-phenylindole) for 30 min at room temperature. The cells were then centrifuged (5 min, 700 rpm) onto a slide in a Hettich-Cyto-System (Hettich GmbH, Tuttlingen, Germany) and cover-slipped in fluorescence-mounting medium (DAKO, Glostrup, Denmark). Cell were then analyzed under a CFI60 100X SR/TIRF Plan Apochromatic oil-immersion objective in a A1R+ confocal system (Nikon, Tokyo, Japan) and acquired at Nyquist resolution (0.18 μm in XY axis) using excitation wavelengths of 405 and 568 nm. Confocal images were processed with ImageJ v1.51e using Bio-Formats plugin (v. 5.1.10, NIH, Rockville, Maryland, USA; Open Microscopy Environment consortium), and figures were made with GNU Image Manipulation Program v.2.8.18 (GIMP, Team, www.gimp.org, USA).
Statistical analysis
A multiple t-test was used to compare the effects of V2O5 on expression of total and phosphorylated kinases, phosphatases, and cell death markers evaluated by flow cytometry. To define the statistical significance of the results, a Holm–Sidak method was used to correct for multiple comparison tests. All data obtained by flow cytometry were analyzed using FlowJo (v. X.0.7, Tree Star Inc.). A p values <0.05 was considered significant. To compare the effect of treatment simultaneously on both intracellular expression of total and phosphorylated proteins, percentage differences in MFI was calculated. For this, MFI from control-treated NK-92MI cells was taken as the baseline expression and percentage differences then calculated as: 100 × (value of each dose – baseline)/baseline. All graphs and analyzes were performed using in Prism 7.0 (GraphPad Software Inc., La Jolla, CA, USA).
Results
Effect of V2O5 on NK-92MI cell size, granularity and viability
Earlier experiments with cells exposed to V2O5 for 24-h showed that the percentage of viable cells decreased in a dose-related manner (versus control) to 78.7, 74.9, 63.1, 51.0, and 34.9% (Gallardo-Vera et al. Citation2016) (Supplementary Figure S1; adapted from paper). Similarly, exposure to increasing concentrations of V2O5 decreased the size and increased granularity of the NK-92MI cells. In this case, V2O5 decreased cell size and increased granularity in 14% of the cells at 25 µM and decreased both parameters to 93% of control levels at 400 µM. These types of changes are characteristic of induction of apoptotic processes in cells.
Effect of V2O5 on PI3K/AKT/mTOR
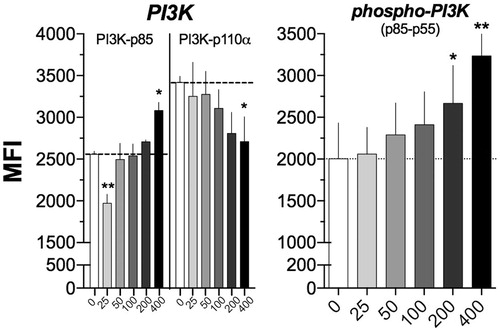
After exposing NK92-MI cells for 24 h to different (25–400 µM) concentrations of V2O5, a contrasting dose-dependent effect on expression of non-phosphorylated catalytic and regulatory subunits of PI3K was observed (). In particular, compared to basal expression (0 µM; control), the MFI for the non-phosphorylated PIK3-p85 regulatory subunit decreased 23% at 25 µM V2O5, but its expression increased 20% at 400 µM V2O5. Expression of phosphorylated PI3K p85–55 subunit increased by 10% at 50 µM V2O5 and reached a 50% increment at 400 µM V2O5. Interestingly, expression of non-phosphorylated PI3K 110α catalytic subunit showed a continuous dose-dependent decrease that reached a maximal 20% at 400 μM V2O5.
Figure 1. Effect of V2O5 on PI3K subunits. Histogram depicting the results obtained with NK92-MI cells exposed to different V2O5 concentrations (25–400 µM) of V2O5 during 24 h upon PI3K regulatory p85 and catalytic p110α subunits and phospho-PI3K p85–p55. The results show the single labeling cell assays. The dashed line shows the basal MFI at 0 μM. *p < 0.05, **p < 0.01, ***p < 0.001 versus 0 μM of V2O5.
V2O5 also disturbed expression of the phosphorylated and non-phosphorylated forms of Akt (). The effect was characterized by a sustained reduction in expression of non-phosphorylated Akt in cells exposed to V2O5; the decrease was significant with 200 and 400 μM V2O5 (p < 0.05). Similarly, there was a decrease in expression of phosphorylated AKT that began at 25 μM and reached significance at 200 and 400 μM V2O5.
Figure 2. Effect of V2O5 on AKT/mTOR. Histogram depicting the effect of vanadium pentoxide on the activation of AKT/mTOR by flow cytometry in NK92-MI cells exposed to different concentrations (25–400 µM) of V2O5 during 24 h. (A) AKT and phospho-AKT. (B) mTOR and phosphorus-mTOR. Results are expressed as MFI from the single-labeling cell assays. The dashed line shows the basal MFI at 0 μM (basal). *p < 0.05, **p < 0.01, ***p < 0.001 versus control (basal).
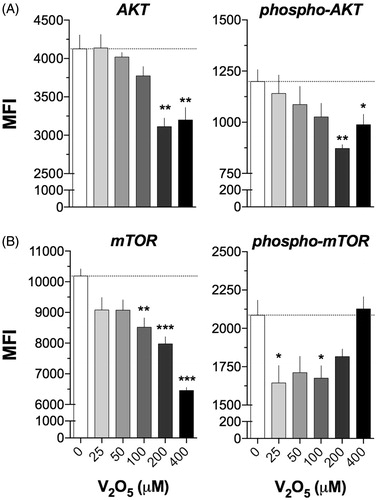
In relation to mTOR, expression of the non-phosphorylated form maintained a significant downward trend that began at 25 μM V2O5 and reached significance at ≥ 100 μM V2O5 (p < 0.01). The reduction was more evident in the higher V2O5 doses, where the percentage of reduction reached 36.7% (versus control; ). With expression of phosphorylated mTOR, levels started to decrease at 25 μM V2O5 and remained as such at 200 V2O5; the low values seen at 50 and 200 μM V2O5 did not reach significance once the values were adjusted. Interestingly, at 400 μM V2O5, expression of phosphorylated mTOR returned to basal levels.
Eighty-three percent of non-V2O5-treated NK-92MI cells expressed Akt and p-Akt. However, after exposure to V2O5, the percentage of double positive (DP) cells decreased, and at 400 µM the percentage of DP cells decreased to 28% in relation to control cell values (). Nevertheless, a small proportion of cells remained phosphorylated despite the high V2O5 concentration. Unexpectedly, mTOR expression followed a different pattern. In non-stimulated conditions, 57% of cells expressed mTOR and its phosphorylated form, but contrary to the AKT results, there was an important percentage of cells that only expressed mTOR. At higher V2O5 levels, the percentage mTOR+ cells diminished without a concomitant effect on levels of DP cells (). The latter outcome was similar to that seen in the cells when only mTOR was evaluated ().
Figure 3. Effect of V2O5 on protein kinases and phosphorylation states. NK-92MI cells were treated with 0–400 V2O5 for 24 h. Double staining with antibodies to the following molecules was performed: (A) AKT versus pAKT-Ser473 [lower left quadrant represents negative cells for both parameters (AKT-/AKT-Ser473-), upper left quadrant represents AKT+, upper right quadrant represents positive cells for both parameters (AKT+/AKT-Ser473+), lower right quadrant represents positive cells only for (AKT-Ser473+)], zebra plots come from previous regions which are shown in the upper right of this figure and using the same analysis strategy for (B) mTOR versus mTOR (Ser2448). Data in each quadrant are presented in percentages and defined according to isotype controls for each antibody used. Right-side dot-plots represent example of analysis strategy used to generate zebra plots in A and B. Results exemplify one of three independent experiments performed with each V2O5 concentrations.
![Figure 3. Effect of V2O5 on protein kinases and phosphorylation states. NK-92MI cells were treated with 0–400 V2O5 for 24 h. Double staining with antibodies to the following molecules was performed: (A) AKT versus pAKT-Ser473 [lower left quadrant represents negative cells for both parameters (AKT-/AKT-Ser473-), upper left quadrant represents AKT+, upper right quadrant represents positive cells for both parameters (AKT+/AKT-Ser473+), lower right quadrant represents positive cells only for (AKT-Ser473+)], zebra plots come from previous regions which are shown in the upper right of this figure and using the same analysis strategy for (B) mTOR versus mTOR (Ser2448). Data in each quadrant are presented in percentages and defined according to isotype controls for each antibody used. Right-side dot-plots represent example of analysis strategy used to generate zebra plots in A and B. Results exemplify one of three independent experiments performed with each V2O5 concentrations.](/cms/asset/15e01a36-2650-419e-b2c6-d366e7e30eb0/iimt_a_1404662_f0003_b.jpg)
Effect of V2O5 on the MAPK
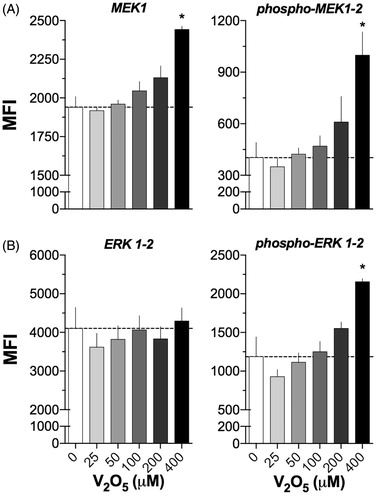
Exposure to V2O5 also affected key molecules of MAPK signaling pathways. The expression of phosphorylated forms of MEK-1/2 and ERK-1/2 increased substantially at 200 μM V2O5. It was interesting that the MFI value at 400 μM V2O5 was three-fold higher than on control non-stimulated cells, whereas the MFI values of ERK-1/2 increased only one-fold at the same level (; p < 0.05). No significant differences due to V exposures were found in regard to values of expression of non-phosphorylated forms of ERK-1/2 ().
Figure 4. Activation of MEK and ERK1/2 in V2O5-treated (24 h) NK-92MI cells. Flow cytometry was performed on cells exposed to 0–400 µM V2O5. (A) MEK1 and p-MEK-1/2. (B) ERK-1/2 and p-p44/42 MAPK (ERK1/2). Results are expressed as MFI. Dashed line shows basal MFI (0 μM). Results are for single labeling cell assays. *p < 0.05 versus control (basal).
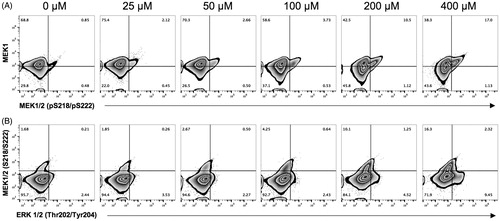
In the NK-92MI cells, 69% in the basal state expressed MEK1. After exposure to V2O5, the DP cell percentage increased slightly (to 17% above control at highest dose). In addition, the levels of cells that became double negative (DN) for MEK1 and pMEK1/2 increased to 43% (basal state level =30%). It seemed two different cell populations begin to appear, i.e. one that maintained expression of MEK1, and another that became negative (). In relation to phosphorylated forms of MEK1/2 and ERK1/2, the percentage of cells that remained DN under basal conditions and in those exposed to high V2O5 levels remained practically unchanged (95 versus 72%, respectively; p < 0.05), though there was a small increase in levels of pMEK1/2+ cells due to exposure ().
Figure 5. Protein kinases/phosphorylation states in V2O5-treated (24 h) NK-92MI cells. Flow cytometry was performed on cells exposed to 0–400 µM V2O5. Double staining with antibodies to the following was performed: (A) MEK-1 versus ERK-1/2 (Thr202/Tyr204) and (B) MEK1/2 (Ser218/Ser222) versus ERK- 1/2 (Thr202/Tyr204). Data in each zebra plot quadrant are presented as percentages and defined according to isotype controls for each antibody used. Results exemplify one of three independent experiments performed with each V2O5 level.
Effect of V2O5 on PTEN and SHP1 phosphatase expression
PTEN expression increased significantly with 100 μM V2O5 (p < 0.05); in comparison, p-PTEN MFI values decreased by 18% with 25 μM V2O5 but remained unchanged at the remaining levels (). SHP1 expression began to be significantly reduced at V2O5 concentrations of 100 μM (p < 0.05) and reached a p < 0.01 values at 400 μM. Both 200 and 400 μM V2O5 increased the expression of phospho-SHP1 in relation to the control value ().
Figure 6. PTEN, SHP1 and phosphorylated forms expression in V2O5-treated (24 h) NK-92MI cells. Flow cytometry was performed on cells exposed to 0–400 µM V2O5. A and B: results of single labeling cell assays. C and D: PTEN and SHP1 and phosphorylated forms on cells. Data in each zebra plot quadrant are presented as percentages and quadrants were defined according to isotype controls for each antibody used. Results exemplify one of three independent experiments performed with each V2O5 level. Dashed line represents basal MFI (0 μM). *p < 0.05, **p < 0.01 versus control (basal).
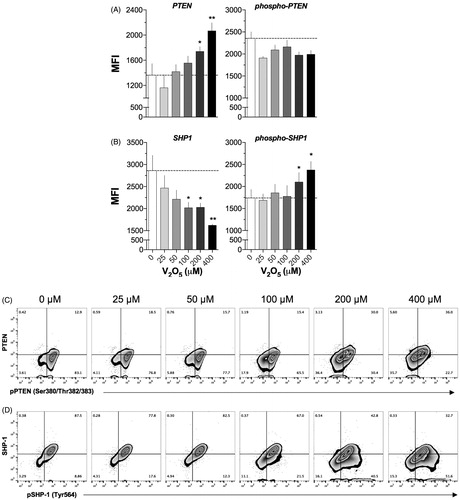
The zebra plots shown in illustrate how V2O5 induced a significant decrease in percentages of pPTEN+ cells (23 versus 83% in controls). It was clear two populations emerged due to treatment, i.e. a DP (36 versus 13% in control) and a DN (36 versus 3% in control) (). For SHP1, the results showed the percentage of SHP-1/pSHP-1 DP cells decreased to 88 from 33% at baseline. A general trend noted was that the amount of pSHP-1+ cells increased significantly (9 versus 51%, p < 0.05) ().
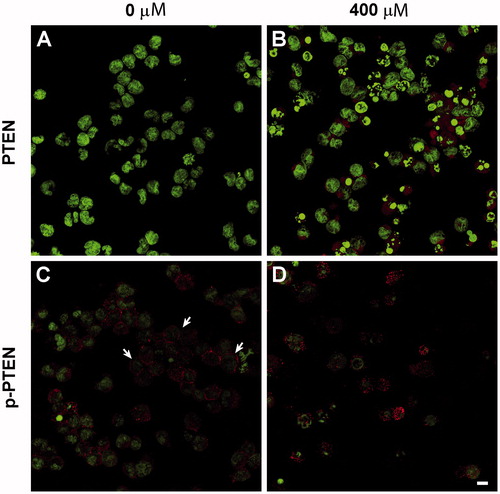
PTEN is normally located in the cytoplasm but it also exerts regulatory functions in the cell nucleus (Whiteman et al. Citation2002). Confocal images corroborated the cytofluorometry results. It was seen here that 400 μM V2O5 enhanced expression of PTEN in the cell cytoplasm in comparison with in non-treated NK cells. Meanwhile, membrane expression of the phosphorylated form of PTEN decreased and it was located mainly at the cytoplasm at the same V2O5 concentration ().
Figure 7. PTEN and phosphorylated PTEN expression in NK cells treated with V2O5 for 24 h. Confocal microscopy images of cells sorted by cytometer. (A, C) Non-stimulated cells. (B, D) Cells treated with 400 µM V2O5. Nucleic acid staining with DAPI (green). Arrows in C indicate membrane location of pPTEN, which is lost in cells exposed to V2O5. Magnification = 60×.
Effect of V2O5 on expression of pro-apoptotic molecules
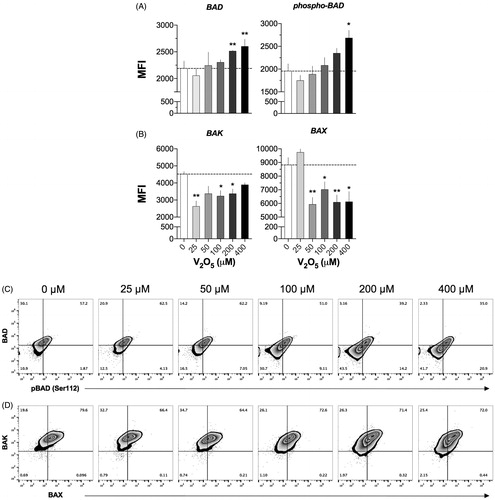
Exposure to 200 or 400 μM V2O5, respectively, caused a significant (p < 0.01) increase in MFI values for Bad and p-Bad expression (), though both increases were already evident with 100 μM V2O5. In contrast, Bak and Bax expression showed significant decreases that were evident at 25 and 50 μM V2O5, respectively; the decreases persisted with all V2O5 doses evaluated (). The zebra plots () showed that V2O5 induced a significant decrease in percentages of Bad/pBad DP cells in comparison to levels noted with control cells (35 versus 57%, respectively). It is worth noting that at the same time, V2O5 induced an increase in Bad/pBad DN cells (11% in non-treated cells versus 41% in 400 μM V2O5-treated cells) (). For Bak and Bax, the results showed the percentage of DP cells remained unaffected even at high V2O5 levels ().
Figure 8. Pro-apoptotic molecule expression in V2O5-treated (24 h) NK-92MI cells. Analyses performed after exposure to different concentrations (25–400 µM) of V2O5. Top figure shows results on simple labeling cell assays; lower figure shows behavior of both molecules on cells. (A) BAD and p-BAD (Ser112), (B) BAK and BAX. Data in each quadrant of zebra plots (C, D) are presented as percentages. Quadrants were defined according to isotype controls for each antibody used. Results exemplify one of three independent experiments performed with each V2O5 level. Dashed line shows basal MFI at 0 μM. *p < 0.05, **p < 0.01 versus control (basal).
Effect of V2O5 on the expression/activation of caspases
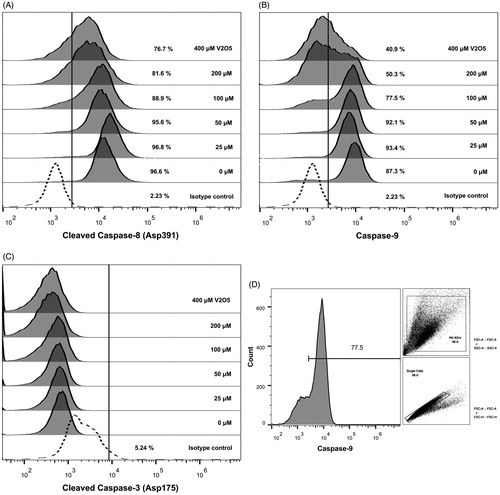
Exposure to V2O5 reduced expression of the cleaved and the active forms of caspase-8 starting at 100 μM (). A similar result was found with caspase-9 expression (). Cleaved and active caspase-3 expressions were not affected by V2O5 exposure at any dose ().
Figure 9. Caspases expression in V2O5-treated (24 h) NK-92MI cells. (A) Cleaved caspase-8 (Asp391); (B) caspase-9; and, (C) cleaved caspase-3 (Asp175). Results represent percentage of positive cells in relation to respective isotype control. (D) Analysis strategy of cytofluorometry data. The image represents data obtained when caspase-9 expression was evaluated in 100 µM V2O5-treated cells. All data was analyzed following this dot plot strategy.
Discussion
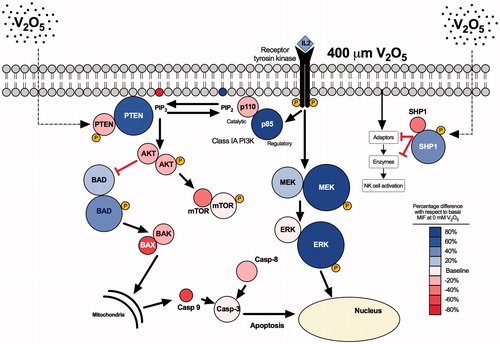
The present study results showed that V2O5 affected IL-2-dependent PI3K/Akt/mTOR and MAPKs signaling pathways (). The IL-2 cDNA transfected human NK cell line used conserved its CD56bright phenotype, thus denoting a true activated NK cell (Sharma and Das Citation2014). The V2O5 concentrations used here were greater than blood levels reached in chronic exposures in rat and mouse models to assess vanadium carcinogenicity, but were within the blood concentration range reported in short-term inhalation studies performed with laboratory animals and possibly within the range associated with highly exposed occupational tasks when performed without protective personal equipment (air levels of 0.01–60 mg/m3) [World Health Organization (WHO) Citation2000]. Water-insoluble particles like V2O5 are ingested by resident alveolar macrophages. Once in a macrophage phagosome, the particles undergo slow dissolution which generate free ions that can potentially exit the cells, then enter/cross through epithelial cells and ultimately into erythrocytes, and so become a part of the generic circulation (Cohen et al. Citation2010). It is these latter now-solubilized forms of vanadium to which NK cells are most likely exposed in situ (Roberts et al. Citation2004).
Figure 10. Schematic representation of V2O5-induced toxicity. Image shows how V2O5 might modify expression of the molecules (expression gradated by color) in relation to basal expression in non-treated NK-92MI cells. The main effect of V2O5 was upon SHP1 and PTEN phosphatases, both of which regulate signaling pathways depicted in the diagram.
Effects upon the immune system vary widely with particular vanadium compounds and are often a function of the differing oxidation status. While vanadium (in terms of metal) has been reported to act to stimulate macrophage phagocytic activity/overall activation (Qureshi et al. Citation1999), it is also known to act as an immunosuppressant (Keil et al. Citation2016). V2O5 has been reported to dysregulate humoral response homeostasis in workers at a V2O5 production facility (Musk and Tees Citation1982) and to suppress humoral responses in mice immunized with an HBsAg vaccine (Pinon-Zarate et al. Citation2008). Accordingly, any stimulation or suppression of innate immune cells induced by V2O5 probably does not represent its slow dissolution in situ but more likely to its relative concentration in the immune system environs of the exposed animals and humans (as proposed originally by Sitprija et al. (Citation1993)).
The results of our earlier studies (as well as here) of granularity, cell size and viability in V2O5-exposed NK cells showed how increasing concentration of V2O5 induced cell death by a probable apoptotic process (Gallardo-Vera et al. Citation2016). Therefore, the present study also evaluated caspases and signaling pathways involved in their activation. Exposure of the NK cells to V2O5 did not modify caspase-3, but it slightly reduced caspase-8 and -9 and significantly reduced expression of Bax and Bak. The latter molecules are pro-apoptotic regulator molecules (Jourdan et al. Citation2009) and cells deficient in both molecules are resistant to apoptosis (Leblanc et al. Citation2002). Bax and Bak can be activated by directly binding of certain BH3-only proteins (Westphal et al. Citation2014). V2O5 also significantly increased the amount of Bad and phospho-Bad, both considered pro-apoptotic (Jourdan et al. Citation2009); this would be consistent with a decrease in cell viability and increased granularity. The double-labeling results of the pro-apoptotic molecule and its phosphorylated form expression confirmed the results.
Vanadium exposure here also increased the levels of MEK1, pMEK1/2 and pERK1/2 in a dose-dependent manner; ERK1/2 expression was not affected, which is in accordance with our previous results (Gallardo-Vera et al. Citation2016). Surprisingly, the increases in expression of phosphorylated forms of MEK1 and ERK1/2 dispute any activation of ERK1/2 signaling, but the ERK pathway is mainly associated to the maintenance of the cell cytoskeleton (Ahn et al. Citation2013). The latter results suggest these increases might be associated with NK cell death in the presence of high concentrations of V2O5. It is possible the latter is exercised by a mechanism similar to that induced by Pristimerin on IL-2-activated T-cells (Liu et al. Citation2016). All these results suggest that cell death in vanadium-exposed NK cells is secondary to non-caspase-dependent signaling. Consequently, NK cell death observed here might be a consequence of increased ERK and MEK activation (as noted in Akhiani et al. Citation2014), since phosphorylation of BAD could not be initiated by Akt/protein kinase B (since V2O5 decreased Akt expression).
The p85α-subunit of PI3K binds and stabilizes the p110α-subunit; when p85α levels are low, p110α sequesters and saturates that molecule. When p85α levels are high, p110α binds PTEN and positively regulate its phosphatase activity (Chagpar et al. Citation2010). The data here showed that high doses of V2O5 (i.e. 100–400 µM) significantly increased p85α and p-PI3K expression, but at the same time decreased those of Akt and mTOR and their phosphorylated forms. Interestingly, from the lower (i.e. 25 µM) doses of V2O5 upward, expression of phosphorylated mTOR also decreased. It is possible these results were due to the increase in PTEN expression. PTEN intracellular increase dephosphorylates membrane PIP2 and PIP3 (Leslie et al. Citation2016), thus inactivating the Akt and mTOR signaling pathway (Garcia-Junco-Clemente and Golshani, Citation2014); as the results showed. V2O5 is known to induce an intracellular oxidative environment (Cano-Gutierrez et al. Citation2012) and such an environment inhibits the activity of PTEN, promoting the accumulation of proteins (Matsumoto et al. Citation2016). This mechanism can explain the increase in PI3K and phosphorylated PI3K. The current results also showed a decrease in the phosphorylation of PTEN, although this change was not highly significant. This result was consistent with the above-mentioned explanation of V2O5 favoring an open/active conformation, so PTEN cannot be phosphorylated (although the zebra plots suggest there is a sub-population that maintains initial phosphorylated status). The lack of pPTEN avoids the de-phosphorylation of PIP3 to PIP2, thus partially inhibiting the Akt/mTOR cascade (Myers et al. Citation1998). It was interesting to observe that although cell viability decreased in a V2O5 dose-related manner, the progressively lower number of live cells present displayed differential responses in terms of the various phosphorylated forms of the proteins measured. This would be in keeping with previous evidence showing that oxovanadium (a frequent form of vanadium found in the atmosphere) can affect phosphorylation of important proteins related to intracellular signaling pathways, especially Akt, in a dose-dependent manner (Leon et al. Citation2016).
Protein tyrosine phosphatases (PTP) are probably the best characterized reactive oxygen species (ROS) (Valko et al. Citation2006). V2O5 decreased the amount of SHP1, a phosphatase that regulates Wnt and Akt signaling via de-phosphorylation of GSK3β (Clodfelder-Miller et al. Citation2005). The absence of SHP1 makes NK cells hypo-responsive to tumor cells (Viant et al. Citation2014) because a self-killing degranulation process mediated by NK activator receptors is initiated (Mahmood et al. Citation2012). Nevertheless, the results here also showed that low quantities of SHP1 were phosphorylated at very high V2O5 concentrations. The phosphorylated SHP1 is the active form of the phosphatase that dephosphorylates GSK3, thus inactivating PTEN phosphorylation. Consequently, PIP3 is able to convert into PIP2 and inactivate the Akt pathway. GSK3 can modulate PTEN via the PTEN/PI3K/Akt signaling pathways (Wang et al. Citation2015). In summary, the effects of V2O5 on the NK cell line appear to disrupt primarily the PTEN phosphorylation process, but its effects on transcription factors that regulate the transcription of PTEN (such as EGR-1, p53, ATF2, and PPARγ) remain to be determined.
The results here indicate that a continuous exposure to V2O5 that might result in high concentrations of circulating V2O5 could influence expression of molecules associated with NK cell proliferation and response to growth factors. In turn, this could affect the innate immune response.
Luis_Monta_o_et_al_supplemental_content.zip
Download Zip (617.7 KB)Acknowledgements
The authors wish to thank Biol. Patricia Espinoza Cueto, Instituto de Investigaciones Biomédicas, UNAM for technical assistance.
Disclosure statement
No potential conflict of interest was reported by the authors.
Additional information
Funding
References
- Ahn Y, Shin I, Kim J, Kim Y, Lee C, Ju S, An W. 2013. Counteracting the activation of pAkt by inhibition of MEK/Erk inhibition reduces actin disruption-mediated apoptosis in PTEN-null PC3M prostate cancer cell lines. Oncol Lett. 6:1383–1389.
- Akhiani A, Werlenius O, Aurelius J, Movitz C, Martner A, Hellstrand K, Thoren F. 2014. Role of the ERK pathway for oxidant-induced parthanatos in human lymphocytes. PLoS One. 9:e89646.
- Bi J, Zhang Q, Liang D, Xiong L, Wei H, Sun R, Tian Z. 2014. T-cell Ig and ITIM domain regulates natural killer cell activation in murine acute viral hepatitis. Hepatology. 59:1715–1725.
- Cano-Gutierrez G, Acevedo-Nava S, Santamaria A, Altamirano-Lozano M, Cano-Rodriguez M, Fortoul T. 2012. Hepatic megalocytosis due to vanadium inhalation: Participation of oxidative stress. Toxicol Ind Health. 28:353–360.
- Chagpar R, Links P, Pastor M, Furber L, Hawrysh A, Chamberlain M, Anderson D. 2010. Direct positive regulation of PTEN by the p85 subunit of phosphatidylinositol 3-kinase. Proc Natl Acad Sci USA. 107:5471–5476.
- Clodfelder-Miller B, de Sarno P, Zmijewska A, Song L, Jope R. 2005. Physiological and pathological changes in glucose regulate brain Akt and glycogen synthase kinase-3. J Biol Chem. 280:39723–39731.
- Cohen M, Sisco M, Prophete C, Yoshida K, Chen L, Zelikoff J, Smee J, Holder A, Stonehuerner J, Crans D, et al. 2010. Effects of metal compounds with distinct physicochemical properties on iron homeostasis and antibacterial activity in the lungs: Chromium and vanadium. Inhal Toxicol. 22:169–178.
- Colin-Barenque L, Pedraza-Chaverri J, Medina-Campos O, Jimenez-Martinez R, Bizarro-Nevares P, Gonzalez-Villalva A, Rojas-Lemus M, Fortoul T. 2015. Functional and morphological olfactory bulb modifications in mice after vanadium inhalation. Toxicol Pathol. 43:282–291.
- Dutta A, Bhattacharya P, Lahiri T, Ray M. 2012. Immune cells and cardiovascular health in premenopausal women of rural India chronically exposed to biomass smoke during daily household cooking. Sci Total Environ. 438:293–298.
- Fortoul T, Quan-Torres A, Sanchez I, Lopez I, Bizarro P, Mendoza M, Osorio L, Espejel-Maya G, Avila-Casado M, Avila-Costa M, et al. 2002. Vanadium in ambient air: Concentrations in lung tissue from autopsies of Mexico City residents in the 1960s and 1990s. Arch Environ Health. 57:446–449.
- Fortoul van der Goes T, Rodriguez-Lara V, González-Villalva A, Rojas-Lemus M, Cano-Gutiérrez G, Ustarroz-Cano M, Colin-Barenque L, Bizarro-Nevares P, García-Pealez I, Montano L, et al. 2014. Inhalation of vanadium pentoxide and its toxic effects in a mouse model. Inorg Chim Acta. 420:8–15.
- Gallardo-Vera F, Diaz D, Tapia-Rodriguez M, Fortoul van der Goes T, Masso F, Rendon-Huerta E, Montano L. 2016. Vanadium pentoxide prevents NK-92MI cell proliferation and IFNγ secretion through sustained JAK3 phosphorylation. J Immunotoxicol. 13:27–37.
- Garcia-Junco-Clemente P, Golshani P. 2014. PTEN: A master regulator of neuronal structure, function, and plasticity. Commun Integr Biol. 7:e28358.
- Hurd T, Whalen M. 2011. Tetrabromobisphenol A decreases cell-surface proteins involved in human natural killer (NK) cell-dependent target cell lysis. J Immunotoxicol. 8:219–227.
- Ivancsits S, Pilger A, Diem E, Schaffer A, Rudiger H. 2002. Vanadate induces DNA strandbreaks in cultured human fibroblasts at doses relevant to occupational exposure. Mutat Res. 519:25–35.
- Jourdan M, Reme T, Goldschmidt H, Fiol G, Pantesco V, de Vos J, Rossi J, Hose D, Klein B. 2009. Gene expression of anti- and pro-apoptotic proteins in malignant and normal plasma cells. Br J Haematol. 145:45–58.
- Keil D, Buck B, Goossens D, Teng Y, Pollard J, McLaurin B, Gerads R, DeWitt J. 2016. Health effects from exposure to atmospheric mineral dust near Las Vegas, NV, USA. Toxicol Rep. 3:785–795.
- Korbecki J, Baranowska-Bosiacka I, Gutowska I, Chlubek D. 2012. Biochemical and medical importance of vanadium compounds. Acta Biochim Pol. 59:195–200.
- Leblanc H, Lawrence D, Varfolomeev E, Totpal K, Morlan J, Schow P, Fong S, Schwall R, Sinicropi D, Ashkenazi A. 2002. Tumor-cell resistance to death receptor-induced apoptosis through mutational inactivation of the proapoptotic Bcl-2 homolog Bax. Nat Med. 8:274–281.
- Leon I, Butenko N, di Virgilio A, Muglia C, Baran E, Cavaco I, Etcheverry S. 2014. Vanadium and cancer treatment: Anti-tumoral mechanisms of three oxido-vanadium(IV) complexes on a human osteosarcoma cell line. J Inorg Biochem. 134:106–117.
- Leon I, Diez P, Etcheverry S, Fuentes M. 2016. Deciphering the effect of an oxovanadium(IV) complex with the flavonoid chrysin (VOChrys) on intracellular cell signaling pathways in an osteosarcoma cell line. Metallomics. 8:739–749.
- Leslie N, Kriplani N, Hermida M, Alvarez-Garcia V, Wise H. 2016. The PTEN protein: Cellular localization and post-translational regulation. Biochem Soc Trans. 44:273–278.
- Liao W, Lin J, Leonard W. 2013. Interleukin-2 at the crossroads of effector responses, tolerance, and immunotherapy. Immunity. 38:13–25.
- Liu Y, Gao X, Deeb D, Zhang Y, Shaw J, Gautam S. 2016. Anticancer agent pristimerin inhibits IL-2 induced activation of T-lymphocytes. J Exp Ther Oncol. 11:181–188.
- Lu L, Zhu J, Zheng Z, Yan M, Xu W, Sun L, Theze J, Liu X. 1998. Jak-STAT pathway is involved in the induction of TNF-β gene during stimulation by IL-2. Eur J Immunol. 28:805–810.
- Mahmood S, Kanwar N, Tran J, Zhang M, Kung S. 2012. SHP-1 phosphatase is a critical regulator in preventing natural killer cell self-killing. PLoS One. 7:e44244.
- Matsumoto C, Almeida L, Guimaraes D, Martins M, Papagerakis P, Papagerakis S, Leopoldino A, Castilho R, Squarize C. 2016. PI3K-PTEN dysregulation leads to mTOR-driven up-regulation of core clock gene BMAL1 in normal and malignant epithelial cells. Oncotarget. 7:42393–42407.
- Muller L, Chehrazi C, Henderson M, Noah T, Jaspers I. 2013. Diesel exhaust particles modify natural killer cell function and cytokine release. Part Fibre Toxicol. 10:16.
- Musk A, Tees J. 1982. Asthma caused by occupational exposure to vanadium compounds. Med J Aust. 1:183–184.
- Myers M, Pass I, Batty I, van der Kaay J, Stolarov J, Hemmings B, Wigler M, Downes C, Tonks N. 1998. The lipid phosphatase activity of PTEN is critical for its tumor supressor function. Proc Natl Acad Sci USA. 95:13513–13518.
- Nemmar A, Hoylaerts M, Hoet P, Nemery B. 2004. Possible mechanisms of the cardiovascular effects of inhaled particles: Systemic translocation and prothrombotic effects. Toxicol Lett. 149:243–253.
- Pinon-Zarate G, Rodriguez-Lara V, Rojas-Lemus M, Martinez-Pedraza M, Gonzalez-Villalva A, Mussali-Galante P, Fortould T, Barquet A, Masso F, Montano L. 2008. Vanadium pentoxide inhalation provokes germinal center hyperplasia and suppressed humoral immune responses. J Immunotoxicol. 5:115–122.
- Qureshi M, Hill C, Heggen C. 1999. Vanadium stimulates immunological responses of chicks. Vet Immunol Immunopathol. 68:61–71.
- Rivera A, Siracusa M, Yap G, Gause W. 2016. Innate cell communication kick-starts pathogen-specific immunity. Nat Immunol. 17:356–363.
- Roberts J, Taylor M, Castranova V, Clarke V, Antonini J. 2004. Soluble metals associated with residual oil fly ash increase morbidity and lung injury after bacterial infection in rats. J Toxicol Environ Health. 67:251–263.
- Shafer M, Toner B, Overdier J, Schauer J, Fakra S, Hu S, Herner J, Ayala A. 2012. Chemical speciation of vanadium in particulate matter emitted from diesel vehicles and urban atmospheric aerosols. Environ Sci Technol. 46:189–195.
- Sharma R, Das A. 2014. Organ-specific phenotypic and functional features of NK cells in humans. Immunol Res. 58:125–131.
- Sitprija V, Tungsanga K, Tosukhowong P, Leelhaphunt N, Kruerklai D, Sriboonlue P, Saew O. 1993. Metabolic problems in northeastern Thailand - Possible role of vanadium. Mineral Electrolyte Metab. 19:51–56.
- Suzuki R, Handa K, Itoh K, Kumagai K. 1983. Natural killer (NK) cells as a responder to interleukin (IL)-2). I. Proliferative response and establishment of cloned cells. J Immunol. 130:981–987.
- Valko M, Rhodes C, Moncol J, Izakovic M, Mazur M. 2006. Free radicals, metals and antioxidants in oxidative stress-induced cancer. Chem Biol Interact. 160:1–40.
- Viant C, Fenis A, Chicanne G, Payrastre B, Ugolini S, Vivier E. 2014. SHP-1-mediated inhibitory signals promote responsiveness and anti-tumour functions of natural killer cells. Nat Commun. 5:5108.
- Wang G, Shi Y, Jiang X, Leak R, Hu X, Wu Y, Pu H, Li W, Tang B, Wang Y, et al. 2015. HDAC inhibition prevents white matter injury by modulating microglia/macrophage polarization through the GSK3β/PTEN/Akt axis. Proc Natl Acad Sci USA. 112:2853–2858.
- Westphal D, Kluck R, Dewson G. 2014. Building blocks of the apoptotic pore: How Bax and Bak are activated and oligomerize during apoptosis. Cell Death Differen. 21:196–205.
- Whiteman D, Zhou X, Cummings M, Pavey S, Hayward N, Eng C. 2002. Nuclear PTEN expression and clinicopathologic features in a population-based series of primary cutaneous melanoma. Intl J Cancer. 99:63–67.
- WHO (World Health Organization). 2000. Chapter 6.12, Vanadium. WHO Regional Office for Europe, Copenhagen: WHO.
- Wortham B, Eppert B, Motz G, Flury J, Orozco-Levi M, Hoebe K, Panos R, Maxfield M, Glasser S, Senft A, et al. 2012. NKG2D mediates NK cell hyperresponsiveness and influenza-induced pathologies in a mouse model of chronic obstructive pulmonary disease. J Immunol. 188:4468–4475.
- Wu D, Guo Z, Ren Z, Guo W, Meydani S. 2009. Green tea EGCG suppresses T-cell proliferation through impairment of IL-2/IL-2 receptor signaling. Free Radic Biol Med. 47:636–643.