
ABSTRACT
Reliable measurements are of utmost importance when investigating the relationship between light and human reactions. The aim of the present study was to compare two methods for measuring light exposure in real working environments. Ambulatory recordings of illuminance and irradiance were compared with static field measurements of horizontal illuminance at the normal working position, average horizontal illuminance in the room, vertical illuminance at the position of the eye in the normal angle of gaze, and spectral composition of the light radiation at the normal working position and at the position of the eye in the normal angle of gaze. The ambulatory measurements were carried out during a 3-day experimental period and were repeated monthly throughout the year. The static field measurements in the subjects’ offices were conducted five times during the year, in the morning and afternoon during one day. The relationship between the illuminances and irradiances measured with the portable instruments and the static measurements was statistically analyzed. Results from the analyses revealed that more than one third of the static measurements of vertical illuminances recorded were below 200 lx, and only 7% of the measurements exceeded 1000 lx. Measurements of the spectral composition of the light radiation in the rooms suggested that the light, although at a fairly low intensity, included relatively much radiation that can have a non-image forming effect. Furthermore, only a small number of significant correlations between the ambulatory and static measurements were found. Results from the t-tests showed that there were no differences between ambulatory measurements, and static measurements of horizontal illuminance at the normal position, average illuminance in the room and vertical illuminance at the position of the eye during three, five, and seven of the 10 measurements, respectively. There is a need to define appropriate parameters in order to describe the quality of a lit environment with respect to the non-image-forming effects of light radiation.
1. Introduction
The methods used for measuring and estimating the lighting in an environment are becoming increasingly important considering the growing knowledge about the non-image-forming effects of light (Lucas et al. Citation2014). The spectral composition of the exposing light radiation is an important parameter to consider when investigating non-image-forming effects. Rods, cones, and intrinsically photosensitive retinal ganglion cells, containing the photo pigment melanopsin, differentially contribute to the phototransduction over a wide range of intensities (Gooley et al. 2010, Citation2012; Lall et al. Citation2010). Furthermore, the photosensitivity function for the melanopsin pigment is shifted toward the short wavelength part of the spectrum, with a maximum sensitivity at approximately 480 nm (Bailes and Lucas Citation2013; Zaidi et al. Citation2007). Two action spectra for human melatonin suppression have reported a peak sensitivity at wavelengths between 459 and 477 nm (Brainard et al. Citation2001; Thapan et al. Citation2001). On the other hand, in humans short, middle, and long wavelength cone opsins have a maximum sensitivity at approximately 420, 535, and 565 nm, respectively, and the rod opsin is most sensitive to light radiation at approximately 500 nm (Lucas et al. Citation2014).
In addition to spectral energy distribution, the non-image-forming effects of exposure to light radiation are dependent of intensity, timing and duration, and exposure pattern or light history, among others (Cajochen et al. Citation2000; Chang et al. 2011, Citation2012, Citation2013; Czeisler et al. Citation1989; Gronfier et al. Citation2004; Hébert et al. Citation2002; Khalsa et al. Citation2003; Kripke et al. Citation2007; Revell et al. Citation2012; Rimmer et al. Citation2000; Rufiange et al. Citation2003; Rüger et al. Citation2013; Smith et al. Citation2004; St. Hilaire et al. Citation2012; Zeitzer et al. Citation2000).
In order to understand the relationship between light and human reactions, reliable measurements are of utmost importance. Some authors have used diaries to record participants’ exposure to bright natural daylight (that is, time spent outdoors between sunrise and sunset). Graw et al. (Citation1999) reported the total time that subjects spent outdoors every half hour throughout the day during a week of measurement. Eastman (Citation1990) let participants record the time they spent outdoors in daylight and reported the skeleton photo period, a parameter defined as the time period between the first and last exposure to daylight during the day, in addition to total exposure to bright natural light.
Studies using instruments for ambulatory measurement of exposing light radiation have demonstrated how people, including office daytime workers, nurses, outdoor workers, students, shift workers, and older people, typically are exposed to light radiation in their natural environment (Dumont et al. Citation2001; Figueiro and Rea Citation2010, Citation2016; Hubalek et al. Citation2010; Michima et al. Citation2001; Miller et al. Citation2010; Shochat et al. Citation2000). Most studies have used instruments for ambulatory measurement of illuminance, calibrated according to the CIE photopic luminous efficiency function, and some recent studies have used instruments separating the measurement of light radiation into intensities in different wavelength bands or that are calibrated according to different spectral efficiency functions for the effects on the human circadian system. Currently several instruments for ambulatory measurement of illuminance and a few for measurement of irradiance are commercially available.
The daily light exposure pattern has been described by various parameters such as daily integrated amount and average illuminance throughout the day and during different time periods of the day (Espiritu et al. Citation1994; Higushi et al. Citation2007; Morita et al. Citation2002). Furthermore, light exposure has been characterized by hourly average illuminance throughout the day or time spent over various intensity thresholds ranging from 10 to 25,000 lx or within certain ranges; for example, 0.1–1 lx, 1–100 lx, 100–1000 lx, and >1000 lx (Aan Het Rot et al., Citation2008; Cambell et al. Citation1988; Cole et al. Citation1995; Goulet et al. Citation2007; Hébert et al. Citation1998; Okudaira et al. Citation1983; Savides et al. Citation1986; Wehr et al. Citation1995). An intensity of 1000 lx or more has often been defined as bright light exposure (Guillemette et al. Citation1998; Staples et al. Citation2009; Ueno-Towatari et al. Citation2007). Kawinska et al. (Citation2005) reported relative light patterns by comparing luminous exposure every hour with mean exposure during the week of measurement. In some studies, circadian data—for example, mesor (that is, mean), acrophase (that is, peak time), and amplitude (that is, height of the peak)—of the cosine-fitted daily rhythm of light exposure have been reported (Girardin et al. Citation2000; Grandner et al. Citation2006; Park et al. Citation2007).
Thorne et al. (Citation2009) measured light exposure in daily life with a wrist-worn Actiwatch-RGB monitor. This instrument differentiates between short, middle, and long wavelength light radiation. The short wavelength band register light radiation between 400 and 580 nm, with a peak sensitivity at 470 nm; the middle wavelength band includes wavelengths between 500 and 650 nm, with a peak sensitivity at 565 nm; and the long wavelength band records wavelengths between 620 and 720 nm, with a peak sensitivity at 640 nm. Figuiero and Rea (Citation2010, Citation2016] used a portable instrument worn on the head and with two sensors placed near the plane of the cornea [Bierman et al. Citation2005). One of the sensors measured illuminance according to the CIE photopic luminous efficiency function and the other sensor measured light radiation in relation to a sensitivity function with a peak in the short wavelength part of the spectrum. The parameter circadian light was then calculated by postprocessing of the two types of light radiation data. In a Swiss study, Hubalek et al. (Citation2010) used an instrument measuring both illuminance with respect to the spectral sensitivity function for photopic vision and irradiance according to a spectral sensitivity function for non-image-forming effects of light. The instrument was worn on the head with the two sensors attached to spectacle frames.
Most studies investigating seasonal variation in light exposure, including the aforementioned field studies, have been carried out in the Northern Hemisphere at latitudes between 32° and 52°. There are, however, few studies investigating the daily and seasonal light exposure patterns of people living in more northern locations with greater differences in photoperiod length during the year.
Static measurements are often used when designing and evaluating how much light people are exposed to in rooms and buildings as well as in outdoor environments. Moreover, in field studies investigating personal light exposure in real living and working environments, it is not always possible or convenient for subjects to carry the ambulatory measuring instruments. This study deals with the question of whether there are any significant correlations between ambulatory measurements of light exposure and static measurements at different locations in a room. In order to investigate the relationship between various parameters that can be used for describing lighting quality with respect to the non-image-forming effects of light radiation, the aim of present study was to compare two different methods for measuring the radiant exposure in real working environments. This was done in order to gain knowledge about the reliability and validity of the different methods that were used. The first method was traditional static measurements of horizontal illuminance at the normal working position, average horizontal illuminance in the room, and vertical illuminance at the position of the eye in the normal angle of gaze. This method also included static measurements of the spectral composition of the exposing light radiation, which were measured horizontally at the normal working position and at the position of the eye in the normal angle of gaze. In the second method, two instruments for ambulatory recording of illuminance and irradiance were used. The results of the two methods were then compared.
2. Methods
2.1. Subjects and settings
A total of 30 subjects (mean age = 46.1 years, SD = 9.8, range = 28–61 years) were enrolled to participate in a longitudinal study that was carried out in the south of Sweden (56° N) from February 2008 to January 2009. Participants were daytime office workers and worked 36–40 h on weekdays. Ambulatory measurements of exposing light radiation were collected by 15 of the 30 subjects. Static measurements of illuminances and the spectral composition of light radiation in the rooms were conducted in all 30 workspaces in the morning and afternoon five times throughout the year.
The workplaces were situated in private offices or small group offices with three to six desks. The offices were primarily lit by localized lighting from pendant luminaires with direct/indirect or indirect distributions and equipped with fluorescent tubes. Additional lighting included down lights and wall luminaires equipped with compact fluorescent lamps. The light sources had a correlated color temperature between 3000 and 3500 K. Internal venetian blinds with horizontal slats offered manual, local control of the amount of daylight. All except one workplace had access to daylight from a side window and the subjects were seated on average 1.7 m (SD = 1.1, range = 1.1–6.8 m) from a window. Regarding cardinal directions of the windows, four of the offices had windows oriented toward north, four toward northeast, one toward east, four toward northwest, and six toward southwest. Moreover, four of the offices had windows facing northeast and two had windows facing west.
A majority of the offices received some borrowed light from adjacent spaces through glazed indoor partitions. The colors in the offices were rather neutral or had some, but not very vivid, colors. The roofs and walls were white and the floors had light grey or red/brown carpets and the offices had light wood furniture.
2.2. Dropout
Technical irregularities resulted in 16% missing values from the ambulatory measurements of irradiance. A late change of experimental week by one subject resulted in 2% of missing data from the ambulatory measurements of illuminance. A total of 1.1% of the data were missing from the static measurements.
2.3. Procedure
Two instruments were used for monthly ambulatory measurements of light exposure. During a 3-day measuring period, an Actiwatch monitor (Minimitter/Respironics, Bend, OR), worn on the nondominant wrist, recorded an illuminance value every minute. In addition, a prototype instrument, with seven channels and a bandwidth of 50 nm, ranging from 400 to 750 nm, was used to record irradiance every minute for 48 h. The instrument consists of photonic devices (Hamamatsu Photonics K.K., Hamamatsu City, Japan) and a linear variable band-pass filter (Edmund Optics Inc., Barrington, New Jersey, USA) for spectral filtering. Validation of spectral sensitivity, accuracy, and linearity was performed by calculating calibration equations for the seven channels according to simultaneous measurements with a spectroradiameter (Light Spex: McMahan Research Laboratories, Chapel Hill, North Carolina, USA) in different lighting conditions, including both daylight and artificial lighting. The sensor was positioned on the chest and the data storage module was worn in a shoulder bag. The two instruments were worn during the waking period and placed close to the subjects—for example, on a bedside table—when in bed.
The lighting conditions in the offices, during actual working conditions with the subjects’ settings of the artificial light and blinds, were assessed by field measurements conducted in the morning between 8:00 am and 11:30 am (m = 9:42 am) and in the afternoon between 1:45 pm and 4:45 pm (m = 2:56 pm) five times during the year. Measurements were carried out during the following time periods: February 6–March 13, April 7–May 13, June 4–July 4, September 9–October 16, and December 1–January 23. The measurements were recorded with the subjects present at their normal working position. shows the number of measurements that were performed in different weather conditions, positions of the blinds and artificial lighting conditions at the times of measurement, and the total number of static illuminance and irradiance measurements that were carried out during the five measurement periods.
Table 1. Weather conditions, positions of the blinds, and artificial lighting conditions at the times of measuring and the total number of static illuminance (Ill) and irradiance (Irr) measurements carried out during the five measurement periods.
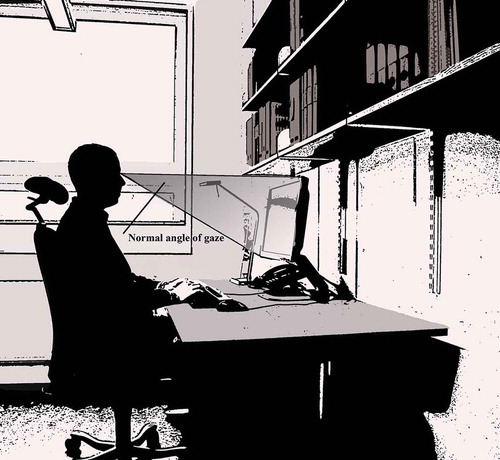
A Hagner Universal Photometer S4 (B. Hagner AB, Solna, Sweden), equipped with a SD 2 detector (B. Hagner AB, Solna, Sweden), was used for the measurements of illuminance in the offices. shows five examples of office layouts, including the positions of measuring points, locations of computer monitors and luminaires, and the location where subjects were normally seated. Horizontal and vertical illuminances were measured on the desks where the subjects were normally seated. Additional measuring points included the working area immediately surrounding the normal task area and the peripheral surrounding of the normal task area. Vertical illuminance at the position of the eye in the normal angle of gaze was also measured (see ).
Fig. 1. Five examples of office layouts. The plans show where the subjects were seated, positions of computer monitors and luminaires, and locations of the measuring points.
Fig. 2. Drawing showing a typical working position and the normal angle of gaze.
The spectral composition of the light radiation in the offices was recorded with an Avantes Avaspec- 2048- USB 2 spectroradiometer (Avantes BV, Apeldoorn, Netherlands). Measurements were performed at the position of the eye in the normal angle of gaze and horizontally on the desk in front of the subjects’ normal working position.
2.4. Data analysis
Mean horizontal illuminances at the normal task position, average horizontal illuminance in the room, and mean vertical illuminance at the position of the eye in the normal angle of gaze were calculated for the group. Regarding the static measurements of the spectral composition of the light radiation in the offices, irradiance in the ranges 400–550, 550–650, and 650–750 nm were calculated. Resolution of the static measurements conducted in the morning and afternoon on five days during the year did not allow missing data to be replaced with individual seasonal averages. Therefore, missing data from the static measurements were replaced by individual annual average illuminance for the corresponding time point.
Data from the ambulatory measurements were averaged over the hour and the day across the measurement periods. In order to compare data from the ambulatory measurements with data from the static measurements, the mean illuminance for the time period between 9:00 am and 10:00 am and 2:00 pm and 3:00 pm in February/March, April/May, June, September/October, and December/January, corresponding to the mean time of the static measurements, was subsequently calculated. Furthermore, according to the subjects’ work schedules, these were time periods when they likely were in their offices.
Data from the irradiance recordings were similarly treated and separated into three wavelength bands, short wavelength (400–550 nm), middle wavelength (550–650 nm), and long wavelength (650–750 nm). Missing values were replaced by individual seasonal means for the corresponding time period. Winter included the months of November, December, and January; spring included February, March, and April; summer included May, June, and July; and autumn included August, September, and October.
The Statistical Program for Social Sciences (Version 19) was used for the analyses. Pearson’s product-moment correlation coefficient and dependent means t-tests were used to assess the relationship between the illuminance and irradiance measured with the portable instruments and the static measurements. A P value of <0.05 was considered to be significant.
3. Results
The results from the static measurements of illuminance showed that the average horizontal illuminance at the normal working position was 738 lx (SD = 490 lx) throughout the year. Illuminance uniformity, U0 = Emin/Eaverage, in the offices was on average 0.4 (SD = 0.16) throughout the year. Moreover, the average horizontal illuminance in the room was 621 lx (SD = 293 lx) and the average vertical illuminance at the position of the eye in the normal angle of gaze was 442 lx (SD = 365 lx).
The horizontal illuminance at the normal working position was between 200 and 600 lx in 44.6% of the 300 measurements; 7% of the measurements showed illuminances less than 200 lx; and 48.1% of the measurements showed illuminances exceeding 600 lx; in addition, 50.6% of the 300 measurements of vertical illuminance at the position of the eye in the normal angle of gaze showed values between 200 and 600 lx and 31.7% of the measurements showed values below 200 lx. Vertical illuminances above 600 lx were recorded during 17.8% of the measurements and exceeded 1000 lx during 7.3% of the measurements. The ambulatory recordings showed an annual average illuminance of 380 lx (SD = 320 lx) for the time periods between 9:00 am and 10:00 am and 2:00 pm and 3:00 pm. shows the results from the static measurements and ambulatory measurements of illuminance in the morning and in the afternoon for the five measurement periods.
Table 2. Static measurements of horizontal illuminance at the normal working position (EHN), average illuminance in the room (EHR), vertical illuminance at the position of the eye (EVE), and ambulatory recording of illuminance (EAMB).
Static measurements of the spectral composition of the visible radiation in the offices, measured vertically at the position of the eye in the normal angle of gaze, revealed that the short wavelength band (400–550 nm) contributed to 50% (SD = 16%) of the total visible radiation and the middle wavelength band (550–650 nm) and the long wavelength band (650–750 nm) contributed to 35% (SD = 6%) and 14% (SD = 7%) of the total visible radiation, respectively. The results from analysis of the data collected with the ambulatory instruments showed that the total visible irradiance was composed of 34% (SD = 13%) short wavelength radiation (400–550 nm), 22% (SD = 16%) middle wavelength radiation (550–650 nm), and 44% (SD = 12%) long wavelength radiation (650–750 nm). displays the results of the static and ambulatory recordings of the spectral composition for the five measurement periods.
Table 3. Static measurements of the spectral composition at the position of the eye (IRRVE) and ambulatory (IRRAMB) measurements of the spectral composition of the exposing light radiation.
For comparison, shows that an incandescent lamp includes 19% of the visible radiation in the wavelength band 400–550 nm and 33% and 48% in the wavelength bands 550–650 and 650–750 nm, respectively. On the other hand, a fluorescent lamp with a correlated color temperature of 3000 K includes 47% in the wavelength band 400–550 nm and 47% and 6% in the wavelength bands 550–650 and 650–750 nm, respectively. Concerning daylight, for a CIE standard illuminant D65, the short wave length band (400-550nm) contribute to 54 % of the total visible radiation and the middle and long wave length bands contribute to 26 and 20 %, respectively.
Fig. 3. Relative energy distribution for an incandescent lamp, a fluorescent lamp with a correlated color temperature of 3000 K, and daylight, CIE standard illuminant D65.
In order to compare the two methods for describing the lighting conditions in real working environments, correlations between the different parameters were estimated. First, regarding the static measurements in the offices, the results showed significant correlations (r = 0.439–0.974) between the horizontal illuminance at the normal working position and the average illuminance in the room, between the horizontal illuminance at the normal working position and the vertical illuminance at the position of the eye in the normal angle of gaze, and between the average illuminance in the room and the vertical illuminance at the position of the eye in the normal angle of gaze. shows the correlations between the three parameters that were measured with the instrument for static measurement of illuminance.
Table 4. Pearson product-moment correlations (r) between the three parameters included in the static measurement of illuminances in the offices, horizontal illuminance at the normal working position (EHN), average horizontal illuminance in the room (EHR), and vertical illuminance at the position of the eye (EVE).
Turning to the correlations between the static measurements and the ambulatory measurements of illuminance, significant correlations were only found between the ambulatory measurement of illuminance and the vertical illuminance at the position of the eye in the normal angle of gaze (r = 0.726, P = 0.002) and between the ambulatory measurement of illuminance and the average illuminance in the room (r = 0.590, P = 0.021) in the morning during the measurements in December/January.
Concerning the measurements of the spectral composition, the results showed high significant correlations between the two parameters used for static measurement of the spectral composition, measured horizontally in front of the subject at the normal working position and vertically at the position of the eye in the normal angle of gaze (r = 0.648–0.866 for the wavelength band between 400 and 550 nm, r = 0.807–0.819 for the wavelength band between 550 and 650 nm, and r = 0.789–0.896 for the wavelength band between 650 and 750 nm). However, during the morning in December, there were no significant correlations between irradiance measured at the position of the eye in the normal angle of gaze and irradiance measured horizontally at the normal working position for the wavelength bands 400–550 and 650–750 nm.
Furthermore, the results only showed three significant correlations between the static measurements of irradiance and the ambulatory measurements. In the morning in February/March, a significant correlation was found between the static measurement of irradiance at the position of the eye in the normal angle of gaze and the ambulatory measurements for the wavelength band 400–550 nm (r = 0.546, P = 0.044). The analysis showed a significant relationship between the static measurement of irradiance horizontally at the normal working position and the ambulatory measurements for the wavelength band 400–550 nm in the morning in June (r = 0.605, P = 0.022) and between the static measurement of irradiance horizontally at the normal working position and the ambulatory measurements for the wavelength band 400–550 in the morning in April/May (r = 0.501, P = 0.042).
Additionally, t-tests were used to investigate differences between static and ambulatory measurements. As can be seen in , concerning the comparisons of mean illuminance, t-tests showed no difference between the illuminances measured with the Actiwatch-L monitors and static recordings of illuminance at the position of the eye in the normal angle of gaze during seven of the 10 measurement times. Significant differences were, however, found in the afternoon during the measurements in April and during both measurements in December when the static measurements showed higher readings than the ambulatory measurements.
Table 5. Results from t-tests showing the comparison of means between the ambulatory measurements of illuminance (EAMB) and the static measurements of illuminance at the position of the eye (EVE), horizontally at the normal working position (EHN), and average illuminance in the room (EHR).
There was no significant difference between the static measurements of horizontal illuminance at the normal working position and the ambulatory measurements during three of the 10 measurements. Horizontal illuminance values at the normal working position and the ambulatory measurements were different in the morning in February/March, April/May, and June and during both morning and afternoon in September/October and December/January when the static measurements showed higher readings in comparison to the ambulatory measurements.
Furthermore, there was no significant difference between the static measurements of the average room illuminance and the ambulatory measurements during five of the 10 measurements. Static measurements of the average room illuminance and ambulatory measurements were different in the morning in February/March, June, and September/October and during both morning and afternoon in December/January when the static measurements showed higher readings in comparison to the ambulatory measurements.
Regarding the t-tests comparing the spectral composition of the visible irradiance, the results showed that the mean did not differ in six of the 30 measurements.
4. Discussion
Field measurements of the lighting conditions, with the subjects’ settings of artificial lighting and daylight controls, showed large variations in illuminances between different measurements, with both higher and lower values in comparison to illuminances that are generally recommended. The mean horizontal illuminance at the normal working position for the group slightly exceeded the illuminance values that generally are suggested as a value that should be maintained in offices, which is 500 lx [Swedish Standards Institute Citation2011].
The static field measurements of vertical illuminance at the position of the eye in the normal angle of gaze showed that subjects were normally not exposed to bright light, which generally is defined by an exposing illuminance of more than 1000 lx. In fact, more than a third of the measurements showed recordings of a vertical illuminance lower than 200 lx, and illuminances of 1000 lx or more were only recorded in 7% of the measurements.
Furthermore, static measurements of the spectral composition of light radiation in the offices showed that it was mainly composed of short and middle wavelength radiation, with only a small portion of long wavelength radiation. This indicates that to a large extent the subjects were exposed to light radiation from fluorescent lighting in addition to a lesser amount of daylight entering the room. It also indicates that the light radiation, although at a fairly low intensity, included relatively much radiation that can have non-image forming effects.
The ambulatory measurements, on the other hand, showed that the exposing light radiation was composed of less short wavelength and middle wavelength radiation and more long wavelength radiation in comparison to the static field measurements. The more even spectral energy distribution may be interpreted as a consequence of the ambulatory instruments receiving light that is more likely reflected off materials composed of organic dyes and pigments.
There are many differences between the static and ambulatory measurements that may explain the dissimilarities between the two methods of describing the lighting conditions to which office workers are normally exposed. The ambulatory measurements were recorded monthly every minute for 3 days during normal working behavior with natural changes in body position, whereas the static measurements were instantaneous recordings of the intensities at various fixed points and in fixed directions in the room. This may explain some of the differences between the two methods. Moreover, earlier field studies using ambulatory instruments have demonstrated large variability in light exposure between days and that the length of the measurement period also is of importance when estimating daily light exposure in the natural environment. For example, Cole et al. (Citation1995) showed that 1-day, 2-day, and 3-day recordings explained 50%–60%, 70%, and 80% of a 6-day measurement, respectively. This can explain why there were few significant correlations between the ambulatory measurements and the static measurements because the measurements were not necessarily conducted on the same day.
The three parameters included in the static measurements, horizontal illuminance at the normal working position, average illuminance in the room, and vertical illuminance at the position of the eye in the normal angle of gaze showed high significant correlations, which suggests that, for the settings in this study, they can all be used to assess the illuminance levels in the rooms. However, from the results of other studies comparing light exposure measured with different sensor positions and from the results of the analysis taken together, it appears that a static measurement of illuminance at the position of the eye in the normal angle of gaze is the most appropriate measure of the three parameters used in the static measurements of illuminance (Figueiro et al. Citation2013).
When measuring visible light radiation, it is important to consider the quality of the instruments—for example, spectral and spatial sensitivities—as well as how the placement of the sensor influences the measurements.
Concerning our data, there are some differences between the photopic luminous efficiency function, V (λ), and the spectral response of the Actiwatch-L monitor and differences between a cosine distribution and the spatial distribution of the instruments. Consequently, this influences the ambulatory measurements with respect to the seasonal variation of the angle between the sun and the horizon and the control of daylight because the use of horizontal blinds, in addition to changing the amount of daylight entering the room, changes the spatial distribution (that is, the relationship between vertically and horizontally distributed daylight).
One conclusion from the study is that there are large differences between a static measurement of illuminance and irradiance in a room and the luminous and radiant exposure measured with an ambulatory instrument. The limited number of static measurements of illuminance and spectral composition of the light carried out with the measurement protocol in this study does not appear to be sufficient to provide an adequate representation of the lighting conditions that a person is exposed to in the working environment. The t-tests comparing the means for the group of 15 subjects show a relationship between ambulatory measurements and static measurements of vertical illuminance at the eye in the normal angle of gaze, but the correlations that were carried out indicate that a higher resolution of static measurements may be needed in order to determine the light exposure for the individual subjects.
Based on results from earlier research, the ambulatory measurements should result in a more reliable estimate of a person’s actual radiant exposure due to the high resolution of the collected data (Cole et al. Citation1995). However, repeated static measurements of illuminance that are continuously recorded may result in higher correlations with the ambulatory measurements.
Furthermore, the results from the present study indicate that cardinal window directions, blind positions, weather conditions, settings of artificial lighting, and natural changes of position and body movements have a high impact on the light intensities that are measured in an office. These aspects should be further investigated in future studies.
The results from the static and ambulatory measurements of illuminance and irradiance also indicate that there may be a seasonal variation regarding the illuminance levels in the offices as well as a seasonal change in the spectral composition of the visible radiation. This should be addressed in future studies because it possibly has an impact on synchronization of the biological clock because many modern-day people work inside and also spend the majority of their waking day in illuminance levels commonly found indoors (Scheuermaier et al. Citation2010).
An ambulatory recording is still a quite crude measurement of the light radiation that reaches the photoreceptors. Individual differences in pupil diameter and the ocular media are some examples of important aspects that have to be accounted for when investigating the light radiation to which a person is exposed (Charman Citation2003). In addition, head position, orientation, and shading from the brow have major effects on the amount of light entering the eye (Van Derlofske et al. Citation2002).
Regarding the position of the sensor, some authors have showed good correlations between instruments with sensors placed at the wrist and at the forehead (Okudaira et al. Citation1983). On the other hand, in a study comparing different instruments for ambulatory measurements of personal exposure to visible light radiation, Figueiro et al. (Citation2013) found large differences when measuring absolute levels of photopic illuminance with a sensor located at the plane of the cornea and sensors located at the wrist. More specifically, there was better agreement between the measurements with sensors positioned at the cornea and sensors located on the torso or carried as a pendant hung from the neck.
In most field studies, exposure to light radiation has been investigated by measurement of exposing illuminance. As a result of increasing knowledge of the field, different models and sensitivity functions for estimating the non-image-forming effects of light radiation have been proposed, although recent findings provide a more complex picture of how light radiation of different intensities and spectral compositions affects the circadian systems of humans and other mammals (Al Enezi et al. Citation2011; Andersen et al. Citation2012; Bellia et al. Citation2011; Lucas et al. Citation2014; Rea et al. 2005, Citation2012).
By measuring the exposing irradiance at the cornea with a high resolution, it is possible to subsequently calculate the effects on different photoreceptor systems, depending on the intensity and spectral composition, after correcting for pupil diameter and the properties of the ocular media (Lucas et al. Citation2014). This also permits the collected data to be useful as knowledge of field develops and the complex interactions between the different systems will be further elucidated. It should also be noted that studies have shown a difference in intrinsically photosensitive retinal ganglion cells density on the retina, which also may influence the non-image-forming effects of exposures from light sources with different spatial distributions (Berson et al. Citation2002; Hattar et al. Citation2002; Rüger et al. Citation2005).
Finally, by using instruments that measure the complete spectrum of the radiant exposure together with the development of methods for practical and reliable measurement of biological markers in field studies, the real working and living environments where people are conducting their daily activities offer good possibilities for ecological validation of current models used for explaining the non-image-forming effects of light radiation as well as for generating new research questions that can be further studied in controlled laboratory experiments (Bonmati-Carrion et al. Citation2014; Figueiro and Rea Citation2016; Kolodyazhniy et al. Citation2012; Lucas et al. Citation2014; Miller et al. Citation2010).
More studies are needed in order to design protocols for measuring and calculating the lighting conditions in rooms and buildings with regard to the resulting non-image-forming effects.
Funding
The work was funded by grants from the Bertil and Britt Svenssons Foundation for Lighting Technology and the Scandinavia‐Japan Sasakawa Foundation.
Additional information
Funding
References
- Aan Het Rot M, Moskowitz DS, Young SN. 2008. Exposure to bright light is associated with positive social interaction and good mood over short time periods: a naturalistic study in mildly seasonal people. J Psychiat Res. 42(4):311–319. doi:10.1016/j.jpsychires.2006.11.010.
- Al Enezi J, Revell V, Brown T, Wynne J, Schlangen L, Lucas R. 2011. A “melanopic” spectral efficiency function predicts the sensitivity of melanopsin photoreceptors to polychromatic lights. J Biol Rhythm. 26(4):314–323. doi:10.1177/0748730411409719.
- Andersen M, Mardaljevic J, Lockley SW. 2012. A framework for predicting the non-visual effects of daylight—part I: photobiology-based model. Lighting Res Technol. 44(1):37–53. doi:10.1177/1477153511435961.
- Bailes HJ, Lucas RJ. 2013. Human Melanopsin forms a pigment maximally sensitive to blue light (λmax ~ 479 nm) supporting activation of gq/11 and gi/0 signalling cascades. Proc Biol Sci. 280(1759):20122987. doi:10.1098/rspb.2012.2987.
- Bellia L, Bisegna F, Spada G. 2011. Lighting in indoor environments: visual and non-visual effects of light sources with different spectral power distributions. Build Environ. 46(10):1984–1999. doi:10.3109/07420528.2013.820740.
- Berson DM, Dunn FA, Takao M. 2002. Phototransduction by retinal ganglion cells that set the circadian clock. Science. 295(5557):1070–1073. doi:10.1126/science.1067262.
- Bierman A, Klein TR, Rea MS. 2005. The Daysimeter: a device for measuring optical radiation as a stimulus for the human circadian system. Meas Sci Technol. 16(11):2292–2299. doi:10.1088/0957-0233/16/11/023.
- Bonmati-Carrion MA, Middleton B, Revell V, Skene DJ, Rol MA, Madrid JA. 2014. Circadian phase asessment by ambulatory monitoring in humans: correlation with dim light melatonin onset. Chronobiol Int. 31(1):37–51. doi:10.3109/07420528.2013.820740.
- Brainard GC, Hanifin JP, Greeson JM, Byrne B, Glickman G, Gerner E, Rollag MD. 2001. Action spectrum for melatonin regulation in humans: evidence for a novel circadian photoreceptor. J Neurosci. 21(16):6405–6412.
- Cajochen C, Zeitzer JM, Czeisler CA, Dijk DJ. 2000. Dose–response relationship for light intensity and ocular and electroencephalographic correlates of human alertness. Behav Brain Res. 115(1):75–83. doi:10.1016/S0166-4328(00)00236-9.
- Cambell S, Kripke DF, Gillin JC, Hrubovcak C. 1988. Exposure to light in healthy elderly subjects and Alzheimer’s patients. Physiol Behav. 42(2):141–144. doi:10.1016/0031-9384(88)90289-2.
- Chang AM, Santhi N, St. Hilaire M, Gronfier C, Bradstreet DS, Duffy JF, Lockley SW, Kronauer R, Czeisler CA. 2012. Human responses to bright light of different durations. J Physiol. 590(13):3103–3112. doi:10.1113/jphysiol.2011.226555.
- Chang AM, Scheer FAJL, Czeisler CA. 2011. The human circadian system adapts to prior photic history. J Physiol. 589(5):1095–1102. doi:10.1113/jphysiol.2010.201194.
- Chang AM, Scheer FAJL, Czeisler CA, Aeschbach D. 2013. Direct effects of light on alertness, vigilance, and the waking electroencephalogram in humans depend on prior light history. Sleep. 36(8):1239–1246. doi:10.5665/sleep.2894.
- Charman WN. 2003. Age, lens transmittance, and possible effects on melatonin suppression. Ophthal Physl Opt. 23(2):181–187. doi:10.1046/j.1475-1313.2003.00105.x.
- Cole RJ, Kripke DF, Wisbey J, Mason WJ, Gruen W, Hauri PJ, Juarez S. 1995. Seasonal variation in human illumination exposure at two different latitudes. J Biol Rhythm. 10(4):324–334. doi:10.1177/074873049501000406.
- Czeisler CA, Kronauer R, Allan JS, Duffy JF, Jewett M, Brown EN, Ronda JM. 1989. Bright light induction of strong (type 0) resetting of the human circadian pacemaker. Science. 244(4910):1328–1333. doi:10.1126/science.2734611.
- Dumont M, Benhaberou-Brun D, Paquet J. 2001. Profile of light exposure and circadian phase of melatonin secretion in night workers. J Biol Rhythm. 16(5):502–511. doi:10.1177/074873001129002178.
- Eastman CI. 1990. Natural summer and winter sunlight exposure patterns in seasonal affective disorder. Physiol Behav. 48(5):611–616. doi:10.1016/0031-9384(90)90199-E.
- Espiritu RC, Kripke DF, Anconi-Israel S, Mowen MA, Mason WJ, Fell RL, Klauber MR, Kaplan OJ. 1994. Low illumination experienced by San Diego adults: association with atypical depressive symptoms. Biol Psychiat. 35(6):403–407. doi:10.1016/0006-3223(94)90007-8.
- Figueiro MG, Hamner R, Bierman A, Rea MS. 2013. Comparison of three practical devices used to measure personal light exposures and activity levels. Lighting Res Technol. 45(4):421–434. doi:10.1177/1477153512450453.
- Figueiro MG, Rea MS. 2010. Evening daylight may cause adolescents to sleep less in spring than in winter. Chronobiol Int. 27(6):1242–1258. doi:10.3109/07420528.2010.487965.
- Figueiro MG, Rea MS. 2016. Office lighting and personal light exposures in two seasons: impact on sleep and mood. Lighting Res Technol. 48(3):352–364. doi:10.1177/1477153514564098.
- Girardin JL, Kripke DF, Ancoli-Israel S, Klauber MR, Sepulveda RS, Mowen MA, Assmus JD, Langer RD. 2000. Circadian sleep, illumination, and activity patterns in women: influence of aging and time reference. Physiol Behav. 68(3):347–352. doi:10.1016/S0031-9384(99)00186-9.
- Gooley JJ, Mien IH, St. Hilaire MA, Yeo SC, Chua ECP, Van Reen E, Hanley CJ, Hull JT, Czeisler CA, Lockley SW. 2012. Melanopsin and rod–cone photoreceptors play different roles in mediating pupillary light responses during exposure to continuous light in humans. J Neurosci. 32(41):14242–14253. doi:10.1523/JNEUROSCI.1321-12.2012.
- Gooley JJ, Rajaratnam SMW, Brainard GC, Kronauer RE, Czeisler CA, Lockley SW. 2010. Spectral responses of the human circadian system depend on the irradiance and duration of exposure to light. Sci Transl Med. 2(31):31ra33. doi:10.1126/scitranslmed.3000741.
- Goulet G, Mongrain V, Desrosiers C, Paquet J, Dumont M. 2007. Daily light exposure in morning-type and evening type individuals. J Biol Rhythm. 22(2):151–158. doi:10.1177/0748730406297780.
- Grandner M, Kripke DF, Langer RD. 2006. Light exposure is related to social and emotional functioning and to quality of life in older women. Psychiat Res. 143(1):35–42. doi:10.1016/j.psychres.2005.08.018.
- Graw P, Recker S, Sand L, Kräuchi K, Wirz-Justice A. 1999. Winter and summer outdoor exposure in women with and without seasonal affective disorder. J Affect Disorders. 56(2–3):163–169. doi:10.1016/S0165-0327(99)00037-3.
- Gronfier C, Wright KW, Kronauer RE, Jewett ME, Czeisler CA. 2004. Efficacy of a single sequence of intermittent bright light pulses for delaying circadian phase in humans. Am J Physiol-Endoc M. 287:174–181. doi:10.1152/ajpendo.00385.2003.
- Guillemette J, Hébert M, Paquet J, Dumont M. 1998. Natural bright light exposure in the summer and winter in subjects with and without complaints of seasonal mood variations. Biol Psychiat. 44(7):622–628. doi:10.1016/S0006-3223(97)00543-X.
- Hattar S, Liao HW, Takao M, Berson DM, Yau KW. 2002. Melanopsin-containing retinal ganglion cells: architecture, projections, and intrinsic photosensitivity. Science. 295(5557):1065–1070. doi:10.1126/science.1069609.
- Hébert M, Dumont M, Paquet J. 1998. Seasonal and diurnal patterns of human illumination under natural conditions. Chronobiol Int. 15(1):59–70. doi:10.3109/07420529808998670.
- Hébert M, Martin SK, Lee C, Eastman CI. 2002. The effects of prior light history on the suppression of melatonin by light in humans. J Pineal Res. 33(4):198–203. doi:10.1034/j.1600-079X.2002.01885.x.
- Higushi S, Motohashi Y, Ishibashi K, Maeda T. 2007. Less exposure to daily ambient light in the winter increases sensitivity of melatonin to light suppression. Chronobiol Int. 24(1):31–43. doi:10.1080/07420520601139805.
- Hubalek S, Brink M, Schierz C. 2010. Office worker’s daily exposure to light and its influence on sleep quality and mood. Lighting Res Technol. 42(1):33–50. doi:10.1177/1477153509355632.
- Kawinska A, Dumont M, Selmaoui B, Paquet J, Carrier J. 2005. Are modifications of melatonin circadian rhythm in the middle years of life related to habitual patterns of light exposure? J Biol Rhythm. 20(5):451–460. doi:10.1177/0748730405280248.
- Khalsa SBS, Jewett M, Cajochen C, Czeisler CA. 2003. A phase response curve to single bright light pulses in human subjects. J Physiol. 549(3):945–952. doi:10.1113/jphysiol.2003.040477.
- Koldyazhniy V, Späti J, Götz T, Wirz-Justice A, Kräuchi K, Cajochen C, Wilhelm FH. 2012. An improved method for estimating human circadian phase derived from multichannel ambulatory monitoring and artificial neural networks. Chronobiol Int. 29(8):1078–1097. doi:10.3109/07420528.2012.700669.
- Kripke DF, Elliot JA, Youngstedt SD, Rex KM. 2007. Circadian phase response curves to light in older and young women and men. Journal of Circadian Rhythms. 5(4):1–13. doi:10.1186/1740-3391-5-4.
- Lall GS, Revell VL, Mormiji H, Al Enize J, Altimus CM, Güler AD, Aguilar C, Cameron MA, Allender S, Hankins MW, et al. 2010. Distinct contributions of rod, cone and melanopsin photoreceptors to encoding irradiance. Neuron. 66(3):417–428. doi:10.1016/j.neuron.2010.04.037.
- Lucas RJ, Peirson SN, Berson DM, Brown TM, Cooper HM, Czeisler CA, Figueiro MG, Gamlin PD, Lockley SW, O’Hagan JB, et al. 2014. Measuring and using light in the melanopsin age. Trends Neurosci. 37(1):1–9. doi:10.1016/j.tins.2013.10.004.
- Miller D, Bierman A, Figueiro MS, Shernhammer ES, Rea M. 2010. Ecological measurement of light exposure, activity and circadian disruption. Lighting Res Technol. 42(3):271–284. doi:10.1177/1477153510367977.
- Michima K, Okawa M, Shimizu T, Hishikawa Y. 2001. Diminished melatonin secretion in the elderly caused by insufficient environmental illumination. J Clin Endocrinol Metab86(1):129–134.
- Morita T, Koikawa R, Ono K, Terada Y, Hyun K, Tokura H. 2002. Influence of the amount of light received during the day and night times on the circadian rhythm of melatonin secretion in women living diurnally. Biol Rhythm Res. 33(3):271–277. doi:10.1076/brhm.33.3.271.8258.
- Okudaira N, Kripke DF, Webster JB. 1983. Naturalistic studies of human light exposure. Am J Physiol. 245(4):613–615.
- Park DH, Kripke DF, Cole RJ. 2007. More prominent reactivity in mood than activity and sleep induced by differential light exposure due to seasonal and local differences. Chronobiol Int. 24(5):905–920. doi:10.1080/07420520701669677.
- Rea MS, Figueiro MG, Bierman A, Hamner R. 2012. Modeling the spectral sensitivity of the human circadian system. Lighting Res Technol. 44(4):386–396. doi:10.1177/1477153511430474.
- Rea MS, Figueiro MG, Bullough JD, Bierman A. 2005. A model of phototransduction by the human circadian system. Brain Res Rev. 50(2):213–228. doi:10.1016/j.brainresrev.2005.07.002.
- Revell V, Molina TA, Eastman CI. 2012. Human phase response curve to intermittent blue light using a commercially available device. J Physiol. 590(19):4859–4868. doi:10.1113/jphysiol.2012.235416.
- Rimmer DW, Boivin DB, Shanahan TL, Kronauer RE, Duffy JF, Czeisler CA. 2000. Dynamic resetting of the human circadian pacemaker by intermittent bright light. Am J Physiol-Regul I. 279:1574–1579.
- Rufiange M, Lachapelle P, Dumont M. 2003. Effect of long-term light exposure on retinal and circadian light sensitivity of outdoor and indoor workers. Chronobiol Int. 20(6):1159–1160.
- Rüger M, Gordijn MCM, Beersma DGM, De Vries B, Daan S. 2005. Nasal versus temporal illumination of the human retina: effects on core body temperature, melatonin, and circadian phase. J Biol Rhythm. 20(1):60–70. doi:10.1177/0748730404270539.
- Rüger M, St. Hilaire MA, Brainard GC, Khalsa SBS, Kronauer RE, Czeisler CA, Lockley SW. 2013. Human phase response curve to a single 6.5h pulse of short-wavelength light. J Physiol. 591(1):353–363. doi:10.1113/jphysiol.2012.239046.
- Savides TJ, Messin S, Senger C, Kripke DF. 1986. Natural light exposure of young adults. Physiol Behav. 38(4):571–574. doi:10.1016/0031-9384(86)90427-0.
- Scheuermaier K, Laffan AM, Duffy JF. 2010. Light exposure patterns in healthy older and young adults. J Biol Rhythm. 25(2):113–122. doi:10.1177/0748730410361916.
- Shochat T, Martin J, Marler M, Ancoli-Israeel S. 2000. Illumination levels in nursing home patients: effects on sleep and activity rhythms. J Sleep Res. 9(4):373–379. doi:10.1046/j.1365-2869.2000.00221.x.
- Smith KA, Schoen MW, Czeisler CA. 2004. Adaption of human pineal melatonin suppression by recent photic history. J Endocrinol Metab. 89(7):3610–3614. doi:10.1210/jc.2003-032100.
- St. Hilaire MA, Gooley JJ, Khalsa SBS, Kronauer RE, Czeisler CA, Lockley SW. 2012. Human phase response curve to a 1h pulse of bright light. J Physiol. 590(13):3035–3045. doi:10.1113/jphysiol.2012.227892.
- Staples VSL, Archer SN, Arber S, Skene DJ. 2009. Daily light exposure profiles in older non-resident extreme morning and evening types. J Sleep Res. 18(4):466–471. doi:10.1111/j.1365-2869.2009.00762.x.
- Swedish Standards Institute. 2011. SS-EN 12464-1:2011 Edition 2, Light and Lighting- Lighting of workplaces – Part 1: Indoor workplaces. Stockholm (Sweden): SIS Förlag AB. 72 p. 12464–1:2011.
- Thapan K, Arendt J, Skene DJ. 2001. An action spectrum for melatonin suppression: evidence for a novel non-rod, none-cone photoreceptor system in humans. J Physiol. 535(1):261–267. doi:10.1111/j.1469-7793.2001.t01-1-00261.x.
- Thorne HC, Jones KH, Peters SP, Archer SM, Dijk DJ. 2009. Daily and seasonal variation in the spectral composition of light exposure in humans. Chronobiol Int. 26(5):854–866. doi:10.1080/07420520903044315.
- Ueno-Towatari T, Norimatsu K, Blazejczyk K, Tokura H, Morita T. 2007. Seasonal variation of Melatonin secretion in young females under natural and artificial light conditions in Fukuoka. J Physiol Anthropol. 26(2):209–215. doi:10.2114/jpa2.26.209.
- Van Derlofske J, Bierman A, Rea MS, Ramanth J, Bullough JD. 2002. Design and optimization of a retinal flux density meter. Meas Sci Technol. 13(6):821–828. doi:10.1088/0957-0233/13/6/301.
- Wehr TA, Giesen HA, Moul DE, Turner EH, Schwarts PJ. 1995. Suppression of men’s responses to seasonal changes in day length by modern artificial lighting. Am J Physiol. 269:173–178.
- Zaidi FH, Hull JT, Peirson SN, Wulff K, Aeschbach D, Gooley JJ, Brainard GC, Gregory-Evans K, Rizzo JF III, Czeisler CA, et al. 2007. Short-wavelength light sensitivity of circadian, pupillary, and visual awareness in humans lacking an outer retina. Curr Biol. 17(24):2122–2128. doi:10.1016/j.cub.2007.11.034.
- Zeitzer JM, Dijk DJ, Kronauer RE, Brown EN, Czeisler CA. 2000. Sensitivity of the human circadian pacemaker to nocturnal light: melatonin phase resetting and suppression. J Physiol. 526(3):695–702. doi:10.1111/j.1469-7793.2000.00695.x.