
ABSTRACT
Nucleus pulposus (NP) cells reside in the avascular and hypoxic microenvironment of intervertebral discs. Importantly, many activities related to survival and function of NP cells are controlled by the HIF-family of transcription factors. We hypothesize that NP cells adapt to their hypoxic niche through modulation of macroautophagy/autophagy. In various cell types, hypoxia induces autophagy in a HIF1A-dependent fashion; however, little is known about hypoxic regulation of autophagy in NP cells. Hypoxia increases the number of autophagosomes as seen by TEM analysis and LC3-positive puncta in NP cells. Hypoxic induction of autophagy was also demonstrated by a significantly higher number of autophagosomes and smaller change in autolysosomes in NP cells expressing tandem-mCherry-EGFP-LC3B. Increased LC3-II levels were not accompanied by a concomitant increase in BECN1 or the ATG12–ATG5 complex. In addition, ULK1 phosphorylation at Ser757 and Ser777 responsive to MTOR and AMPK, respectively, was not affected in hypoxia. Interestingly, when MTOR activity was inhibited by rapamycin or Torin1, LC3-II levels did not change, suggesting a novel MTOR-independent regulation. Noteworthy, while silencing of HIF1A affected hypoxic induction of BNIP3, it did not affect LC3-II levels, indicating hypoxia-induced autophagy is HIF1-independent. Importantly, there was no change in the number of LC3-positive autophagosomes in NP-specific Hif1a null mice. Finally, inhibition of autophagic flux did not affect the glycolytic metabolism of NP cells, suggesting a possible nonmetabolic role of autophagy. Taken together, our study for the first time shows that NP cells regulate autophagy in a noncanonical fashion independent of MTOR and HIF1A signaling.
Introduction
The intervertebral disc (IVD) contains ACAN (aggrecan)-rich, gel-like NP in the center, and surrounding COL1A/collagen I-rich annulus fibrosus bordered superiorly and inferiorly by cartilagenous endplates. Due to the abundance of the highly charged proteoglycan ACAN, NP tissue is highly hydrated with elevated swelling pressure allowing it to serve as a shock absorber in the spine.Citation1 NP is also a completely aneural and avascular tissue; hence the microenvironment is physiologically hypoxic.Citation2-5 NP cells adapt to this hypoxic niche by modulating a key transcription factor, HIF1A (hypoxia inducible factor 1 α subunit), to promote cell survival, matrix synthesis, and to regulate glycolytic metabolism.Citation6-13 A recent study using NP-specific conditional Hif1a knockout mice also shows that HIF1A is required for postnatal NP cell survival in vivo.Citation14
Autophagy is a highly conserved cellular process where organelles and cytosolic proteins are encapsulated within double-membraned autophagosomes that ultimately fuse with lysosomes for degradation.Citation15,16 However, an increasing number of studies have also shown that in addition to these conventional functions, autophagy contributes to secretion of molecules and biogenesis of organelles.Citation17-19 Various stimuli and stressors can trigger autophagy, including but not limited to low oxygen tension,Citation20 amino acid or glucose deprivation,Citation21,22 and pathogens.Citation23 In many cell types, hypoxia induces autophagy as a mechanism of protection and survival.Citation20,24-27 Importantly, HIF1A controls hypoxia-induced autophagy by upregulating its targets BNIP3 and BNIP3L, which hinder interaction between BCL2 and BECN1/Beclin 1, one of the key autophagy-related proteins. This decreased interaction between BCL2 and BECN1 results in increased availability of BECN1 for phosphorylation and subsequent induction of autophagy.Citation24,28 Another major autophagy regulating factor is lack of nutrients, which causes inactivation of MTOR (mechanistic target of rapamycin [serine/threonine kinase]) resulting in increased autophagy.Citation21 In a nutrient- abundant status, active MTOR complex 1 (MTORC1) phosphorylates ULK1 (unc51-like autophagy activating kinase 1) and disrupts association between ULK1 and AMPK. However, when cells are starved, MTORC1 phosphorylation of ULK1 is reduced, and phosphorylation of ULK1 by AMPK initiates a canonical autophagic process. Conventional autophagy involves formation of autophagosomes from the ER or Golgi apparatus through multiple steps including ULK1-dependent initiation, BECN1-phosphatidylinositol 3-kinsase-dependent nucleation, ATG12–ATG5 complex and LC3-II-dependent elongation, and closure.Citation16,29,30 LC3 (yeast Atg8) exists in 2 forms: unconjugated cytosolic LC3-I and lipid-conjugated membrane-bound LC3-II. With induction of autophagy, LC3 is conjugated with phosphatidylethanolamine (PE) and is incorporated into both the convex and concave membrane of the phagophore, the precursor to the autophagosome. Along with the degradation of internal materials after the autophagosome fuses with a lysosome in the canonical autophagic pathway, LC3-II (LC3–PE) bound to the internal autophagosomal membrane, is also degraded. Therefore, levels of LC3-II are commonly used to monitor the autophagic process.Citation31 Similarly, SQSTM1/p62 is used in some cell types to monitor autophagy because of its role in delivering cargo destined for degredation to the phagophore through directly binding to LC3.Citation32
With aging and degeneration, NP tissue undergoes structural changes including gradual loss and degradation of proteoglycan-rich extracellular matrix, and ingrowth of neural and vascular structure along fissures in the outer annulus fibrosus.Citation1,33,36 Not surprisingly, changes in autophagy have also been associated with disc degeneration. Although the causative relationship between disc degeneration and autophagy is not yet clear, alterations in the level of autophagy have been observed in degenerated IVDs, IVDs of aged or diabetic ratsCitation37-39 and NP cells derived from degenerative human discs.Citation40 In addition, various stresses such as high glucose,Citation41,42 aberrant mechanical compression,Citation43 lactate overload,Citation44 glucosamine,Citation45 and reactive oxygen species (ROS),Citation43 activate autophagy in NP cells, further implicating autophagy modulation as a possible contributor to disc pathologies. However, studies investigating the mechanisms of how basal autophagy is controlled in NP cells and the role of physiological stimuli in this process are mostly lacking. We therefore, studied how autophagy is regulated in NP cells by hypoxia, a physiological niche condition. Our studies for the first time show that hypoxia induces a novel autophagic pathway in NP cells independently of HIF1A. In addition, we report that regulation of this autophagy in NP cells is through an MTOR-ULK independent, noncanonical pathway.
Results
Hypoxia increases the number of autophagosomes in NP cells
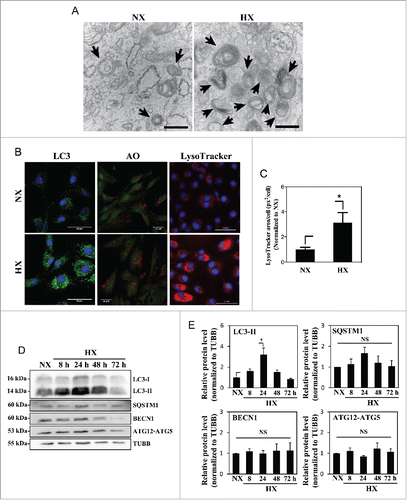
In order to assess the effect of hypoxia on autophagy, NP cells were cultured in either normoxia (21% pO2) or hypoxia (1% pO2) for 24 h, and the autophagic process was visualized using transmission electron microscopy (TEM) (). The presence of double-membrane autophagosomes as well as autolysosomes at various stages of degradation was confirmed in cells under both normoxia and hypoxia. Autophagosomes with multilayered structures have been described in other cell types under certain conditions,Citation31,46,47 although their contents and functions are not yet fully elucidated. NP cells cultured under hypoxia showed more autophagic vacuoles than those cultured in normoxia. NP cells cultured in normoxia or hypoxia for 24 h were also stained with acridine orange and LysoTracker Red to label acidic compartments (). The number of acridine orange-positive vacuoles significantly increased in cells cultured in hypoxia. Similarly, a higher number of LysoTracker Red-labeled vacuoles was seen in cells under hypoxia (). Since both acridine orange and LysoTracker Red labeled all acidic organelles such as lysosomes, and excluded autophagosomes that were not fused with lysosomes, we measured levels of autophagy-related proteins to confirm autophagy-specific effect of hypoxia. Immunofluorescence confocal microscopy demonstrated an increased number of LC3-positive puncta in hypoxia-cultured NP cells, confirming an increased number of autophagosomes in hypoxia (). Moreover, western blot analysis of NP cells cultured in hypoxia showed a significant accumulation of lipid-conjugated LC3-II at 24 h, with a trend of accumulation at 8 h and 48 h (). Conversely, protein levels of other classical autophagy-related proteins, BECN1, SQSTM1, and the ATG12–ATG5 complex were unaffected by hypoxia ().
Figure 1. Hypoxia increases the number of acidic puncta and autophagosomes in nucleus pulposus (NP) cells. (A) Transmission electron microscopy images of primary NP cells cultured under normoxia (NX, 21% pO2) or hypoxia (HX, 1% pO2) for 24 h show multiple double-membrane enclosed autophagosomes (arrow); an increased number in hypoxia is observed. Scale bar: 500 nm. (B) Left panel: Immunofluorescence image of endogenous LC3 in NP cells shows increased LC3 puncta following 24 h in hypoxia. Scale bar: 50 μm. Middle panel: Acridine orange staining of NP cells shows cells cultured for 24 h in hypoxia have more acidic organelles (red signal). Scale bar: 35 μm. Right panel: LysoTracker® Red DND-99 staining of NP cells shows increased red staining after 24 h hypoxic culture. Scale bar: 50 μm. (C) Quantification of LysoTracker staining (red) as puncta area (px2)/cell using ImageJ software confirms increased acidic organelles under hypoxia. At least 427 cells per group were used for quantification analysis. (D) Western blot analysis of NP cells cultured under hypoxia for 8–72 h demonstrates accumulation of LC3-II protein at 8–48 h in hypoxia. (E) Densitometric analysis of multiple independent experiments as shown in the western blot confirms significant accumulation of LC3-II at 24 h hypoxia with an upward trend at both 8 and 48 h. Densitometric analysis of other autophagy-related proteins indicates that hypoxia does not influence levels of SQSTM1, BECN1, or the ATG12–ATG5 complex. Values shown are mean ± SE from at least 3 independent experiments. NS, nonsignificant; *, p < 0.05.
Hypoxia induces autophagosome formation without affecting autophagic flux
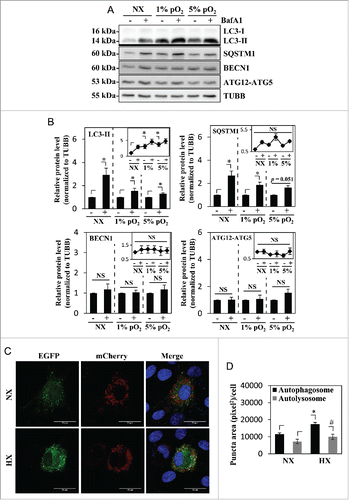
We then investigated whether hypoxia affects both initiation of autophagy as well as the flux/rate of degradation in NP cells. For this purpose, cells were treated with bafilomycin A1 for 2 h under normoxia (21% pO2) or hypoxia (1% pO2 or 5% pO2) to block lysosomal degradation, the penultimate step of the autophagic pathway. As expected, 5% pO2 also showed a similar accumulation of LC3-II as seen under 1% pO2 (). Regardless of the oxemic tension, bafilomycin A1 treatment resulted in further accumulation of LC3-II compared to nontreated controls indicating that active autophagic flux is occurring under both conditions (). The level of SQSTM1 also further increased with bafilomycin A1 treatment in both normoxia and hypoxia (). Again, we did not observe any difference in the levels of BECN1 or ATG12–ATG5 between the control and the bafilomycin A1-treated groups (). To further characterize the flux, we visualized the autophagosome:autolysosome ratio using a tandem mCherry-EGFP-LC3 construct. NP cells were stably transduced with the retrovirus expressing the tandem mCherry-EGFP-LC3 plasmid and cultured under hypoxia (1% pO2) or normoxia for 24 h, and the numbers of autophagosomes and autolysosomes were assessed. The number of green-red (yellow) puncta, representing autophagosomes was significantly increased in hypoxia (). The number of red-only puncta, representing autolysosomes, also showed a small but statistically significant increase ().
Figure 2. Hypoxia induces autophagy in NP cells without affecting its flux. (A) Western blot analysis of NP cells cultured in normoxia (NX) or hypoxia (1% and 5% pO2) with or without bafilomycin A1. Cells show accumulation of LC3-II under hypoxia, and further accumulation with bafilomycin A1 treatment confirms the presence of active flux under all culture conditions. (B) Densitometric analysis of multiple western blot experiments represented as both bar graphs and line graphs. Bar graph shows densitometry data normalized to respective untreated control group under each of the oxygen tensions. Inset line graph represents all densitometry data normalized to untreated normoxia control. Densitometric analysis confirms hypoxic accumulation of LC3-II. Both LC3-II and SQSTM1 further accumulated with bafilomycin A1, while no change was seen in the protein levels of BECN1 and the ATG12–ATG5 complex by hypoxia or bafilomycin A1. (C) NP cells transduced with retrovirus expressing a tandem EGFP-mCherry-LC3B construct cultured under either normoxia or hypoxia (HX) show autophagosomes in green-yellow and autolysosomes in red. Scale bar: 25 μm. The number of green-yellow puncta significantly increased under hypoxia, while the number of red-only puncta is more or less similar between normoxia and hypoxia. (D) Quantification of puncta area per cell using Colocalization Plugin of ImageJ software confirms significantly increased formation of autophagosomes with a relatively smaller change in autolysosomes. At least 48 cells per group were used for quantification analysis. Values shown are mean ± SE from at least 3 independent experiments. NS, nonsignificant; *, #, p < 0.05.
Autophagy in NP cells is independent of the MTOR-AMPK-ULK1 pathway
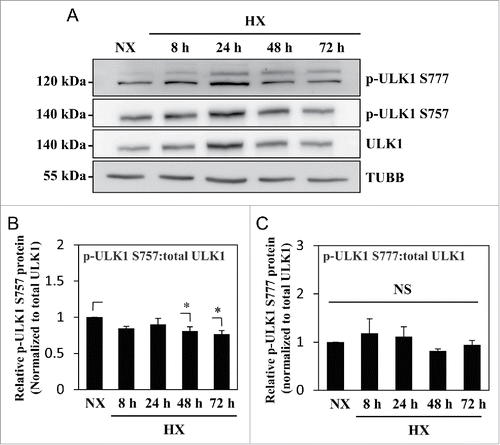
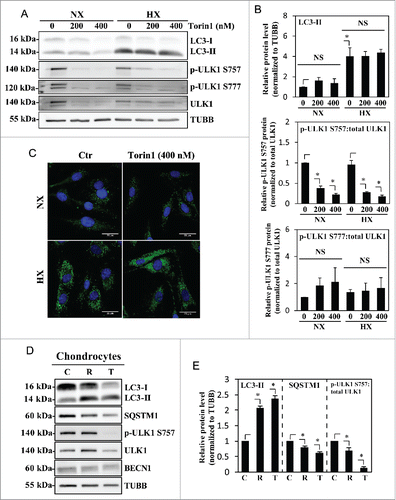
MTOR is a well-known upstream regulator of autophagy as it phosphorylates ULK1 on Ser757, which hinders ULK1 association with AMPK, and therefore inhibits autophagy induction.Citation48 In order to assess whether induction of autophagy in hypoxia is through regulation of ULK1 activity by MTOR, ULK1 phosphorylation was assessed under hypoxic conditions. Interestingly, the ratio of phosphorylated (p)-ULK1 Ser757 to total ULK1 stayed constant until 24 h in hypoxia; a small but significant decrease was seen at 48 h and 72 h in hypoxia (). Furthermore, the ratio of p-ULK1 Ser777 to total ULK1, an indicator of activating phosphorylation by AMPK, did not change in hypoxia (). These results, in conjunction with corresponding changes in LC3-II levels, suggested that in spite of its effect on autophagy modulation, hypoxia had minimal effect on MTOR and AMPK regulation of ULK1 in NP cells.
Figure 3. MTOR- and AMPK-dependent phosphorylation of ULK1 is unaffected by hypoxia. (A) Western blot analysis of NP cells cultured under normoxia (NX) or hypoxia (HX) for 8–72 h shows that the levels of p-ULK1 at Ser777 or Ser757 do not change with hypoxic culture. (B) Densitometric analysis of p-ULK1 Ser757 normalized to total ULK1 confirms MTOR-dependent ULK1 phosphorylation is unaltered under hypoxia until 24 h with very small decrease at 48 and 72 h. (C) p-ULK1 Ser777 level normalized to total ULK1 under hypoxia remains the same confirming AMPK phosphorylation of ULK1 is unaffected by hypoxia. Values shown are mean ± SE from at least 3 independent experiments. NS, nonsignificant; *, p < 0.05.
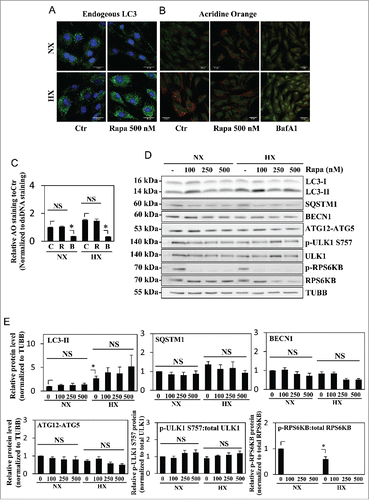
In order to further confirm MTOR independence of the autophagic process in NP, cells were treated with increasing doses of rapamycin (100–500 nM), a classical autophagy inducer through MTORC1 inhibition, and the level of autophagy was measured. Acridine orange staining () showed no change with rapamycin treatment. Regardless of the dosage, rapamycin was not able to significantly change the level of LC3-II under both normoxia and hypoxia (). Rapamycin treatment also did not alter the levels of SQSTM1, BECN1, and the ATG12–ATG5 complex (). Furthermore, MTOR phosphorylation on Ser757 of ULK1 was unaffected by rapamycin treatment, suggesting its inability to modulate MTORC1 activity essential for autophagy (). Interestingly however, rapamycin even at the lowest dosage of 100 nM was able to completely inhibit MTOR phosphorylation of RPS6KB/p70S6K, another classical MTOR target unrelated to the autophagic pathway, suggesting that the concentration of rapamycin used in our studies was not limiting ().
Figure 4. Autophagy in NP cells is unaffected by rapamycin treatment. (A) Immunofluorescence staining of endogenous LC3 in NP cells cultured under normoxia (NX) or hypoxia (HX), with or without rapamycin (500 nM) treatment shows hypoxia but not rapamycin increases LC3-positive puncta. Scale bar: 25 μm. (B) Acridine orange staining of NP cells shows increase in acidic puncta under hypoxia; no further increase is seen with rapamycin treatment. Scale bar: 35 μm. (C) Quantification of acridine orange signal (red) normalized to double-strand DNA signal (green) confirms there is no change in number of acidic compartments in NP cells treated with rapamycin. Bafilomycin A1 treatment, which inhibits acidification of lysosomes, was used as a negative control. (D) Western blot analysis of NP cells in either normoxia or hypoxia treated with an increasing dose of rapamycin (100, 250, 500 nM) shows no further increase of LC3-II with rapamycin treatment at all 3 doses. Similarly, levels of SQSTM1, BECN1, and ATG12–ATG5 are unaffected by rapamycin treatment. In addition, rapamycin does not change phosphorylation of ULK1 at Ser757, while completely abolishing phosphorylation of RPS6KB/p70S6K. (E) Densitometric analysis of multiple independent experiments confirms the western blot data. Values shown are mean ± SE from at least 3 independent experiments. NS, nonsignificant; Ctr, control; Rapa, rapamycin; BafA1, bafilomycin A1; *, p < 0.05.
Since rapamycin modulation of autophagy is somewhat cell type-specific due to its allosteric mode of MTOR inhibition,Citation49 we treated NP cells with Torin1, a catalytic MTOR inhibitor, at 2 different doses. To our surprise, even though Torin1 is reported to be a more specific and effective autophagy inducer than rapamycin,Citation50 NP cells in normoxia treated with Torin1 (200–400 nM) could not recapitulate the hypoxia-dependent induction of autophagy (). Likewise, Torin1 treatment in hypoxia did not further increase the levels of LC3-II (). Importantly, Torin1 significantly decreased ULK1 phosphorylation on Ser757, confirming that inhibition of MTOR activity had no appreciable effect on autophagy in NP cells (). Similarly, the ratio of p-ULK1 Ser777 to total ULK1 with Torin1 treatment also did not show any appreciable change demonstrating the inability of Torin1 to affect the autophagic pathway (). In contrast to NP cells, in chondrocytes, both rapamycin and Torin1 treatment resulted in the accumulation of LC3-II and a concurrent decrease in SQSTM1, confirming the cell type-specificity of this autophagic process (). As expected, Torin1 and rapamycin decreased MTOR phosphorylation of ULK1 at Ser757, confirming the MTOR-dependency of autophagy modulation in chondrocytes. Similar to NP cells, BECN1 levels did not change with MTOR inhibition ().
Figure 5. Autophagy in NP cells is regulated in an MTOR-independent fashion. (A) Western blot analysis of NP cells cultured under normoxia (NX) or hypoxia (HX) for 24 h, with or without Torin1 (200, 400 nM). LC3-II level is increased by hypoxia, but unaffected by Torin1 treatment. The p-ULK1 Ser757 level is significantly reduced with Torin1 treatment, confirming MTOR-dependent phosphorylation of ULK1 is successfully inhibited. The level of p-ULK1 Ser777 as well as total ULK1 is also reduced by Torin1, indicating Torin1 also affects MTOR function in protein synthesis. (B) Densitometric analysis of multiple independent western blot experiments confirms that inhibition of MTOR-dependent phosphorylation of ULK1 has no effect on LC3-II levels under both normoxia and hypoxia. (C) Immunofluorescence staining of endogenous LC3 demonstrates Torin1 has no effect on the number of LC3-positive autophagosomes in NP cells. Scale bar: 25 μm. (D) Western blot analysis of chondrocytes treated with either rapamycin (500 nM) or Torin1 (400 nM) for 6 h demonstrates increased LC3-II levels and concurrent decreased SQSTM1 levels. Both rapamycin and Torin1 blocked MTOR phosphorylation of ULK1 at Ser757. (E) Densitometric analysis of multiple independent western blot experiments confirms that modulation of MTOR activity alters the level of autophagy in chondrocytes. All the quantitative data are represented as mean ± SE from at least 3 independent experiments. NS, nonsignificant, Ctr/C, control; R, rapamycin; T, Torin1; *, p < 0.05.
Hypoxic induction of autophagy in NP cells is independent of oxidative stress and HIF1 signaling
Because some reports have implicated increased oxidative stress as an inducer of autophagy,Citation51,52 we first determined if this was the case for hypoxia-mediated induction of autophagy in NP cells. For this purpose, we measured the NADP+:NADPH ratio as a surrogate measure of ROS-mediated oxidative stress (Fig. S1). The results clearly showed that the NADP+:NADPH ratio was lower in hypoxia, indicating decreased ROS generation. In addition, we measured whether in NP cells hypoxia altered the expression levels of ATG4, which is involved in modulation of LC3–PE conjugation in response to oxidative stress (Fig. S2).Citation52 It was evident that the levels of ATG4 remained unchanged under hypoxia.
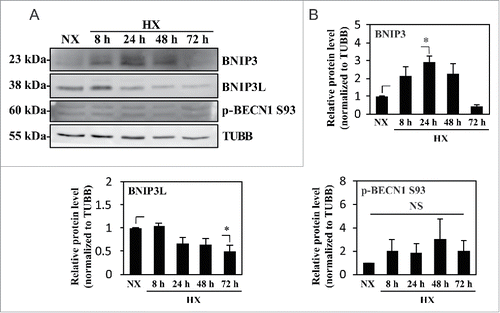
Several studies have shown that hypoxic induction of autophagy is HIF1A dependent; HIF1 induction of BNIP3 and BNIP3L, and the subsequent release and phosphorylation of BECN1, is one such mechanism.Citation20,24,27 We therefore measured the levels of BNIP3 and BNIP3L in NP cells cultured in hypoxia. Although BNIP3 was upregulated, the level of BNIP3L remained largely unaffected under hypoxia (). Importantly, under hypoxia, the level of p-BECN1 Ser93, a target of AMPK for activation of autophagy, did not change, suggesting that the level of BNIP3 did not correlate with the activation status of BECN1 and thus autophagic induction ().
Figure 6. Hypoxic induction of BNIP3 does not correlate with the activation status of BECN1. (A) Western blot analysis of NP cells cultured under normoxia (NX) or hypoxia (HX) for 8–72 h shows that the BNIP3 level significantly increases by 24 h in hypoxia. BNIP3L level as well as p-BECN1 Ser93 did not change under hypoxia. (B) Densitometric analysis of western blot confirms hypoxic induction of BNIP3, peaking at 24 h. In contrast, the BNIP3L level remains relatively constant in hypoxia except for a small decrease at 72 h. Additionally, the level of p-BECN1 Ser93 is not affected under hypoxia, indicating a lack of correlation between BNIP3 and activation status of BECN1. All the quantitative data are represented as mean ± SE from at least 3 independent experiments. NS, nonsignificant; *, p < 0.05.
Relevant to this study, it is important to note that HIF1A is essential for maintaining the survival of NP cells.Citation14 We therefore investigated if HIF1A controls hypoxic induction of autophagy in NP cells possibly through a BNIP3- and BNIP3L-independent mechanism. NP cells were transduced with a lentivirus co-expressing YFP along with ShCTR or ShHIF1A to stably suppress HIF1A expression. At least 70–80% transduction efficiency was confirmed with YFP expression by the transduced cells (). Transduced cells were cultured under normoxia or hypoxia for 24 h, and the knockdown was confirmed by HIF1A western blot and corresponding densitometry (). Of note, in HIF1A-silenced NP cells, while there was some decrease in BNIP3 levels in hypoxia, there was no corresponding change in the level of LC3-II regardless of the oxemic tension (). HIF1A silencing did not affect the levels of SQSTM1 or BNIP3L in both normoxia and hypoxia (). To measure the effect of HIF1A on autophagic flux, we treated HIF1A-silenced cells with bafilomycin A1 under hypoxia. Western blot analysis clearly showed that the extent of accumulation of LC3-II following bafilomycin A1 treatment was unaffected by HIF1A silencing (). In addition, although HIF1A suppression did not change baseline SQSTM1 levels, there was also no further SQSTM1 accumulation following bafilomycin A1 treatment, possibly suggesting SQSTM1's role in HIF1A shuttling in the autophagic pathway ().Citation53,54
Figure 7. Hypoxic induction of autophagy in NP cells is independent of HIF1A activity. (A) YFP expression of NP cells transduced with lentivirus expressing ShCtr or ShHIF1A shows high ∼80–90% transduction efficiency. Scale bar: 100 μm. (B) Western blot analysis of NP cells transduced with ShCtr or ShHIF1A shows that HIF1A silencing does not affect LC3-II levels irrespective of oxemic tension. While BNIP3 levels also increase under hypoxia (HX) and decrease with HIF1A silencing, there is no appreciable change in both SQSTM1 and BNIP3L levels by hypoxia or HIF1A silencing. (C) Densitometric analysis of HIF1A, LC3-II, BNIP3, BNIP3L, and SQSTM1 western blot data shown in (B) confirms that HIF1A silencing has no effect on the level of LC3-II while decreasing the BNIP3 level. (D) Western blot analysis of NP cells transduced with either ShCtr or ShHIF1A, with or without bafilomycin A1 treatment under hypoxia shows that the LC3-II level and its further accumulation following bafilomycin A1 (Baf) treatment is unaltered by HIF1A silencing. (E) Densitometric analysis of western blot experiments (D) confirms a lack of effect of HIF1A silencing on autophagic flux. (F) Schematic diagram describing generation of NP-specific Hif1a conditional knockout mice. (G) Left panels: H&E staining of intervertebral disc from control and knockout mice at E15.5. Scale bar: 50 μm. Middle and right panels: Immunofluorescence staining of LC3 of NP tissue. LC3 staining demonstrates that lack of Hif1a has no effect on overall staining (middle panel) the number and distribution of LC3-positive puncta (arrowhead, right panel) in vivo, confirming the in vitro knockdown data. Scale bar: 20 μm. (H) Quantification of LC3 immunofluorescence staining of E15.5 disc tissue presented as number of puncta per μm3 shows similar number of LC3-positive autophagosomes between control and Hif1a mutant mice. n = for Hif1a mutant group, and n = 2 for control group. All the quantitative data are represented as mean ± SE from at least 3 independent experiments. NS, nonsignificant; *, p < 0.05.
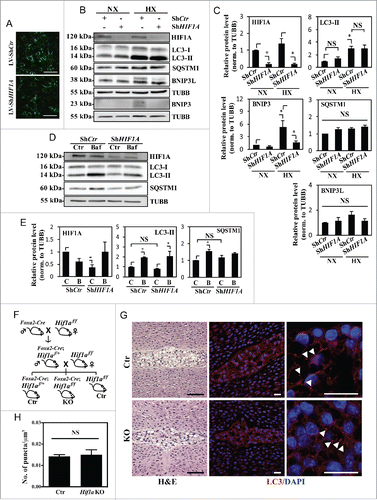
To further validate this finding in vivo, we used NP-specific Hif1a knockout mice generated by crossing Hif1a floxed mice with mice expressing Cre recombinase under control of the notochord specific Foxa2 promoter/enhancer (). The earliest expression of this Foxa2-Cre is detected along the notochord and the forming posterior notochord by E7.5, with full expression established by E9.5.Citation55 Using these conditional nulls and their respective wild-type controls (Hif1af/f), immunofluorescence staining of E15.5 discs for LC3 was carried out to measure the dependency of the autophagic process on HIF1A. We chose E15.5, and not later stages for analysis to exclude any confounding factors that compromise cell viability due to the absence of Hif1a. Based on our previous studies, at E15.5, Hif1 deficiency has minimal effects on NP cell lineage, as well as viability, while at birth these parameters are compromised.Citation14 Importantly, immunofluorescence staining and corresponding quantification showed no difference in the endogenous LC3 levels as well as the number and overall distribution of LC3-positive puncta between control and Hif1a knockout mouse NP (), strongly supporting our in vitro silencing studies.
Acute inhibition of autophagic degradation does not affect metabolism but long-term inhibition compromises the viability of NP cells
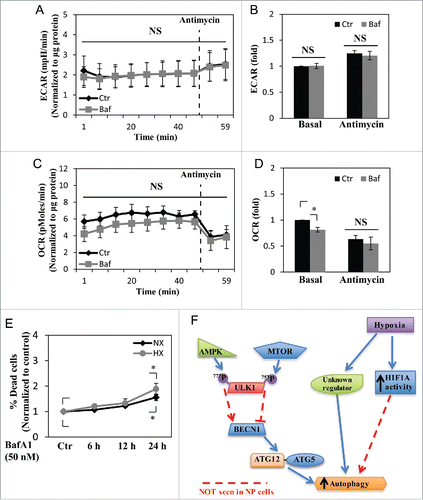
Because autophagy is closely linked to cellular energy status and metabolism, we investigated the metabolic implications of autophagy in NP cells by measuring the extracellular acidification rate (ECAR) and oxygen consumption rate (OCR) using a Seahorse XF Analyzer. By measuring ECAR, the glycolytic rate can be assessed due to production and accumulation of lactic acid. Interestingly, NP cells treated with bafilomycin A1 for 2 to 6 h demonstrated no change in ECAR and only a small decrease in OCR. This indicated that glycolysis and, to a lesser extent, oxygen consumption, in NP cells were not significantly affected by inhibition of autophagic degradation (). In addition, we tested whether long-term treatment with bafilomycin A1 would affect cell viability, as autophagy is crucial for cell survival. NP cells were treated with bafilomycin A1 for varying lengths of time, and the cell viability was measured. Whereas bafilomycin A1 treatment for up to 12 h did not affect cell viability, at 24 h, there was some increase in the percent of dead cells, indicating that autophagic degradation as well as overall lysosomal function/protein turnover was important for NP cell survival ().
Figure 8. NP cell metabolism is unaffected by short-term inhibition of autophagy, but cell viability is reduced by long-term autophagy inhibition. (A and B) Extracellular acidification rate (ECAR) of NP cells treated with bafilomycin A1 (Baf) for 2–6 h under normoxia, measured by Seahorse XF Analyzer, shows no change in the ECAR with bafilomycin A1 treatment. (C and D) Oxygen consumption rate (OCR) of NP cells shows bafilomycin A1 treatment results in a slight reduction only in the basal OCR. (E) Cell viability test using Live/Dead assay demonstrates inhibition of autophagic degradation for 24 h results in decreased cell viability both in normoxia (NX) and hypoxia (HX). (F) Schematic diagram representing a model of noncanonical autophagy regulation in NP cells. Hypoxia induces a form of noncanonical autophagy in NP cells where formation of autophagosomes is affected more so than the autophagic flux. Moreover, autophagy in NP cells is largely independent of the MTOR-ULK1 axis. This noncanonical pathway also does not involve changes in the levels of autophagy-related proteins such as BECN1 and the ATG12–ATG5 complex. Interestingly, while hypoxia increases the activity of HIF1A, a known regulator of autophagy in some cell types, its activity has little or no effect on autophagy in NP cells. NS, nonsignificant.
Discussion
Hypoxia is a known autophagy inducer in various cell types through the activation of the transcription factor HIF1A to promote cell survival under low oxygen stress.Citation20,24,26 NP cells reside in a physiologically avascular niche, and exhibit a natural adaptation to survive under hypoxic conditions; thus, their responses to hypoxia are unique. Our study demonstrates for the first time that NP cells carry out a noncanonical form of autophagy that is hypoxia inducible but HIF1A independent. Surprisingly, in this hypoxia-induced autophagic process, while autophagosome formation is robustly increased, there is a relatively small change in the rate of degradation. Another novel feature of this process is that MTOR signaling and ULK1 play no appreciable role in controlling autophagic flux. Taken together, these results demonstrate the existence of a novel autophagic pathway in NP cells.
Unlike a previous report,Citation56 we noticed that NP cells under hypoxia increase the number of autophagosomes as evidenced by TEM analysis, endogenous LC3 immunofluorescence staining, and accumulation of LC3-II based on western blot. Because acridine orange and LysoTracker Red staining showed increased labeling under hypoxia, we initially speculated that autophagic flux would also be induced. However, cell transduction experiments with a tandem mCherrry-EGFP-LC3B construct and measuring the LC3-II level following bafilomycin A1 treatment revealed that while hypoxia robustly increased the formation of autophagosomes, there was a relatively smaller change in the rate of autophagosome-lysosome fusion. Increased acidic organelles in hypoxia seen by acridine orange and LysoTracker Red staining could therefore be due to the increased number of lysosomes not associated with autophagy. In addition, SQSTM1 levels remained constant in hypoxia, further strengthening the argument that flux itself was not appreciably affected by hypoxia. Since the classic role of autophagy is breaking down organelles and proteins for the purpose of recycling, it is intriguing that the increased rate of autophagosome formation was not matched by an increased rate of degradation. This suggests a possible unconventional role of newly formed autophagosomes, such as those reported by Dupont et al., where LC3-positive autophagosomes are involved in secretion of IL1B rather than protein degradation.Citation57 It is important to note, however, that bafilomycin A1-mediated accumulation of both LC3-II and SQSTM1 indicates NP cells do perform basal canonical autophagy as part of the protein degradation pathway, and only the newly formed autophagosomes under hypoxia may not be involved in degradation. Moreover, western blot analysis showed insensitivity of levels of BECN1 or the ATG12–ATG5 complex to hypoxia. While prolonged starvation has been shown to increase the levels of BECN1 and the ATG12–ATG5 complex,Citation31,58,59 it is not entirely unusual that these proteins maintain their levels during autophagic induction.Citation31,60,61 In NP cells, this is likely due to the fact that baseline levels of the ATG12–ATG5 complex and BECN1 and/or their activity may be sufficient in promoting hypoxic induction of autophagy. An alternative explanation for this observation is that the newly formed autophagosomes in hypoxia may not involve the classical autophagic machinery required for phagophore formation and elongation, thus being noncanonical in nature.
In canonical autophagy, the negative regulator MTOR phosphorylates ULK1 on Ser757 and prevents the interaction between ULK1 and AMPK.Citation48 Various stimuli including nutrient depletion, infection, ROS, and other stresses cause MTOR inhibition resulting in ULK1 phosphorylation by AMPK on Ser317 and Ser777 to induce autophagy.Citation48,51 Because NP cells increased autophagy initiation in hypoxia, we examined if this was through inhibition of MTOR-mediated phosphorylation of ULK1. We observed that when LC3-II levels and autophagosome formation were significantly induced, ULK1 phosphorylation at Ser757 was unaffected. Interestingly, activating phosphorylation of ULK1 by AMPK at Ser777 also did not show any appreciable change under hypoxia at any tested time point, suggesting that the status of ULK1 phosphorylation is not the driver behind induced autophagosome formation under hypoxia. Importantly, these results suggest that NP cells regulate autophagy in an MTOR-independent manner. To further support this argument, we treated NP cells with MTOR inhibitors and assessed the level of autophagy. Failure of rapamycin and Torin1, a highly specific and more effective MTORC1 inhibitor, to increase LC3-II levels irrespective of oxemic tension supported this hypothesis. In contrast to NP cells, chondrocytes responded to both rapamycin and Torin1 treatment to induce autophagic flux, highlighting cell-type specificity of this pathway. These results clearly demonstrate that NP cells perform MTOR-independent, noncanonical autophagy. Previous studies have reported induction of noncanonical autophagy in an MTOR-independent fashion by various stimuli.Citation62-66 Notably, studies by Cheong et al. have also shown that ulk1 and ulk2 double-null MEFs induce autophagy under glucose deprivation conditions through accumulation of ammonia from amino acid catabolism.Citation67 However, to our knowledge, there has been no report documenting basal as well as hypoxia-induced autophagy being regulated independently of the MTOR pathway. It is possible that NP cells may have evolved to utilize a MTOR-ULK-independent autophagic pathway to adapt to their avascular niche conditions.
We also addressed the possibility that elevated oxidative stress may cause induction of autophagy under hypoxia by measuring both the NADP+:NADPH ratio and ATG4 expression levels. The decreased NADP+:NADPH ratio and unaltered ATG4 expression levels clearly showed that under hypoxia NP cells did not experience oxidative stress, thus arguing against the generation of ROS as a cause of autophagy induction.Citation51,52 Previous studies have shown that HIF1A contributes to autophagy regulation in hypoxia.Citation20,24-27,68-70 The BH3 domains of BNIP3 and BNIP3L, known HIF1A targets, disrupt the BCL2-BECN1 complex, releasing more BECN1 to be involved in the autophagic process.Citation24 In NP cells, although the BNIP3 level was increased under hypoxia, the absence of a concomitant increase in p-BECN1 Ser93 indicated a possible lack of correlation with autophagic induction. Likewise, while BNIP3 levels in NP were HIF1 dependent, stable silencing of HIF1A had no effect on hypoxic induction of LC3-II as well as on autophagic flux. These results clearly suggest that in NP cells, HIF1A, through neither the BNIP3-BECN1 axis nor an alternate mechanism, controls autophagy. Importantly, these in vitro results were further supported by analysis of mutant mice with NP-specific Hif1a deletion.Citation14 NP cells in both hif1a mutant and wild-type mice showed similar levels and patterns of LC3 puncta, indicating that autophagy was not controlled by HIF1A. Although NP-specific knockout of Hif1a results in cell death by birth,Citation14 cell lineage and viability of NP cells at E15.5 is not altered, allowing avoidance of confounding variables that affect cell survival in assessment of the autophagic process.Citation14 Taken together, our results clearly support the premise that HIF1A is not involved in autophagy modulation in NP cells.
With such nonclassical regulatory mechanisms, it is not surprising that autophagy in NP cells may have nonconventional functions. Indeed, when autophagic degradation was inhibited, ECAR was not changed suggesting that the rate of glycolysis remained unaffected. This differs from what has been shown in macrophages, in which autophagy inhibition resulted in increased glycolysis and thus increased ECAR.Citation71 It is important to note that macrophages, like NP cells, use glycolysis even under normoxic conditions through maintaining high HIF1A activity.Citation72,73 These results imply that the purpose of basal autophagy in NP cells may have little to do with their metabolic needs. Interestingly, the basal OCR was slightly lower when treated with bafilomycin A1, however, the metabolic implication of this observation is unclear.Citation8 In contrast, autophagy was important for long-term NP cell survival, possibly due to overall inhibition of the protein degradation machinery and accumulation of misfolded proteins resulting in ER stress.Citation74,75
It is important to note that aberrant changes in autophagy are involved in the pathogenesis of many diseases as well as normal aging.Citation76,77 An altered level of autophagy during intervertebral disc degeneration and aging has been reported.Citation37-40,78 Our studies clearly show evidence of MTOR-independent, noncanonical autophagy in NP cells. In addition, hypoxic induction of autophagy is independent of HIF1 as well as increased oxidative stress. It is thus possible that in NP cells autophagy may serve a different purpose in addition to its classical degradative and recycling function. Therefore, further investigations are underway on delineating what physiological roles autophagy plays in NP cells and how it may contribute to intervertebral disc degeneration.
Material and methods
Reagents and plasmids
Lentiviral ShRNA plasmid targeting HIF1A in the FSVsi vector that co-expresses YFP was a gift from Dr. Andree Yeramian, University of Lleida, Spain.Citation79 pBABE-puro mCherry-EGFP-LC3B (22418) developed by Dr. Jayanta Debnath,Citation80 and psPAX2 (12260) and pMD2.G (12259) developed by Dr. Didier Trono were obtained from Addgene.
Cell culture and treatments
Rat and human NP cells were isolated using a method previously reported by Risbud et al.Citation7 Human NP cells were isolated from surgically discarded, magnetic resonance imaging-graded tissue samples. Collection of animal and human tissues for cell isolation was performed as per approved protocols by Jefferson's IACUC and IRB, respectively. After isolation, cells were maintained in Dulbecco's modified Eagle's medium (DMEM; Corning, 10-013-CV) with 10% fetal bovine serum (FBS; Sigma-Aldrich, F6178) supplemented with antibiotics in T25 flasks until confluent (P0), and then either passaged into bigger flasks for expansion (P1) or directly plated into experimental plates. Cells up to P4 were used for all of the experiments. For hypoxic culture, NP cells were maintained in a Hypoxia Work Station (InvivO2 300, Baker Ruskinn, UK) with a mixture of 1% or 5% O2, 5% CO2, and 94% or 90% N2 for 8 to 72 h. In some experiments, cells were pretreated with either Torin1 (200–400 nM; Tocris, 4247) or rapamycin (100–500 nM; EMD Millipore, 553210) 1 h prior to hypoxic culture and were maintained in rapamycin for the duration of the experiments. To inhibit autophagic flux, cells were treated with bafilomycin A1 (50 nM; Tocris, 1334) for the last 2 h of hypoxia treatment. For the experiments with chondrocytes, T/C-28a2 cellsCitation81 were treated with either 500 nM of rapamycin or 400 nM of Torin1 for 6 h.
Generation of mice
Generation and genotyping of Foxa2-Cre;Hif1af/f mutant mice have been previously described.Citation14 Briefly, Foxa2-Cre knock-in male mice were bred with homozygous Hif1a floxed (Hif1af/f) females, in order to obtain Foxa2-Cre positive heterozygous floxed (Foxa2-Cre;Hif1af/+) male mice. These newly generated males were crossed with female mice homozygous for the floxed Hif1a allele to generate Foxa2-Cre;Hif1af/f mutant mice, Foxa2-Cre;Hif1af/+ and Hif1af/f mice were used as controls.
Transmission electron microscopy
Primary rat NP cells were plated in 10-cm plates and was cultured in either normoxia or hypoxia for 24 h. Cells were trypsinized, collected into a pellet, and fixed with buffer containing 2.5% glutaraldehyde, 2.0% paraformaldehyde in 0.1 M sodium cacodylate buffer, pH7.4, overnight at 4°C. After subsequent buffer washes, the samples were post-fixed in 2.0% osmium tetroxide for 1 h at room temperature, and then washed again in buffer followed by dH2O. After dehydration through a graded ethanol series, the cell pellet was infiltrated and embedded in EMbed-812 (Electron Microscopy Sciences, 14900). Thin sections were stained with lead citrate and examined with a JEOL 1010 electron microscope fitted with a Hamamatsu digital camera (C4742-95) and AMT Advantage image capture software.
Acridine orange staining
NP cells were plated in 24-well plates, and cultured under hypoxia or normoxia with or without rapamycin and bafilomycin A1. At the last 30 min before completing 24-h hypoxia treatment, acridine orange (Sigma Aldrich, A9231) was added at 1 μg/mL concentration, and cells were incubated in the dark. After incubation, the media was replaced with phosphate-buffered saline (PBS; Corning, 46-013-CM), and the cell images were taken using a Zeiss Axio Imager.A2 microscope (Carl Zeiss, Germany), or the fluorescence intensity was measured at 488 nm-525 nm (excitation-emission) for DNA bound green signal or at 488nm-650 nm for acidic red signal using an Infinite® M1000 Pro microplate reader (Tecan, Switzerland). Quantification of acridine orange staining was calculated by normalizing fluorescence readings at 650 nm to those at 525 nm.
LysoTracker Red staining
NP cells were plated in Lab-Tek™ II 8-well chamber slides (Nunc, 154534), and cultured under hypoxia or normoxia for 24 h. At the end of the treatment, LysoTracker® Red DND-99 (Thermo Fisher Scientific, L7528) was added at 50 nM concentration, and incubated in the dark for 30 min at 37°C. After incubation, cells were washed with PBS, and fixed with 4% paraformaldehyde (PFA; Sigma-Aldrich, 158127) for 15 min at room temperature in the dark, washed with PBS thoroughly, and mounted with ProLong® Gold Antifade Mountant with DAPI (Thermo Fisher Scientific, P36934) for viewing under the microscope. Images of multiple cells from 3 independent experiments were taken using the Zeiss Axio Imager.A2 microscope. Quantification of red puncta, measured as their area (pixel2/cell) was done using ImageJ software (http://rsb.info.nih.gov/ij/).
Tandem mCherry-EGFP-LC3 immunofluorescence
Phoenix-AMPHO cells (ATCC, CRL-3213) were plated in 10-cm plates (5 × 10⁶ cells/plate) in DMEM with 10% heat-inactivated FBS one d before transfection. Cells were transfected with 20 μg of pBABE-puro-mCherry-EGFP-LC3B (Addgene, 22418). After 16 h, transfection medium was removed and replaced with fresh DMEM with 10% FBS and penicillin-streptomycin (Corning, 30-001-CI). Lentiviral particles were harvested at 48 to 60 h post-transfection. NP cells were plated on glass coverslips in DMEM with 10% heat-inactivated FBS one day before transduction. Cells were transduced with virus medium along with 8 μg/ml polybrene (Sigma Aldrich, H9268). Twenty-four h later, the medium was removed and replaced with 1 g/L glucose DMEM (Gibco, 11885084) with 10% FBS, and the cells were subjected to hypoxia or normoxia for 24 h. After the treatment, cells on the coverslips were fixed with 1% PFA in PBS for 15 min at room temperature in the dark, washed with PBS thoroughly, and mounted with ProLong® Gold Antifade Mountant with DAPI for viewing under the microscope. Images of multiple cells from 3 independent experiments were taken using a Zeiss LSM510 confocal microscope (Carl Zeiss, Germany). Quantification of green-yellow and red-only puncta based on their colocalization was measured as their area (pixel2/cell) using the Colocalization Plugin of ImageJ software (http://rsb.info.nih.gov/ij/).
Immunofluorescence microscopy
Mouse spine tissues were isolated and immediately fixed in 4% PFA in PBS and then embedded in paraffin. Coronal sections of 6- to 8-μm thickness were cut. For localizing LC3, sections were deparaffinized, blocked in 5% normal goat serum (Thermo Fisher Scientific, 10000C) in PBS-T (0.4% Triton X-100 [Sigma Aldrich, T8787] in PBS), and then incubated with anti-LC3 antibody (Novus Biologicals, NB100-2220), in 1% normal goat serum in PBS-T at a dilution of 1:200 at 4°C overnight. Tissue sections were thoroughly washed and incubated with Alexa Fluor®-594 conjugated anti-rabbit secondary antibody (Jackson ImmunoResearch Lab, 711-586-152), at a dilution of 1:800 for 1 h at room temperature in the dark. Then the sections were washed again with PBS-T and mounted with ProLong® Gold Antifade Mountant with DAPI. LC3 puncta in tissue immuno-staining was quantified as number/μm3 with ImageJ software (http://rsb.info.nih.gov/ij/).
For cultured cell immunofluorescence staining, NP cells were plated on glass coverslips. After treatments, cells were fixed and permeabilized with cold methanol at −20°C for 15 min, washed with PBS and then blocked with 5% normal goat serum in PBS with 0.3% Triton X-100 for 1 h at room temperature. Cells on coverslips were then incubated with anti-LC3 antibody (Cell Signaling Technology, 12741) in blocking buffer at a dilution of 1:100 at 4°C overnight, washed with PBS, and then incubated with Alexa Flour-488 Mounted with ProLong® Gold Antifade Mountant with DAPI. All mounted slides were visualized using a Zeiss LSM510 confocal microscope.
Protein extraction and western blotting
Following treatment, cells were immediately placed on ice and washed with ice-cold PBS. All the wash buffers and the final cell lysis/resuspension buffers included 1X cOmplete™ Mini Protease Inhibitor Cocktail (Roche, 11836153001), NaF (5 mM; Sigma Aldrich, 201154) and Na3VO4 (200 μM; Sigma Aldrich, S6508). Total cell proteins were resolved by electrophoresis on 8–12% SDS-polyacrylamide gels and transferred by electroblotting to PVDF membranes (EMD Millipore, IPVH00010). The membranes were blocked with 5% nonfat dry milk in TBST (1% Tween 20 [Bio-Rad, 161–0781] in TBS) and incubated overnight at 4°C in 5% nonfat dry milk in TBST with antibodies against LC3 (1:1000; 12741), BECN1 (1:1000; 3495), SQSTM1/p62 (1:1000; 5114), ATG12 (1:1000; 4180), p-ULK1 Ser757 (1:1000; 14202), ULK1 (1:1000; 8054), phospho-p-RPS6KB/70S6K (1:1000; 9205), p-RPS6KB/70S6K (1:1000; 9202), BNIP3 (1:500; 3769), BNIP3L (1:500; 12396), p-BECN1 Ser93 (1:500; 14717), ATG4A (1:1000; 7613), or ATG4B (1:1000; 13507) all from Cell Signaling Technology. The membrane was also incubated with primary antibodies against, HIF1Α (1:1000; BD Transduction Laboratories™, 610958), p-ULK1 Ser777 (1:500; EMD Millipore, ABC213), or TUBB (1:10,000; Developmental Studies Hybridoma Bank, E7). Immunolabeling was detected using the Amersham™ ECL™ Prime Western Blotting Detection Reagent (Thermo Fisher Scientific, 45-002-401).
Seahorse analysis
NP cells were plated in a Seahorse XF 24 V7 cell culture microplate (Seahorse Bioscience, 100777–004) at a seeding density of 15,000 cells/well in 1 g/L DMEM with 10% FBS the night before the experiment. On the day of the analysis, cells were treated with 50 nM bafilomycin A1 for 2 to 6 h before oxygen consumption rate and extracellular acidification rate were measured in unbuffered medium containing bafilomycin A1 using a Seahorse XF24 Analyzer (Seahorse Bioscience, North Billerica, MA).
Cell viability assay
NP cells were plated in 96-well clear bottom plates at 10,000 cells/well seeding density. Cell were treated with 50 nM bafilomycin A1 for 6–24 h, under either normoxia or hypoxia, and viability was measured using a LIVE/DEAD® Viability/Cytotoxicity Kit (Thermo Fisher Scientific, L3224). Briefly, cells were incubated with LIVE/DEAD working solution containing either or both 1 μM calcein AM and 2 μM EthD-1 for 30 min at 37°C and then fluorescence intensity was measured at either 485 nm-530 nm (excitation-emission) for calcein AM (live) or at 530 nm-645 nm for EthD-1 (dead) using an Infinite→ M1000 Pro microplate reader. The percent dead cells was calculated by dividing the EthD-1 fluorescence reading of the experimental samples by the reading of the dead cell control (cells killed by 15-min incubation with 70% methanol) after background correction.
NADP+:NADPH measurement
NP cells were plated in 96-well clear bottom plates at 10,000 cells/well seeding density. Experimental media was placed in either a regular cell incubator for normoxia, or hypoxia chambers set at different oxygen tensions (5, 1, or 0.1% pO2) overnight for equilibration prior to the experiment. On the experiment day, cells were placed in a hypoxia chamber of different oxygen tensions and the media was replaced with oxygen-equilibrated media for 1 h. Cells were then lysed with 2 mM NaOH with 1% DTAB (Sigma Aldrich, D8638) and lysates were divided into 2 groups, each of which were used to measure NADP+ and NADPH separately using the NADP/NADPH-Glo™ Assay (Promega, G9081).
Lentiviral particle production and viral transduction
HEK 293T cells (ATCC, CRL-3216) were plated in 10-cm plates (5 × 10⁶ cells/plate) in DMEM with 10% heat-inactivated FBS one day before transfection. Cells were transfected with 9 μg of ShCtr or ShHIF1A plasmids along with 6 μg psPAX2 and 3 μg pMD2.G. After 16 h, transfection medium was removed and replaced with DMEM with 10% heat-inactivated FBS and penicillin-streptomycin. Lentiviral medium was harvested at 48 to 60 h post-transfection, mixed with 7% PEG 6000 (Sigma Aldrich, 81253) solution and incubated overnight at 4°C to precipitate virus particles. PEG solution was removed from virus medium before transduction by centrifugation at 1,500 × g for 30 min to pellet virus particles. NP cells were plated in DMEM with 10% heat-inactivated FBS one d before transduction. Cells in 10-cm plates were transduced with 8 mL of fresh DMEM with 10% heat-inactivated FBS containing viral particles along with 8 μg/ml polybrene. Twenty-four h later, the medium was removed and replaced with DMEM with 10% FBS. Cells were harvested for protein extraction 4–5 d after transduction to ensure maximum knockdown efficiency without affecting cell viability. A transduction efficiency of 80–90% was achieved as determined from the number of YFP-positive cells.
Statistical analysis
All measurements were performed in at least triplicate. Data are presented as the mean ± SE. Differences between groups were assessed by Student t test and ANOVA with appropriate post-hoc analysis using SigmaPlot (Systat Software). p < 0.05 was considered statistically significant.
Abbreviations
| ECAR | = | extracellular acidification rate |
| HIF | = | hypoxia inducible factor |
| IVD | = | intervertebral disc |
| NP | = | nucleus pulposus |
| OCR | = | oxygen consumption rate |
| shRNA | = | short-hairpin RNA |
Disclosure of potential conflicts of interest
No potential conflicts of interest were disclosed.
1192753_Supplemental_Material.docx
Download MS Word (2.3 MB)Acknowledgment
We thank Drs. Kathleen Boesze-Battaglia and Dewight Williams, University of Pennsylvania for assistance with TEM analysis.
Funding
This study was supported by NIH grants AR055655 and AR064733. Bioimaging Shared Resource of the Sidney Kimmel Cancer Center (NCI 5 P30 CA-56036), and Dr. Maria Covarrubias.
References
- Johnson ZI, Shapiro IM, Risbud MV. Extracellular osmolarity regulates matrix homeostasis in the intervertebral disc and articular cartilage: Evolving role of TonEBP. Matrix Biol 2014; 40:10-6; PMID:25172826; http://dx.doi.org/10.1016/j.matbio.2014.08.014
- Hassler O. The human intervertebral disc. A micro-angiographical study on its vascular supply at various ages. Acta Orthop Scand 1969; 40:765-72; PMID:5394000; http://dx.doi.org/10.3109/17453676908989540
- Rudert M, Tillmann B. Lymph and blood supply of the human intervertebral disc. Cadaver study of correlations to discitis. Acta Orthop Scand 1993; 64:37-40; PMID:8451943; http://dx.doi.org/10.3109/17453679308994524
- Bartels EM, Fairbank JC, Winlove CP, Urban JP. Oxygen and lactate concentrations measured in vivo in the intervertebral discs of patients with scoliosis and back pain. Spine (Phila Pa 1976) 1998; 23:1-7; discussion 8; PMID:9460145; http://dx.doi.org/10.1097/00007632-199801010-00001
- Gruber HE, Ashraf N, Kilburn J, Williams C, Norton HJ, Gordon BE, Hanley EN. Vertebral endplate architecture and vascularization: application of micro-computerized tomography, a vascular tracer, and immunocytochemistry in analyses of disc degeneration in the aging sand rat. Spine (Phila Pa 1976) 2005; 30:2593-600; PMID:16319744; http://dx.doi.org/10.1097/01.brs.0000187877.30149.83
- Rajpurohit R, Risbud MV, Ducheyne P, Vresilovic EJ, Shapiro IM. Phenotypic characteristics of the nucleus pulposus: expression of hypoxia inducing factor-1, glucose transporter-1 and MMP-2. Cell Tissue Res 2002; 308:401-7; PMID:12107433; http://dx.doi.org/10.1007/s00441-002-0563-6
- Risbud MV, Guttapalli A, Stokes DG, Hawkins D, Danielson KG, Schaer TP, Albert TJ, Shapiro IM. Nucleus pulposus cells express HIF-1 alpha under normoxic culture conditions: a metabolic adaptation to the intervertebral disc microenvironment. J Cell Biochem 2006; 98:152-9; PMID:16408279; http://dx.doi.org/10.1002/jcb.20765
- Agrawal A, Guttapalli A, Narayan S, Albert TJ, Shapiro IM, Risbud MV. Normoxic stabilization of HIF-1α drives glycolytic metabolism and regulates aggrecan gene expression in nucleus pulposus cells of the rat intervertebral disk. Am J Physiol Cell Physiol 2007; 293:C621-31; PMID:17442734; http://dx.doi.org/10.1152/ajpcell.00538.2006
- Agrawal A, Gajghate S, Smith H, Anderson DG, Albert TJ, Shapiro IM, Risbud MV. Cited2 modulates hypoxia-inducible factor-dependent expression of vascular endothelial growth factor in nucleus pulposus cells of the rat intervertebral disc. Arthritis Rheum 2008; 58:3798-808; PMID:19035510; http://dx.doi.org/10.1002/art.24073
- Zeng Y, Danielson KG, Albert TJ, Shapiro IM, Risbud MV. HIF-1 alpha is a regulator of galectin-3 expression in the intervertebral disc. J Bone Miner Res 2007; 22:1851-61; PMID:17592963; http://dx.doi.org/10.1359/jbmr.070620
- Tran CM, Fujita N, Huang B-L, Ong JR, Lyons KM, Shapiro IM, Risbud MV. Hypoxia-inducible factor (HIF)-1α and CCN2 form a regulatory circuit in hypoxic nucleus pulposus cells: CCN2 suppresses HIF-1α level and transcriptional activity. J Biol Chem 2013; 288:12654-66; PMID:23530034; http://dx.doi.org/10.1074/jbc.M112.448860
- Choi H, Johnson ZI, Risbud MV. Understanding nucleus pulposus cell phenotype: a prerequisite for stem cell based therapies to treat intervertebral disc degeneration. Curr Stem Cell Res Ther 2015; 10:307-16; PMID:25584906; http://dx.doi.org/10.2174/1574888X10666150113112149
- Risbud MV, Schoepflin ZR, Mwale F, Kandel RA, Grad S, Iatridis JC, Sakai D, Hoyland JA. Defining the phenotype of young healthy nucleus pulposus cells: Recommendations of the Spine Research Interest Group at the 2014 annual ORS meeting. J Orthop Res 2015; 33:283-93; PMID:25411088; http://dx.doi.org/10.1002/jor.22789
- Merceron C, Mangiavini L, Robling A, Wilson TL, Giaccia AJ, Shapiro IM, Schipani E, Risbud MV. Loss of HIF-1α in the Notochord Results in Cell Death and Complete Disappearance of the Nucleus Pulposus. PLoS One 2014; 9:e110768; PMID:25338007; http://dx.doi.org/10.1371/journal.pone.0110768
- Yang Z, Klionsky DJ. Eaten alive: a history of macroautophagy. Nat Publ Gr 2010; 12:814-22.
- Codogno P, Mehrpour M, Proikas-Cezanne T. Canonical and non-canonical autophagy: variations on a common theme of self-eating? Nat Rev Mol Cell Biol 2011; 13:7-12; PMID:22166994; http://dx.doi.org/10.1038/nrn3125
- Pampliega O, Orhon I, Patel B, Sridhar S, Díaz-Carretero A, Beau I, Codogno P, Satir BH, Satir P, Cuervo AM. Functional interaction between autophagy and ciliogenesis. Nature 2013; 502:194-200; PMID:24089209; http://dx.doi.org/10.1038/nature12639
- Settembre C, Di Malta C, Polito VA, Garcia Arencibia M, Vetrini F, Erdin S, Erdin SU, Huynh T, Medina D, Colella P, et al. TFEB links autophagy to lysosomal biogenesis. Science 2011; 332:1429-33; PMID:21617040; http://dx.doi.org/10.1126/science.1204592
- Wang S, Livingston MJ, Su Y, Dong Z. Reciprocal regulation of cilia and autophagy via the MTOR and proteasome pathways. Autophagy 2015; 11:607-16; PMID:25906314; http://dx.doi.org/10.1080/15548627.2015.1023983
- Mazure NM, Pouysségur J. Hypoxia-induced autophagy: cell death or cell survival? Curr Opin Cell Biol 2010; 22:177-80; PMID:20022734; http://dx.doi.org/10.1016/j.ceb.2009.11.015
- Russell RC, Yuan H-X, Guan K-L. Autophagy regulation by nutrient signaling. Cell Res 2014; 24:42-57; PMID:24343578; http://dx.doi.org/10.1038/cr.2013.166
- Galluzzi L, Pietrocola F, Levine B, Kroemer G. Metabolic control of autophagy. Cell 2014; 159:1263-76; PMID:25480292; http://dx.doi.org/10.1016/j.cell.2014.11.006
- Levine B, Deretic V. Unveiling the roles of autophagy in innate and adaptive immunity. Nat Rev Immunol 2007; 7:767-77; PMID:17767194; http://dx.doi.org/10.1038/nri2161
- Bellot G, Garcia-Medina R, Gounon P, Chiche J, Roux D, Pouysségur J, Mazure NM. Hypoxia-induced autophagy is mediated through hypoxia-inducible factor induction of BNIP3 and BNIP3L via their BH3 domains. Mol Cell Biol 2009; 29:2570-81; PMID:19273585; http://dx.doi.org/10.1128/MCB.00166-09
- Hu Y-L, DeLay M, Jahangiri A, Molinaro AM, Rose SD, Carbonell WS, Aghi MK. Hypoxia-Induced Autophagy Promotes Tumor Cell Survival and Adaptation to Antiangiogenic Treatment in Glioblastoma. Cancer Res 2012; 72:1773-83; PMID:22447568; http://dx.doi.org/10.1158/0008-5472.CAN-11-3831
- Wu H-M, Jiang Z-F, Ding P-S, Shao L-J, Liu R-Y. Hypoxia-induced autophagy mediates cisplatin resistance in lung cancer cells. Sci Rep 2015; 5:12291; PMID:26201611; http://dx.doi.org/10.1038/srep12291
- Zhang H, Bosch-Marce M, Shimoda LA, Tan YS, Baek JH, Wesley JB, Gonzalez FJ, Semenza GL. Mitochondrial Autophagy Is an HIF-1-dependent Adaptive Metabolic Response to Hypoxia. J Biol Chem 2008; 283:10892-903; PMID:18281291; http://dx.doi.org/10.1074/jbc.M800102200
- Kim J, Kim YC, Fang C, Russell RC, Kim JH, Fan W, Liu R, Zhong Q, Guan K-L. Differential regulation of distinct Vps34 complexes by AMPK in nutrient stress and autophagy. Cell 2013; 152:290-303; PMID:23332761; http://dx.doi.org/10.1016/j.cell.2012.12.016
- Mizushima N, Yoshimori T, Ohsumi Y. The role of Atg proteins in autophagosome formation. Annu Rev Cell Dev Biol 2011; 27:107-32; PMID:21801009; http://dx.doi.org/10.1146/annurev-cellbio-092910-154005
- He C, Klionsky DJ. Regulation mechanisms and signaling pathways of autophagy. Annu Rev Genet 2009; 43:67-93; PMID:19653858; http://dx.doi.org/10.1146/annurev-genet-102808-114910
- Klionsky DJ, Abdelmohsen K, Abe A, Abedin MJ, Abeliovich H, Acevedo Arozena A, Adachi H, Adams CM, Adams PD, Adeli K, et al. Guidelines for the use and interpretation of assays for monitoring autophagy (3rd edition). Autophagy 2016; 12:1-222; PMID:26799652; http://dx.doi.org/10.1080/15548627.2015.1100356
- Lippai M, Lőw P. The role of the selective adaptor p62 and ubiquitin-like proteins in autophagy. Biomed Res Int 2014; 2014:832704; PMID:25013806; http://dx.doi.org/10.1155/2014/832704
- Risbud MV, Shapiro IM. Notochordal cells in the adult intervertebral disc: new perspective on an old question. Crit Rev Eukaryot Gene Expr 2011; 21:29-41; PMID:21967331; http://dx.doi.org/10.1615/CritRevEukarGeneExpr.v21.i1.30
- Tian Y, Yuan W, Fujita N, Wang J, Wang H, Shapiro IM, Risbud MV. Inflammatory cytokines associated with degenerative disc disease control aggrecanase-1 (ADAMTS-4) expression in nucleus pulposus cells through MAPK and NF-κB. Am J Pathol 2013; 182:2310-21; PMID:23602832; http://dx.doi.org/10.1016/j.ajpath.2013.02.037
- Sakai D, Nakamura Y, Nakai T, Mishima T, Kato S, Grad S, Alini M, Risbud MV, Chan D, Cheah KSE, et al. Exhaustion of nucleus pulposus progenitor cells with ageing and degeneration of the intervertebral disc. Nat Commun 2012; 3:1264; PMID:23232394; http://dx.doi.org/10.1038/ncomms2226
- Risbud MV, Schipani E, Shapiro IM. Hypoxic regulation of nucleus pulposus cell survival: from niche to notch. Am J Pathol 2010; 176:1577-83; PMID:20133815; http://dx.doi.org/10.2353/ajpath.2010.090734
- Ye W, Xu K, Huang D, Liang A, Peng Y, Zhu W, Li C. Age-Related Increases of Macroautophagy and Chaperone-Mediated Autophagy in Rat Nucleus Pulposus. Connect Tissue Res 2011; 52:472-8; PMID:21591930; http://dx.doi.org/10.3109/03008207.2011.564336
- Ye W, Zhu W, Xu K, Liang A, Peng Y, Huang D, Li C. Increased macroautophagy in the pathological process of intervertebral disc degeneration in rats. Connect Tissue Res 2013; 54:22-8; PMID:22835012; http://dx.doi.org/10.3109/03008207.2012.715702
- Jiang L, Zhang X, Zheng X, Ru A, Ni X, Wu Y, Tian N, Huang Y, Xue E, Wang X, et al. Apoptosis, senescence, and autophagy in rat nucleus pulposus cells: Implications for diabetic intervertebral disc degeneration. J Orthop Res 2013; 31:692-702; PMID:23238821; http://dx.doi.org/10.1002/jor.22289
- Jiang W, Zhang X, Hao J, Shen J, Fang J, Dong W, Wang D, Zhang X, Shui W, Luo Y, et al. SIRT1 protects against apoptosis by promoting autophagy in degenerative human disc nucleus pulposus cells. Sci Rep 2014; 4:7456; PMID:25503852; http://dx.doi.org/10.1038/srep07456
- Park E-Y, Park J-B. High glucose-induced oxidative stress promotes autophagy through mitochondrial damage in rat notochordal cells. Int Orthop 2013; 37:2507-14; PMID:23907350; http://dx.doi.org/10.1007/s00264-013-2037-8
- Kong C-G, Park J-B, Kim MS, Park E-Y. High glucose accelerates autophagy in adult rat intervertebral disc cells. Asian Spine J 2014; 8:543-8; PMID:25346805; http://dx.doi.org/10.4184/asj.2014.8.5.543
- Ma K-G, Shao Z-W, Yang S-H, Wang J, Wang B-C, Xiong L-M, Wu Q, Chen S-F. Autophagy is activated in compression-induced cell degeneration and is mediated by reactive oxygen species in nucleus pulposus cells exposed to compression. Osteoarthritis Cartilage 2013; 21:2030-8; PMID:24120490; http://dx.doi.org/10.1016/j.joca.2013.10.002
- Wu W, Zhang X, Hu X, Wang X, Sun L, Zheng X, Jiang L, Ni X, Xu C, Tian N, et al. Lactate down-regulates matrix systhesis and promotes apoptosis and autophagy in rat nucleus pulposus cells. J Orthop Res 2014; 32:253-61; PMID:24307209; http://dx.doi.org/10.1002/jor.22503
- Jiang L, Jin Y, Wang H, Jiang Y, Dong J. Glucosamine protects nucleus pulposus cells and induces autophagy via the mTOR-dependent pathway. J Orthop Res 2014; 32:1532-42; PMID:25087910; http://dx.doi.org/10.1002/jor.22699
- Lajoie P, Guay G, Dennis JW, Nabi IR. The lipid composition of autophagic vacuoles regulates expression of multilamellar bodies. J Cell Sci 2005; 118:1991-2003; PMID:15840653; http://dx.doi.org/10.1242/jcs.02324
- Gao W, Kang JH, Liao Y, Ding W-X, Gambotto AA, Watkins SC, Liu Y-J, Stolz DB, Yin X-M. Biochemical isolation and characterization of the tubulovesicular LC3-positive autophagosomal compartment. J Biol Chem 2010; 285:1371-83; PMID:19910472; http://dx.doi.org/10.1074/jbc.M109.054197
- Kim J, Kundu M, Viollet B, Guan K-L. AMPK and mTOR regulate autophagy through direct phosphorylation of Ulk1. Nat Cell Biol 2011; 13:132-41; PMID:21258367; http://dx.doi.org/10.1038/ncb2152
- Nyfeler B, Bergman P, Triantafellow E, Wilson CJ, Zhu Y, Radetich B, Finan PM, Klionsky DJ, Murphy LO. Relieving autophagy and 4EBP1 from rapamycin resistance. Mol Cell Biol 2011; 31:2867-76; PMID:21576371; http://dx.doi.org/10.1128/MCB.05430-11
- Thoreen CC, Kang SA., Chang JW, Liu Q, Zhang J, Gao Y, Reichling LJ, Sim T, Sabatini DM, Gray NS. An ATP-competitive mammalian target of rapamycin inhibitor reveals rapamycin-resistant functions of mTORC1. J Biol Chem 2009; 284:8023-32; PMID:19150980; http://dx.doi.org/10.1074/jbc.M900301200
- Alexander A, Cai S-L, Kim J, Nanez A, Sahin M, MacLean KH, Inoki K, Guan K-L, Shen J, Person MD, et al. ATM signals to TSC2 in the cytoplasm to regulate mTORC1 in response to ROS. Proc Natl Acad Sci U S A 2010; 107:4153-8; PMID:20160076; http://dx.doi.org/10.1073/pnas.0913860107
- Scherz-Shouval R, Shvets E, Fass E, Shorer H, Gil L, Elazar Z. Reactive oxygen species are essential for autophagy and specifically regulate the activity of Atg4. EMBO J 2007; 26:1749-60; PMID:17347651; http://dx.doi.org/10.1038/sj.emboj.7601623
- Fujita N, Chiba K, Shapiro IM, Risbud MV. HIF-1α and HIF-2α degradation is differentially regulated in nucleus pulposus cells of the intervertebral disc. J Bone Miner Res 2012; 27:401-12; PMID:21987385; http://dx.doi.org/10.1002/jbmr.538
- Hubbi ME, Hu H, Ahmed I, Levchenko A, Semenza GL. Chaperone-mediated Autophagy Targets Hypoxia-inducible Factor-1 (HIF-1 ) for Lysosomal Degradation. J Biol Chem 2013; 288:10703-14; PMID:23457305; http://dx.doi.org/10.1074/jbc.M112.414771
- Kumar A, Yamaguchi T, Sharma P, Kuehn MR. Transgenic mouse lines expressing Cre recombinase specifically in posterior notochord and notochord. Genesis 2007; 45:729-36; PMID:18064671; http://dx.doi.org/10.1002/dvg.20346
- Chen J-W, Ni B-B, Zheng X-F, Li B, Jiang S-D, Jiang L-S. Hypoxia facilitates the survival of nucleus pulposus cells in serum deprivation by down-regulating excessive autophagy through restricting ROS generation. Int J Biochem Cell Biol 2015; 59:1-10; PMID:25456445; http://dx.doi.org/10.1016/j.biocel.2014.11.009
- Dupont N, Jiang S, Pilli M, Ornatowski W, Bhattacharya D, Deretic V. Autophagy-based unconventional secretory pathway for extracellular delivery of IL-1β. EMBO J 2011; 30:4701-11; PMID:22068051; http://dx.doi.org/10.1038/emboj.2011.398
- Russo R, Berliocchi L, Adornetto A, Varano GP, Cavaliere F, Nucci C, Rotiroti D, Morrone LA, Bagetta G, Corasaniti MT. Calpain-mediated cleavage of Beclin-1 and autophagy deregulation following retinal ischemic injury in vivo. Cell Death Dis 2011; 2:e144; PMID:21490676; http://dx.doi.org/10.1038/cddis.2011.29
- Grumati P, Coletto L, Sabatelli P, Cescon M, Angelin A, Bertaggia E, Blaauw B, Urciuolo A, Tiepolo T, Merlini L, et al. Autophagy is defective in collagen VI muscular dystrophies, and its reactivation rescues myofiber degeneration. Nat Med 2010; 16:1313-20; PMID:21037586; http://dx.doi.org/10.1038/nm.2247
- Zhu H, Wu H, Liu X, Li B, Chen Y, Ren X, Liu C-G, Yang J-M. Regulation of autophagy by a beclin 1-targeted microRNA, miR-30a, in cancer cells. Autophagy 2009; 5:816-23; PMID:19535919; http://dx.doi.org/10.4161/auto.9064
- Mizushima N, Yamamoto A, Hatano M, Kobayashi Y, Kabeya Y, Suzuki K, Tokuhisa T, Ohsumi Y, Yoshimori T. Dissection of autophagosome formation using Apg5-deficient mouse embryonic stem cells. J Cell Biol 2001; 152:657-68; PMID:11266458; http://dx.doi.org/10.1083/jcb.152.4.657
- Sarkar S, Davies JE, Huang Z, Tunnacliffe A, Rubinsztein DC. Trehalose, a novel mTOR-independent autophagy enhancer, accelerates the clearance of mutant huntingtin and alpha-synuclein. J Biol Chem 2007; 282:5641-52; PMID:17182613; http://dx.doi.org/10.1074/jbc.M609532200
- Sarkar S, Floto RA, Berger Z, Imarisio S, Cordenier A, Pasco M, Cook LJ, Rubinsztein DC. Lithium induces autophagy by inhibiting inositol monophosphatase. J Cell Biol 2005; 170:1101-11; PMID:16186256; http://dx.doi.org/10.1083/jcb.200504035
- Wei P-F, Jin P-P, Barui AK, Hu Y, Zhang L, Zhang J-Q, Shi S-S, Zhang H-R, Lin J, Zhou W, et al. Differential ERK activation during autophagy induced by europium hydroxide nanorods and trehalose: Maximum clearance of huntingtin aggregates through combined treatment. Biomaterials 2015; 73:160-74; PMID:26409001; http://dx.doi.org/10.1016/j.biomaterials.2015.09.006
- Tovilovic G, Ristic B, Siljic M, Nikolic V, Kravic-Stevovic T, Dulovic M, Milenkovic M, Knezevic A, Bosnjak M, Bumbasirevic V, et al. mTOR-independent autophagy counteracts apoptosis in herpes simplex virus type 1-infected U251 glioma cells. Microbes Infect 15:615-24; PMID:23669212; http://dx.doi.org/10.1016/j.micinf.2013.04.012
- Grotemeier A, Alers S, Pfisterer SG, Paasch F, Daubrawa M, Dieterle A, Viollet B, Wesselborg S, Proikas-Cezanne T, Stork B. AMPK-independent induction of autophagy by cytosolic Ca2+ increase. Cell Signal 2010; 22:914-25; PMID:20114074; http://dx.doi.org/10.1016/j.cellsig.2010.01.015
- Cheong H, Lindsten T, Wu J, Lu C, Thompson CB. Ammonia-induced autophagy is independent of ULK1/ULK2 kinases. Proc Natl Acad Sci U S A 2011; 108:11121-6; PMID:21690395; http://dx.doi.org/10.1073/pnas.1107969108
- Bohensky J, Terkhorn SP, Freeman TA, Adams CS, Garcia JA, Shapiro IM, Srinivas V. Regulation of autophagy in human and murine cartilage: Hypoxia-inducible factor 2 suppresses chondrocyte autophagy. Arthritis Rheum 2009; 60:1406-15; PMID:19404942; http://dx.doi.org/10.1002/art.24444
- Walter KM, Schönenberger MJ, Trötzmüller M, Horn M, Elsässer H-P, Moser AB, Lucas MS, Schwarz T, Gerber PA, Faust PL, et al. Hif-2α Promotes Degradation of Mammalian Peroxisomes by Selective Autophagy. Cell Metab 2014; 20:882-97; PMID:25440060; http://dx.doi.org/10.1016/j.cmet.2014.09.017
- Menrad H, Werno C, Schmid T, Copanaki E, Deller T, Dehne N, Brüne B. Roles of hypoxia-inducible factor-1α (HIF-1α) versus HIF-2α in the survival of hepatocellular tumor spheroids. Hepatology 2010; 51:2183-92; PMID:20513003; http://dx.doi.org/10.1002/hep.23597
- Stranks AJ, Hansen AL, Panse I, Mortensen M, Ferguson DJP, Puleston DJ, Shenderov K, Watson AS, Veldhoen M, Phadwal K, et al. Autophagy Controls Acquisition of Aging Features in Macrophages. J Innate Immun 2015; 7:375-91; PMID:25764971; http://dx.doi.org/10.1159/000370112
- Sakamoto T, Seiki M. Mint3 enhances the activity of hypoxia-inducible factor-1 (HIF-1) in macrophages by suppressing the activity of factor inhibiting HIF-1. J Biol Chem 2009; 284:30350-9; PMID:19726677; http://dx.doi.org/10.1074/jbc.M109.019216
- Sakamoto T, Seiki M. A membrane protease regulates energy production in macrophages by activating hypoxia-inducible factor-1 via a non-proteolytic mechanism. J Biol Chem 2010; 285:29951-64; PMID:20663879; http://dx.doi.org/10.1074/jbc.M110.132704
- Yuan N, Song L, Zhang S, Lin W, Cao Y, Xu F, Fang Y, Wang Z, Zhang H, Li X, et al. Bafilomycin A1 targets both autophagy and apoptosis pathways in pediatric B-cell acute lymphoblastic leukemia. Haematologica 2015; 100:345-56; PMID:25512644; http://dx.doi.org/10.3324/haematol.2014.113324
- Ohta T, Arakawa H, Futagami F, Fushida S, Kitagawa H, Kayahara M, Nagakawa T, Miwa K, Kurashima K, Numata M, et al. Bafilomycin A1 induces apoptosis in the human pancreatic cancer cell line Capan-1. J Pathol 1998; 185:324-30; PMID:9771488; http://dx.doi.org/10.1002/(SICI)1096-9896(199807)185:3%3c324::AID-PATH72%3e3.0.CO;2-9
- Choi AMK, Ryter SW, Levine B. Autophagy in human health and disease. N Engl J Med 2013; 368:651-62; PMID:23406030; http://dx.doi.org/10.1056/NEJMra1205406
- Mehrpour M, Esclatine A, Beau I, Codogno P. Autophagy in health and disease. 1. Regulation and significance of autophagy: an overview. Am J Physiol Cell Physiol 2010; 298:C776-85; PMID:20089931; http://dx.doi.org/10.1152/ajpcell.00507.2009
- Gruber HE, Hoelscher GL, Ingram JA, Bethea S, Hanley EN. Autophagy in the degenerating human intervertebral disc: In vivo molecular and morphological evidence, and induction of autophagy in cultured annulus cells exposed to proinflammatory cytokines-implications for disc degeneration. Spine (Phila Pa 1976) 2015; 40:773-82; PMID:26091153; http://dx.doi.org/10.1097/BRS.0000000000000936
- Yeramian A, Santacana M, Sorolla A, Llobet D, Encinas M, Velasco A, Bahi N, Eritja N, Domingo M, Oliva E, et al. Nuclear factor-κB2/p100 promotes endometrial carcinoma cell survival under hypoxia in a HIF-1α independent manner. Lab Invest 2011; 91:859-71; PMID:21537326; http://dx.doi.org/10.1038/labinvest.2011.58
- N'Diaye E-N, Kajihara KK, Hsieh I, Morisaki H, Debnath J, Brown EJ. PLIC proteins or ubiquilins regulate autophagy-dependent cell survival during nutrient starvation. EMBO Rep 2009; 10:173-9; http://dx.doi.org/10.1038/embor.2008.238
- Finger F, Schörle C, Zien A, Gebhard P, Goldring MB, Aigner T. Molecular phenotyping of human chondrocyte cell lines T/C-28a2, T/C-28a4, and C-28/I2. Arthritis Rheum 2003; 48:3395-403; PMID:14673991; http://dx.doi.org/10.1002/art.11341