
 ?Mathematical formulae have been encoded as MathML and are displayed in this HTML version using MathJax in order to improve their display. Uncheck the box to turn MathJax off. This feature requires Javascript. Click on a formula to zoom.
ABSTRACT
Epigenetic mechanisms, including DNA methylation, mediate the interaction between gene and environment and may play an important role in the obesity epidemic. We assessed the relationship between DNA methylation and obesity in peripheral blood mononuclear cells (PBMCs) at 485,000 CpG sites across the genome in family members (8-90 y of age) using a discovery cohort (192 individuals) and a validation cohort (1,052 individuals) of Northern European ancestry. After Bonferroni-correction (Pα=0.05 = 1.31 × 10⁻⁷) for genome-wide significance, we identified 3 loci, cg18181703 (SOCS3), cg04502490 (ZNF771), and cg02988947 (LIMD2), where methylation status was associated with body mass index percentile (BMI%), a clinical index for obesity in children, adolescents, and adults. These sites were also associated with multiple metabolic syndrome (MetS) traits, including central obesity, fat depots, insulin responsiveness, and plasma lipids. The SOCS3 methylation locus was also associated with the clinical definition of MetS. In the validation cohort, SOCS3 methylation status was found to be inversely associated with BMI% (P = 1.75 × 10⁻⁶), waist to height ratio (P = 4.18 × 10⁻⁷), triglycerides (P = 4.01 × 10⁻⁴), and MetS (P = 4.01 × 10⁻⁷), and positively correlated with HDL-c (P = 4.57 × 10⁻⁸). Functional analysis in a sub cohort (333 individuals) demonstrated SOCS3 methylation and gene expression in PBMCs were inversely correlated (P = 2.93 × 10⁻⁴) and expression of SOCS3 was positively correlated with status of MetS (P = 0.012). We conclude that epigenetic modulation of SOCS3, a gene involved in leptin and insulin signaling, may play an important role in obesity and MetS.
Abbreviations
| BMI | = | Body Mass Index |
| BMI% | = | Body Mass Index percentile |
| dBP | = | Diastolic Blood Pressure |
| EWAS | = | Epigenome-Wide Association Studies |
| FG | = | Fasting Glucose |
| FI | = | Fasting Insulin |
| GWAS | = | Genome-Wide Association Study |
| HC | = | Hip Circumference |
| HDL-c | = | HDL-cholesterol |
| HOMA-IR | = | Homeostatic Model Assessment of Insulin Resistance |
| IGR | = | insulin to glucose ratio |
| LDL-c | = | LDL-cholesterol |
| LIMD2 | = | LIM Domain-Containing Protein 2 |
| NHANES III | = | Third National Health and Nutrition Examination Survey |
| MetS | = | Metabolic Syndrome |
| PBMC | = | Peripheral Blood Mononuclear Cells |
| QN | = | Quantilenormilzation |
| sBP | = | Systolic Blood Pressure |
| SOCS3 | = | Suppressor of Cytokine Signaling 3 |
| SubQF | = | Subcutaneous Fat |
| T2DM | = | Type 2 Diabetes mellitus |
| TC | = | Total Cholesterol |
| TG | = | Triglycerides |
| TOPS | = | Take Off Pounds Sensibly |
| VF | = | Visceral fat |
| WC | = | Waist Circumference |
| WHR | = | Waist to Hip Ratio |
| WHtR | = | Waist to Height Ratio |
| ZNF771 | = | Zinc Finger Protein 771 |
Introduction
The prevalence of obesity has reached epidemic proportions in many countries and continues to increase all over the world.Citation1,2 This increasing obesity is accompanied by an alarming rise in the prevalence of various comorbidities, including metabolic syndrome (MetS) and type 2 diabetes mellitus (T2DM).Citation3 These chronic diseases now constitute a major burden on scarce healthcare resources and may even reverse the gains in longevity that have occurred in all countries in the last century.Citation4 While the global rise in obesity and its comorbidities is driven by environmental factors, genetic and epigenetic factors determine which particular individuals are at highest riskCitation5,6 and estimates of the heritability of obesity and T2DM range from 40 to 80%.Citation7,8 Identification of the genes and epigenetic mechanisms that confer this increased risk can lead to better understanding of physiologic pathways, targeted public health efforts, personalized therapy, novel diagnostic tests, and new drug targets.
Epigenetic mechanisms mediate the interaction between gene and environment, altering gene expression and inducing long-term changes in phenotype and disease susceptibility. DNA methylation is one of the most extensively studied epigenetic mechanisms and plays an important role in the process of development and differentiation.Citation9 There is evidence from both human and animal sources that prenatal and early childhood experiences alter DNA methylation at multiple loci and that these changes are associated with future risk of chronic diseases like obesity, insulin resistance, and diabetes.Citation10 Obesity is also associated with global changes in DNA methylation in peripheral blood mononuclear cells (PBMCs)Citation11 while caloric deprivation can also alter the methylation state of PBMCs.Citation12,13 Methylation of DNA from peripheral blood (and from buccal cellsCitation14) is frequently used as a surrogate for tissue DNA methylation because some patterns of DNA methylation have been shown to be common across multiple tissues.Citation15 In addition, PBMCs may themselves be a target tissue in obesity and MetS because of their role in inflammation (and the role of inflammation in obesity and its comorbidities).Citation16 DNA methylation is also an important biological phenotype in clinical practice because its easy availability means it has the potential to be used for diagnostic and prognostic purposes whereas other target tissues are usually inaccessible in everyday clinical practice.
Several epigenome-wide association studies (EWAS) of DNA methylation in PBMCs in relation to obesity and MetS traits have been conducted in various populations and have revealed links between DNA methylation, obesity, and T2DM. Citation11,17-19 Most of these EWAS consist of unrelated adult cohorts, but the use of family-based cohorts that include children and multiple generations has additional advantages. For example, we can use a statistical model that takes their relatedness into account and family-based cohorts that include large extended families living in the same region diminish the influence of the population structure and of systematic differences in environmental exposures that otherwise arise due to group differences in diet and geographical location.
Body mass index (BMI) is commonly used as the primary measure of adiposity in adult studies because it is an excellent and easily available surrogate for other measures of adioposity.Citation20-23 But because the range of BMI values that is considered normal is different at different ages in childhood, BMI percentile (BMI%) rather than absolute BMI is the appropriate measure for use in children. If we want to use the same measure of fatness in children as well as adults, then it makes sense to use BMI% in adults as well. There are no widely used BMI% calculators for use in adults, but Dr. Steven Halls has produced a calculatorCitation24 that uses the same NHANES III data as was used in the pediatric calculator. This calculation of BMI% in adults captures the same information (degree of fatness) that is captured by the standard Centers for Disease Control and Prevention (CDC) BMI calculator in children and in a mixed population of adults and children; BMI% can then be used to interrogate the entire cohort using a single measure comparable across all age groups.
We have assembled a unique family-based cohort comprising several large extended families of Northern European descent that has been extensively phenotyped for obesity-related traits. To identify genomic regions whose methylation status is associated with obesity and MetS traits, we conducted an EWAS of PBMC DNA methylation with BMI% in 192 of these subjects. After assessing the relevance of the obesity-associated candidate epigenetic sites with MetS traits in the discovery sample, we extended our investigation into an independent sample cohort of 1,052 subjects. We then performed functional analysis of the prioritized epigenetic site for its relevance with local gene expression using a sample of 330 subjects, a subset of the validation cohort.
Results
Discovering genome-wide epigenetic CpG loci for obesity in adults, children, and adolescents
The discovery cohort consists of a total of 192 subjects, who are members of 7 families, with 28% of the subjects being 18 y and younger at ascertainment. The average age of the cohort is 36.2 (±18.8) y and 55% are females.Citation23 As previously described, we implemented a rigorous epigenetic data cleaning procedure, aiming to retain only the informative CpG probes for downstream analyses.Citation25 A total of 381,693 autosomal CpG sites passed our quality control criteria (see Materials and Methods) and were entered into our statistical pipeline for association tests against overall degree of fatness measured by BMI%.
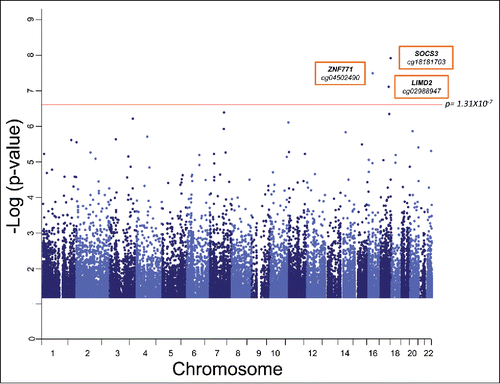
In our genome-wide query, we tested each epigenetic marker for association with BMI% in linear mixed models that included the random effect of kinship using SOLARCitation26 by using methylation status represented by M values (see Materials and Methods). Our models also accounted for the fixed effects of age, sex, age × sex, ageˆ2, ageˆ2 × sex, and blood cell subtype proportions. shows the genome-wide CpG methylation association plot with BMI% in our cohort. We identified 3 loci where methylation status was associated with BMI% with genome-wide significance after correction for multiple testing (Bonferroni Pα=0.05 = 1.31 × 10⁻⁷). These CpG sites are cg18181703, located in body of the suppressor of cytokine signaling 3 (SOCS3) gene (P = 1.02 × 10⁻⁸); cg04502490, located in the 3′ untranslated region of the zinc finger protein 771 (ZNF771) gene (P = 2.70 × 10⁻⁸); and cg02988947, located in the transcription start site of the LIM domain containing 2 (LIMD2) gene (P = 6.43 × 10⁻⁸).
Figure 1. Strength of associations of genome-wide autosomal CpG methylation status with BMI% in our TFSE cohort. Manhattan plot shows the significance level of each CpG locus with BMI-percentile. Each gray dot represents an individual CpG site. The red one depicts the genome-wide significance threshold after Bonferroni correction for multiple testing, Pα=0.05 = 1.31 × 10⁻⁷. Probes with associations of nominal significance (P < 0.05) are shown. Genes and associated CpG sites that exceed the significance threshold are labeled.
Identified obesity-related epigenetic loci are associated with multiple metabolic syndrome traits
We next tested the association of these top 3 loci with phenotypes related to body composition, insulin responsiveness, and plasma lipids. We used the waist to height ratio (WHtR) as a measure of central adiposity because this measure corrects for the wide range of heights seen in our multi-generational cohort. We also assessed the relationship of DNA methylation with subcutaneous fat mass (SubQF), visceral fat mass (VF), and fasting plasma levels of glucose (FG), triglycerides (TG), LDL-cholesterol (LDL-c), and HDL-cholesterol (HDL-c). For the adults we also assessed the relationship to the homeostatic model assessment of insulin resistance (HOMA-IR) as a measure of insulin resistance. As shown in , CpG site cg18181703 at SOCS3 is significantly associated with WHtR (P = 1.50 × 10⁻⁸), SubQF (P = 0.0001), VF (P = 0.001), HOMA-IR (P = 0.002), and TG (P = 0.0004) (significance P = 0.0056 when accounted for multiple phenotype testing). The methylation state at cg18181703 was also nominally associated with FG (P = 0.006) and HDL-c (P = 0.006). We found that ZNF771 CpG site cg04502490 was significantly associated with WHtR (P = 0.001), HOMA-IR (P = 0.0004), and TG (P = 0.003). The methylation state at this site was also nominally associated with SubQF (P = 0.019) and FG (P = 0.016). We found that cg02988947 at LIMD2 was significantly associated with WHtR (P = 1.26 × 10⁻⁶), HOMA-IR (P = 0.0004), and TG (P = 0.002). The methylation state at this site was also nominally associated with SubQF (P = 0.008), VF (P = 0.017), and FG (P = 0.023).
Table 1. TOPS Family Study of Epigenetics (TFSE) Cohort Characteristics.
Table 2. Top BMI% CpGs with other MetS traits and MetS itself.
SOCS3 association with multiple MetS traits was validated in an independent cohort
We then assessed the relationship of the methylation states of these 3 CpG sites with the status of subjects having MetS or not, using the Adult Treatment Panel III (ATPIII) criteria for diagnosis of MetS.Citation27 As shown in , methylation of the ZNF711 or LIMD2 CpG sites is not significantly associated with MetS status in our cohort. However, CpG site cg18181703 in the SOCS3 gene is significantly associated with MetS status (P = 0.012).
We next tested the relationship between methylation at SOCS3 CpG site cg18181703 and obesity and MetS traits in an independent validation cohort consisting of 1,052 individuals from 90 families (). The average age of this cohort is 39 (±19) y with 20% of the subjects being 18 y and younger at ascertainment and 59% of the cohort being females. Overall, the prevalence of BMI% greater than 85th percentile in children and adolescents is 44% and in adults is 35%. In addition, 31.1% of the adult cohort met the ATPIII definition of having MetS.
Using pyrosequencing technology, we were able to replicate the significance of the association of CpG methylation at cg18181703 with BMI% (P = 1.75 × 10⁻⁶) (). It is significantly associated with several other MetS traits including WHtR (P = 4.18 × 10⁻⁷), HDL-c (P = 4.57 × 10⁻⁸), and TG (P = 0.0004). As shown in , except for HDL-c, on average, lower methylation states at cg18181703 were found to be associated with higher measures of MetS traits. We then tested for association between methylation states at cg18181703 and the status of MetS (binary measure of ATPIII definition yes or no). Remarkably, we observed highly significant association between the methylation state at cg18181703 and the MetS status in our large cohort (P = 4.01 × 10⁻⁷) (), suggesting the epigenetic status at this site of gene SOCS3 is strongly inversely associated with the presence of MetS. As shown in , on average, individuals with MetS have significant lower methylation levels at SOCS3 cg18181703 than those without MetS.
Figure 2. Boxplot of methylation β values at cg18181703 (SOCS3, body) against presence or absence of metabolic syndrome. The middle lines show the medians of the data, while the boxes show the 25th to 75th percentiles. The whiskers extend to include 99% of the data while circles represent outliers. The β values at this probe in individuals with and without MetS were significantly different (P = 4.01 × 10⁻⁷) when accounted for age, sex, and interactions of the two.
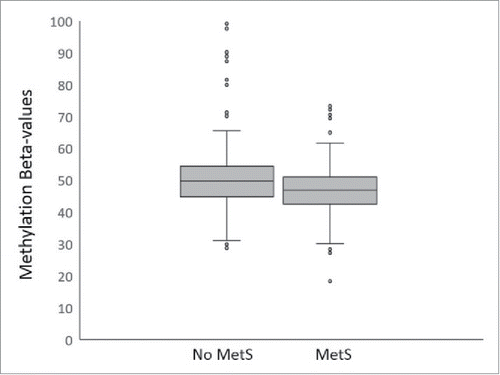
Table 3. Pyrosequencing of SOCS3 CpG site vs. traits.
SOCS3 expression in peripheral blood cells is associated with methylation and MetS states
We hypothesized that the methylation status of SOCS3 CpG site cg18181703 alters the gene expression levels of SOCS3, leading to an effect on obesity and MetS traits. We analyzed the relationship between mRNA levels of SOCS3 and CpG methylation at cg18181703 using the PBMCs of 330 individuals of our family cohort. We found a significant correlation (P = 0.0002933) between these 2, with higher methylation being correlated with lower gene expression. We also tested the effect of SOCS3 expression on MetS status and found they are also significantly positively correlated (P = 0.0117), with higher levels of SOCS3 expression in PBMCs of individuals with MetS.
Materials and methods
Study design, samples and phenotyping
The Take Off Pounds Sensibly (TOPS) Family Study of Epigenetics (TFSE) is an ongoing project that aims to elucidate the role of epigenetic mechanisms in the development of obesity, MetS, and T2DM using related subjects in large extended pedigrees who have been recruited via the membership of the TOPS weight loss club.Citation25 In the current study, we used one cohort (discovery cohort) for a genome-wide search for obesity DNA methylation sites, and a larger independent cohort (validation cohort) for validating the findings. All analyses accounted for the relatedness of family members by conditioning the fixed effects of methylation status on the expected genetic similarity of relatives.Citation26 The discovery cohort consists of a total of 192 subjects, who are members of 7 families, with 28% of the subjects being 18 y and younger at ascertainment. The average age of the cohort is 36.2 (±18.8) y and 55% are females.Citation25 This cohort is a good representation of the current general American population for the prevalence of obesity and MetS traits, with 73% of the adults being overweight or obese (based on BMI), 52% with waist circumference above MetS thresholds (>102 cm in men; >88 cm in women), 31.9% with evidence of insulin resistance [based on the homeostatic model of assessment (HOMA-IR) > 3.5],Citation28,29 20.3% with hypertriglyceridemia (>150 mg/dl), and 65.7% with HDL-c below MetS thresholds (<40 mg/dL in males and <50 mg/dl in females). Overall, 23.7% of the adults of our cohort met the ATPIII definition of having MetS.Citation27
The second cohort for validation consists of 1,052 individuals from 90 families (). Details of their recruitment and phenotyping procedures have been described previously.Citation30 Briefly, each nuclear family was recruited through an obese proband (BMI ≥ 30) who was a member of TOPS Club with the minimal requirement of the availability of 2 obese siblings, a least one, preferably both, of the parents, and one never-obese (BMI ≤ 27) sibling and/or parent. A subsequent extension included the ascertainment of all biologically related members over the age of 18 including aunts, uncles, grandparents, and adult children and their accompanying parent(s). Recently, this cohort was further enhanced by the ascertainment of their children and adolescent descendants (aged 6-18 y) with their accompanying parent(s). Clinical phenotypes for all subjects included weight, height, BMI, waist circumference (WC), hip circumference (HC), WHtR, FG, fasting insulin (FI), insulin to glucose ratio (IGR), HOMA-IR, TG, total cholesterol (TC), LDL-c, HDL-c, systolic and diastolic blood pressure (sBP and dBP), and pulse. Total abdominal fat, VF, and SubQF were measured by computed tomography scans of the fourth lumbar spine in adults,Citation31 and by magnetic resonance imaging at the same level in children and adolescents; circulating levels of adiponectin and leptin were measured by a double antibody equilibrium radioimmunoassay (Millipore Corporation, Billerica, MA); and TNF-α, interleukin-1beta (IL-1β), and interleukin-6 (IL-6) levels, which were measured as previously described.Citation32 ATPIII criteria were used to identify adults with MetS.
Because our cohort includes children from ages 6 to 18 and the normal distribution of BMI values varies by age in children, we used BMI% rather than absolute BMI as the primary measure of body fatness in our cohort. BMI values were converted to BMI% using the CDC's BMI% calculator for childrenCitation33 for subjects 2 through 19 y of age. For adults, we calculated the BMI% using a percentile calculator based on the same NHANES III data.Citation24,34
Informed consent was obtained from all participating subjects in addition to their parents/legal guardians for subjects less than 18 y of age. All study procedures for adults, adolescents, and children were approved by the Institutional Review Boards of the Medical College of Wisconsin (HRRC#325-94 and HRRC#013-00) and Children's Hospital of Wisconsin (CHW 04/87), respectively.
Illumina HumanMethylation450 data production
Genomic DNA was isolated from peripheral blood after an overnight fast on the same day when each subject was assayed for obesity and MetS phenotypes; thus, the CpG methylation states profiled from these samples reflect the epigenetic status associated with that individual's current state of body composition and metabolism. One microgram of human genomic DNA was sodium bisulfite–treated for cytosine (C) to thymine (T) conversion using the EZ DNA Methylation kit (Zymo Research) according to the manufacturer's guidelines. The converted DNA was purified and prepped for analysis on the Illumina HumanMethylation450 microarray following the manufacturer's guidelines. The Illumina HumanMethylation450 microarray measures the methylation levels of more than 485,000 methylation sites. It includes CpG sites surrounding the transcription start sites (−200 bp to −1,500 bp, 5′UTRs, and exon 1) of 99% of RefSeq genes, CpG sites within non-coding RNAs, intergenic regions identified in genome-wide association studies, as well as CpG islands/shores/shelves and open sea of the genome. CpG annotations (chromosomal location, reference gene, etc.) were identified using genome build NCBI36/hg18 using the Illumina manifest 1v2.GenomeStudio software; the Methylation Module (Illumina) was used to generate final reports containing signal intensities and detection P-values excluding X and Y chromosomes. No background subtraction or control normalization was applied with GenomeStudio.
Genomic CpG methylation data QC and processing
For initial quality control preparation of the Infinium HumanMethylation450 data, we used the Lumi:QN + BMIQ pipeline described previously.Citation35 Raw signal intensities and detection P-values of 22 autosomal chromosomes were extracted from GenomeStudio and loaded into Lumi. Next, quality control of the data resulted in removal of CpG sites with detection P-value ≥ 0.01 in more than 5% of the samples (471,473 sites left). All samples had at least 99% CpG sites with detection P-value ≥ 0.01; thus, no samples were removed. Recently, multiple groups have reported that this array contains cross-reacting probes that cannot be distinguished between multiple chromosomal positions and that therefore need to be excluded from downstream analysis.Citation36 Furthermore, studies including ours (Y.Z., unpublished data) have shown that a significant proportion of genomic CpG loci are common polymorphic locations where both C or G or the dinucleotides are changed to a different code, thus abolishing the ability of being methylated in that genome. Considering the inaccuracy these single nucleotide polymorphisms may cause in the quantification of methylation status of these CpG sites, we therefore excluded all known polymorphic CpG sites.
Color-bias adjustment (Col.Adj) and quantilenormilzation (QN) were performed on signal intensities as implemented in Lumi. Briefly, the QN works on total signal intensity, assuming that the distributions of the pooled methylated and unmethylated probes are similar for different samples. Intensities were then used to generate Beta values. Within Lumi, ‘β’ values are defined as follows:
Where IM and IU represent the fluorescence intensity originating from methylated or unmethylated CpG locus, and α is a constant. Beta Mixture Quantile dilation (BMIQ) was then performed on β-values of QNed data to account for probe type bias. After these steps, a total of 381,693 CpG sites for all 192 samples were imported into data analysis. BMIQ'ed β-values were then converted to M values for data analysis. Lumi defines M values as:
All analyses were run using M-values, which are more statistically valid for analysis of differential methylation levels owing to its more homoscedastic nature.Citation37 Further, the quantitative genetic analyses program SOLAR was used to normalize the DNA methylation data at each CpG locus.Citation38 CpG loci were initially normalized by inverse-Gaussian (rank-normal) transformation, and then residualized by the covariates sex, age, ageˆ2, their interactions and cell type composition. These residuals were again normalized by inverse-Gaussian (rank-normal) transformation.
To estimate cell-type proportions we used the R minfi package, and estimate CellCounts function.Citation39,40 This method estimated the proportions of 6 cell types (monocytes, granulocytes, CD8+ T-cells, CD4+ T-cells, NK cells, and B cells) for each individual based on their genome-wide methylation signatures, using an external reference inferred from sample profiles of cell-specific methylation.Citation41 For each regression test, 5 of the 6 proportions were used as covariates.
Validation by pyrosequencing
The candidate DNA methylation regions were validated in a second cohort of 1,052 individuals by bisulfite pyrosequencing. One microgram of human genomic DNA was sodium bisulfite-converted using the EZ DNA Methylation kit (Zymo Research) according to the manufacturer's guidelines. Pyrosequencing was performed using the PyroMark MD system (Qiagen, Valencia, CA) according to the manufacturer's protocol. Briefly, the PCR was performed with 10 µM primers, one of which was biotinylated for later purification by streptavidin sepharose (VWR). The oligonucleotide primers were purchased from IDT, and used for the amplified region of SOCS3: forward primer, TAGTTGGGTGATTTTTTTATAGGAGTT; reverse biotinylated primer, CCCCCAAAAAAACCTATTACATCTACT; and pyrosequencing primer, AGATGTTGAAGAGTGG. Sepharose beads containing the PCR product were washed and purified using 0.2 M NaOH and the Pyrosequencing Vacuum Prep Tool (Qiagen). Five microliters of the PCR products were sequenced and methylation was quantified using the provided software (Qiagen).
Transcriptional profiling
Genome-wide transcriptional profiles of a subset of the cohort were obtained as previously described,Citation42 with modifications. Briefly, 2.5 ml blood was collected from each individual into a PAXgene® Blood RNA Tube (BD, Franklin Lakes, NJ) following an overnight fast. Total RNA was isolated from each tube using the PAXgene Blood RNA Kit (Qiagen) and antisense RNA (aRNA) was synthesized using the MessageAmp II-Biotin aRNA kit (Ambion, Austin, TX). A total of 1.5 μg aRNA was hybridized to Illumina HumanWG-6 version 2 or version 3 chips (Illumina, San Diego, CA) and expression detected on the Illumina® BeadArray™ 500GX Reader. Illumina GenomeStudio software (version 2010.3) was used for preliminary data analysis with standard background normalization.
Statistical analysis
Analysis of epigenome-wide association of BMI%
The quantitative genetic analyses program SOLAR was used to analyze DNA methylation differences associated with BMI% phenotypes in the whole cohort. SOLAR is a software package designed to perform tests of genetic and epigenetic association in family data.Citation38 BMI% and methylation measures were normalized by inverse-Gaussian (rank-normal) transformation. BMI% was residualized by the covariates sex, age, ageˆ2 and their interactions. Analyses were performed for each CpG site separately, where the phenotype was modeled as a linear function of methylation with models that included the random effect of kinship. Bonferroni correction for multiple testing, Pα=0.05 = 1.31 × 10⁻⁷.
After finding the 3 CpG loci that are Bonferroni significant with BMI%, further associations were done on these 3 loci with other MetS phenotypes. These phenotypes include TG, HOMA-IR, WHR, HDL-c, FG, WHtR, LDL-c, SUBQ, VF, and MetS itself.
Gene expression analysis
Microarray data were available in 2 batches, one based on Version 2 arrays (48,701 probes, 307 samples) and the other on Version 3 (48,803 probes, 230 samples). To guard against possible batch effects and probe differences, each batch was analyzed separately: The number of probe transcripts detectable at P≤0.05 by BeadStudio software was counted, a false discovery rate (FDR) was computed across all probes, and transcripts detectable at 5% FDR were retained. Expression levels were log2 transformed and inverse-quartile normalized. Transformed and normalized expression levels for probes that mapped to the 1-LOD QTL regions were tested for association with phenotypes of interest in models that included the random effect of kinship. Gene-centric P-values were calculated by combining independent P-values from the 2 microarray batches and multiple probes using Stouffer's weighted Z-score methodCitation43 implemented in R.
Analysis of expression at SOCS3 transcript with cg18181703
Analyses were performed for methylation of cg18181703 in which the expression of SOCS3 was modeled as a linear function of methylation with models that included the random effect of kinship.
Discussion
The development of obesity and associated diseases such as T2DM and MetS is the result of gene-environment interactions that are partly mediated by epigenetic mechanisms, including DNA methylation. We have conducted a family-based PBMC epigenome-wide association study of body fatness (defined by BMI%) and MetS, using subjects of Northern European ancestry. In this study, we identified 3 loci whose methylation status is significantly associated with obesity in our cohort, i.e., cg18181703, located in the body of SOCS3, cg04502490, located in the 3′UTR of ZNF771, and cg02988947, located in TSS1500 of the LIMD2 gene. All three loci are also associated with other MetS phenotypes, with SOCS3 being associated with WHtR HOMA-IR, FPG, HDL-c, TG, as well as with MetS (as defined by ATPIII criteria).
Of these 3 genes, zinc finger protein 771 (ZNF771) and LIM domain containing 2 (LIMD2) have not been previously identified as obesity- or MetS-related genes. ZNF771 encodes a transcription regulator protein that is highly expressed in adipose tissueCitation44 and very little is known about the function of this gene, but the fact that it is highly expressed in adipocytes makes it a plausible candidate that requires further investigation. LIMD2 is a gene that is expressed in multiple tissues including immune cells, ovaries, liver, and pancreas.Citation45 Little is known about its normal function in human biology, but similar and related proteins play important roles in transducing signals from the cytoskeleton to the genome and in cell motility and cell adhesion.Citation46 LIMD2 itself has been found to be overexpressed in metastatic tumorsCitation48 and may play a role in the spread of tumor cells. While there are no prior reports about a possible role in obesity or MetS, given its expression in multiple immunological cells as well as the liver and pancreas, a role is certainly physiologically plausible.
CpG site cg18181703, located in the body of suppressor of cytokine signaling 3 (SOCS3), was our most significantly associated locus in the discovery cohort and this finding was replicated in our larger validation cohort. While this site was the most statistically significant, 4 other CpG sites in the same CpG island were also nominally significant (data not shown) and consistent with the finding in cg18181703, all 4 sites the methylation status was negatively correlated with obesity. The suppressor of cytokine signaling (SOCS) genes are a family of genes that negatively regulate these cytokine signaling pathways and the SOCS3 gene is the most studied member of this group. It encodes a protein that suppresses cytokine signaling by interacting with protein kinases including janus kinase 2 (JAK2). Citation47,48 Cytokine signaling is critical to multiple important cellular processes, including cellular growth, metabolism and apoptosis; proliferation and complete loss of the SOCS3 gene is embryonically lethal in mice. In the context of obesity and metabolic syndrome, SOCS3 is involved in regulating the activity of multiple important cytokines, including insulin, leptin, growth hormone, IL-6, prolactin, and interferons. Knockdown and knockout experiments indicate that IL-6 and leptin signaling in particular are strongly affected by alterations in SOCS3 activity.Citation49
Leptin signals the status of body fat stores and plays an important role in the regulation of body weight via its actions on central nuclei that control food intake and energy expenditure.Citation50,51 In addition to its crucial role in the central regulation of body weight and adiposity, leptin also plays a role in insulin resistance, β cell function,Citation52 immune responses,Citation53 and pubertal development,Citation54 all of which are important in the development of MetS and T2DM.Citation55,56 Leptin signals via LEPR-B, a cell surface receptor associated with JAK2, which in turn is negatively regulated by SOCS3. Suppression of SOCS3 activity leads to an increase in the efficiency of signaling via the insulin and leptin receptors (increased insulin and leptin sensitivity), making this gene an attractive candidate gene for obesity and insulin resistance related traits.
Evidence that SOCS3 may be involved in the development of obesity and MetS has been seen in several previous studies. For example, it has been reported that changes in the methylation of SOCS3 in the murine brain alter the risk of developing MetS phenotypes in mice that are equally obese but differ in the methylation of this gene.Citation57 Increased methylation leads to decreased gene expression, which increases the response of critical hypothalamic nuclei to the action of leptin and protects these mice against the development of MetS. A previous study also showed that neuron-specific knockout of SOCS3 in the murine brain leads to increased leptin sensitivity and makes these mice resistant to obesity and MetS traits.Citation58 Decreased SOCS3 expression specifically in pro-opiomelanocortin neurons also improves leptin and insulin sensitivity and protects against diet-induced obesity.Citation59 The role of SOCS3 in IL-6 signaling may also be important in the development of MetS traits as IL-6 and other inflammatory cytokines are also known to play an important role in the development of MetS.Citation60,61 SOCS3 has also been found to be associated with lipid levels and insulin resistance in human GWAS and candidate gene studies.Citation62,63 And two recent EWAS, conducted in Indian, Arab, and Caucasian populations, have found that SOCS3 methylation is associated with BMI and T2DM, respectively.Citation64,65
Our study provides strong evidence for a role of SOCS3 in obesity and MetS and suggests a molecular mechanism for its effects. As can be seen in our results, methylation of SOCS3 was inversely correlated with gene expression and with the presence of obesity and several MetS traits. This suggests that decreasing methylation of CpG sites in SOCS3 leads to increased gene expression that suppresses cytokine signaling, inducing insulin and leptin resistance. Further physiologic and mechanistic studies, possibly in cell culture and animal models, should help to elucidate these signaling pathways in greater detail.
While our study examined the DNA methylation levels in PBMCs, there are several studies showing that the levels of DNA methylation in PBMCs tend to be broadly correlated with levels in other target tissues. This may particularly be the case in situations of long-term environmental exposures as well as in the case of global stresses (like the alterations seen in intrauterine growth restriction and long term exposures to unhealthy diets and environmental toxins). Thus, while fine scale alterations in DNA methylation are likely to be very different in different target tissues and to be responsive to short-term alterations in internal physiology and external exposures, the study of DNA methylation in PBMCs cells can still reflect important long-term relationships between DNA methylation and chronic diseases like obesity and MetS.
In summary, our results demonstrate that in a population of Northern European origin, DNA methylation of the SOCS3 gene in PBMCs is significantly associated with obesity and MetS. We also found that, in PBMCs, SOCS3 methylation was associated with decreased gene expression, providing evidence for a plausible mechanism of its role in obesity and MetS. Combined with future mechanistic studies, our findings may lead to innovative ways of early detection and diagnosis of people with risk of developing MetS and may lead to the identification of new molecular targets for reversing this process.
Disclosure of potential conflicts of interest
No potential conflicts of interest were disclosed.
Accession numbers
The NCBI Gene Expression Omnibus accession number for the methylation data generated from the 192 samples reported in this paper is under the Gene Series GSE60132.
Acknowledgments
We acknowledge the contribution of Jacqueline Marks (Medical College of Wisconsin) for her supervision of all biochemical procedures and Ruth Gielow (TOPS Club, Inc.) and her assistants in the recruitment process and finally to all the members of TOPS Club, Inc. and their families who volunteered for this study.
Funding
This work is supported by grants from the NIH (DK071895-03 and DK65598-01) for A.H.K. and in part with federal funds from the Eunice Kennedy Shriver National Institute of Child Health and Human Development, National Institutes of Health, Department of Health and Human Services, under Contract No. HHSN275201100014C (OA and YZ). Quantitative genetic methods development and analysis was supported in part by NIH-National Mental Health Institute grant MH059490 (JB). This work has been also supported by grants by TOPS Club, Inc. to A.H.Kissebah and Y. Zhang. The late Dr. Ahmed H. Kissebah was the principal investigator on the various NIH funded studies that led to the collection of this unique family-based cohort.
References
- Alwan A. Global Status Report on Noncommunicable Diseases 2010. Geneva, Switzerland: World Health Organization; 2011.
- Stevens GA, Singh GM, Lu Y, Danaei G, Lin JK, Finucane MM, Bahalim AN, McIntire RK, Gutierrez HR, Cowan M, et al. The global burden of metabolic risk factors of chronic diseases collaborating group (Body Mass Index), national, regional, and global trends in adult overweight and obesity prevalences. Popul Health Metr 2012 Nov 20; 10(1):22; PMID:23167948; http://dx.doi.org/10.1186/1478-7954-10-22
- Lozano R, Naghavi M, Foreman K, Lim S, Shibuya K, Aboyans V, Abraham J, Adair T, Aggarwal R, Ahn SY, et al. Global and regional mortality from 235 causes of death for 20 age groups in 1990 and 2010: a systematic analysis for the Global Burden of Disease Study 2010. Lancet 2012; 380(9859):2095-128; PMID:23245604; http://dx.doi.org/10.1016/S0140-6736(12)61728-0
- Guariguata L, Whiting DR, Hambleton I, Beagley J, Linnenkamp U, Shaw JE. Global estimates of diabetes prevalence for 2013 and projections for 2035. Diabetes Res Clin Pract 2014; 103(2):137-49; PMID:24630390; http://dx.doi.org/10.1016/j.diabres.2013.11.002
- Stančáková A1, Laakso M. Genetics of metabolic syndrome. Rev Endocr Metab Disord 2014 Dec; 15(4):243-52; http://dx.doi.org/10.1007/s11154-014-9293-9
- Stančáková A, Laakso M. Genetics of Type 2 Diabetes. Endocr Dev 2016; 31:203-20; PMID:26824439; http://dx.doi.org/10.1159/00043941817
- Ali O. Genetics of type 2 diabetes. World J Diabetes 2013 Aug 15; 4(4):114-23; PMID:23961321; http://dx.doi.org/10.4239/wjd.v4.i4.114
- Poulsen P, Kyvik KO, Vaag A, Beck-Nielsen H. Heritability of type II (non-insulin-dependent) diabetes mellitus and abnormal glucose tolerance–a population-based twin study, Diabetologia. 1999 Feb; 42(2):139-45; PMID:10064092; http://dx.doi.org/10.1007/s001250051131
- Smith ZD, Meissner A. DNA methylation: roles in mammalian development. Nat Rev Genet 2013; 14:204-20; PMID:23400093; http://dx.doi.org/10.1038/nrg3354
- Jimenez-Chillaron JC, Ramon-Krauel M, Ribo S, Diaz R. Transgenerational epigenetic inheritance of diabetes risk as a consequence of early nutritional imbalances. Proc Nutr Soc 2016 Feb; 75(1):78-89; PMID:26573376; http://dx.doi.org/10.1017/S0029665115004231
- Wang X, Zhu H, Snieder H, Su S, Munn D, Harshfield G, Maria BL, Dong Y, Treiber F, Gutin B, Shi H. Obesity related methylation changes in DNA of peripheral blood leukocytes. BMC Med 2010; 8:87; PMID:21176133; http://dx.doi.org/10.1186/1741-7015-8-87
- Milagro FI, Campion J, Cordero P, Goyenechea E, Gomez-Uriz AM, Abete I, Zulet MA, Martinez JA. A dual epigenomic approach for the search of obesity biomarkers: DNA methylation in relation to diet-induced weight loss. FASEB J 2011; 25:1378-8; PMID:21209057; http://dx.doi.org/10.1096/fj.10-170365
- Moleres A, Campion J, Milagro FI, Marcos A, Campoy C, Garagorri JM, Gomez-Martinez S, Martinez JA, Azcona-Sanjulian MC, Marti A, Group ES. Differential DNA methylation patterns between high and low responders to a weight loss intervention in overweight or obese adolescents: the EVASYON study. FASEB J 2013; 27:2504-12; PMID:23475851; http://dx.doi.org/10.1096/fj.12-215566
- Lowe R, Gemma C, Beyan H, Hawa MI, Bazeos A, Leslie RD, Montpetit A, Rakyan VK, Ramagopalan SV. Buccals are likely to be a more informative surrogate tissue than blood for epigenome-wide association studies. Epigenetics 2013 Apr; 8(4):445-54; PMID:23538714; http://dx.doi.org/10.4161/epi.24362
- Lokk K, Modhukur V, Rajashekar B, Märtens K, Mägi R, Kolde R, Koltšina M, Nilsson TK, Vilo J, Salumets A, Tõnisson N. DNA methylome profiling of human tissues identifies global and tissue-specific methylation patterns. Genome Biol 2014 Apr 1; 15(4):r54; PMID:24690455; http://dx.doi.org/10.1186/gb-2014-15-4-r54
- Esser N, Legrand-Poels S, Piette J, Scheen AJ, Paquot N. Inflammation as a link between obesity, metabolic syndrome and type 2 diabetes. Diabetes Res Clin Pract 2014 Aug; 105(2):141-50; PMID:24798950; http://dx.doi.org/10.1016/j.diabres.2014.04.006
- Hidalgo B, Irvin MR, Sha J, Zhi D, Aslibekyan S, Absher D, Tiwari HK, Kabagambe EK, Ordovas JM, Arnett DK. Epigenome-wide association study of fasting measures of glucose, insulin, and HOMA-IR in the Genetics of Lipid Lowering Drugs and Diet Network study. Diabetes 2014; 63:801-7; PMID:24170695; http://dx.doi.org/10.2337/db13-1100
- Xu X, Su S, Barnes VA, De Miguel C, Pollock J, Ownby D, Shi H, Zhu H, Snieder H, Wang X. A genome-wide methylation study on obesity: Differential variability and differential methylation. Epigenetics 2013; 8:522-33; PMID:23644594; http://dx.doi.org/10.4161/epi.24506
- Toperoff G, Aran D, Kark JD, Rosenberg M, Dubnikov T, Nissan B, Wainstein J, Friedlander Y, Levy-Lahad E, Glaser B, Hellman A. Genome-wide survey reveals predisposing diabetes type 2-related DNA methylation variations in human peripheral blood. Hum Mol Genet 2012; 21:371-83; PMID:21994764; http://dx.doi.org/10.1093/hmg/ddr472
- Blüher S, Molz E, Wiegand S, Otto KP, Sergeyev E, Tuschy S, L'Allemand-Jander D, Kiess W, Holl RW. Body mass index, waist circumference, and waist-to-height ratio as predictors of cardiometabolic risk in childhood obesity depending on pubertal development. Adiposity Patients Registry Initiative and German Competence Net Obesity. J Clin Endocrinol Metab 2013 Aug; 98(8):3384-93; PMID:23775352; http://dx.doi.org/10.1210/jc.2013-1389
- Falkner B. Cardiometabolic risks related to obesity severity in children and adolescents: a commentary. J Am Soc Hypertens 2016 Mar; 10(3):205-6; PMID:26767415; http://dx.doi.org/10.1016/j.jash.2015.12.009
- Jensen NS, Camargo TF, Bergamaschi DP. Comparison of methods to measure body fat in 7-to-10-year-old children: a systematic review. Public Health 2016 Apr; 133:3-13; PMID:26774698; http://dx.doi.org/10.1016/j.puhe.2015.11.025
- Ali O, Cerjak D, Kent JW Jr, James R, Blangero J, Zhang Y. Obesity, central adiposity and cardiometabolic risk factors in children and adolescents: a family-based study. Pediatr Obes 2014 Jun; 9(3):e58-62; PMID:24677702; http://dx.doi.org/10.1111/j.2047-6310.2014.218.x
- Adult BMI percentile calculator (halls.md v2, accessed May, 2016). http://halls.md/bodymass-index/av.htm
- Ali O, Cerjak D, Kent JW, James R, Blangero J, Carless MA, Zhang Y. An epigenetic map of age-associated autosomal loci in northern European families at high risk for the metabolic syndrome. Clin Epigenet 2015; 7(1):12; PMID:25806089; http://dx.doi.org/10.1186/s13148-015-0048-6
- Almasy L, Blangero J. Multipoint quantitative-trait linkage analysis in general pedigrees. Am J Hum Genet 1998 May; 62(5):1198-211; PMID:9545414; http://dx.doi.org/10.1086/301844
- Grundy SM, Brewer HB Jr, Cleeman JI, Smith SC Jr, Lenfant C, American Heart Association; National Heart, Lung, and Blood Institute. Definition of metabolic syndrome: Report of the National Heart, Lung, and Blood Institute/American Heart Association conference on scientific issues related to definition. Circulation 2004 Jan 27; 109(3):433-8; PMID:14744958; http://dx.doi.org/10.1161/01.CIR.0000111245.75752.C6
- Esteghamati A, Ashraf H, Khalilzadeh O, Zandieh A, Nakhjavani M, Rashidi A, Haghazali M, Asgari F. Optimal cut-off of homeostasis model assessment of insulin resistance (HOMA-IR) for the diagnosis of metabolic syndrome: third national surveillance of risk factors of non-communicable diseases in Iran (SuRFNCD-2007). Nutr Metab 2010; 7:26; PMID:20374655; http://dx.doi.org/10.1186/1743-7075-7-26
- Keskin M, Kurtoglu S, Kendirci M, Atabek ME, Yazici C. Homeostasis model assessment is more reliable than the fasting glucose/insulin ratio and quantitative insulin sensitivity check index for assessing insulin resistance among obese children and adolescents. Pediatrics 2005; 115(4):e500-3; PMID:15741351; http://dx.doi.org/10.1542/peds.2004-1921
- Kissebah AH, Sonnenberg GE, Myklebust J, Goldstein M, Broman K, James RG, Marks JA, Krakower GR, Jacob HJ, Weber J, et al. Quantitative trait loci on chromosomes 3 and 17 influence phenotypes of the metabolic syndrome. Proc Natl Acad Sci U S A 2000; 97:14478-83; PMID:11121050; http://dx.doi.org/10.1073/pnas.97.26.14478
- Peiris AN, Hennes MI, Evans DJ, Wilson CR, Lee MB, Kissebah AH. Relationship of anthropometric measurements of body fat distribution to metabolic profile in premenopausal women. Acta Med Scand Suppl 1988; 723:179-88; PMID:3164966
- Dupont NC, Wang K, Wadhwa PD, Culhane JF, Nelson EL. Validation and comparison of luminex multiplex cytokine analysis kits with ELISA: determinations of a panel of nine cytokines in clinical sample culture supernatants. J Reprod Immunol 2005; 66:175-91; PMID:16029895; http://dx.doi.org/10.1016/j.jri.2005.03.005
- Centers for Disease Control and Prevention. BMI Percentile Calculator for Child and Teen, English Version (accessed May, 2016). https://nccd.cdc.gov/dnpabmi/calculator.aspx
- Centers for Disease Control and Prevention. National Health and Nutrition Examination Survey: NHANES III (1988-1994), (accessed May, 2016). http://www.cdc.gov/nchs/nhanes/nhanes3.htm
- Marabita F, Almgren M, Lindholm ME, Ruhrmann S, Fagerström-Billai F, Jagodic M, Sundberg CJ, Ekström TJ, Teschendorff AE, Tegnér J, et al. An evaluation of analysis pipelines for DNA methylation profiling using the Illumina HumanMethylation450 BeadChip platform. Epigenetics 2013; 8(3):333-46; PMID:23422812; http://dx.doi.org/10.4161/epi.24008
- Chen Y, Lemire M, Choufani S, Butcher DT, Grafodatskaya D, Zanke BW, Gallinger S, Hudson TJ, Weksberg R. Discovery of cross-reactive probes and polymorphic CpGs in the Illumina Infinium HumanMethylation450 microarray. Epigenetics 2013; 8(2):203-9; PMID:23314698; http://dx.doi.org/10.4161/epi.23470
- Zhuang J, Widschwendter M, Teschendorff AE. A comparison of feature selection and classification methods in DNA methylation studies using the Illumina Infinium platform. BMC Bioinformatics 2012; 13:59; PMID:22524302; http://dx.doi.org/10.1186/1471-2105-13-59
- Blangero J, Williams JT, Almasy L. Variance component methods for detecting complex trait loci. Adv Genet 2001; 42:151-81; PMID:11037320; http://dx.doi.org/10.1016/S0065-2660(01)42021-9
- Jaffe AE, Irizarry RA. Accounting for cellular heterogeneity is critical in epigenome-wide association studies. Genome Biol 2014; 15:R31; PMID:24495553; http://dx.doi.org/10.1186/gb-2014-15-2-r31
- Houseman EA, Accomando WP, Koestler DC, Christensen BC, Marsit CJ, Nelson HH, Wiencke JK, Kelsey KT. DNA methylation arrays as surrogate measures of cell mixture distribution. BMC Bioinformatics 2012; 13:86; PMID:22568884; http://dx.doi.org/10.1186/1471-2105-13-86
- Reinius LE, Acevedo N, Joerink M, Pershagen G, Dahlen SE, Greco D, Söderhäll C, Scheynius A, Kere J. Differential DNA methylation in purified human blood cells: implications for cell lineage and studies on disease susceptibility. PLoS One 2012; 7:e41361; PMID:22848472; http://dx.doi.org/10.1371/journal.pone.0041361
- Göring HH, Curran JE, Johnson MP, Dyer TD, Charlesworth J, Cole SA, Jowett JBM, Abraham LJ, Rainwater DL, Comuzzie AG, et al. Discovery of expression QTLs using large-scale transcriptional profiling in human lymphocytes. Nat Genet 2007; 39(10):1208-1216; PMID:17873875; http://dx.doi.org/10.1038/ng2119
- Whitlock MC. Combining probability from independent tests: the weighted Z-method is superior to Fisher's approach. J Evol Biol 2005 Sep; 18(5):1368-73; PMID:16135132; http://dx.doi.org/10.1111/j.1420-9101.2005.00917.x
- Huttlin EL, Ting L, Bruckner RJ, Gebreab F, Gygi MP, Szpyt J, Tam S, Zarraga G, Colby G, Baltier K, et al. The BioPlex network: a systematic exploration of the human interactome. Cell 2015 Jul 16; 162(2):425-40; PMID:26186194; http://dx.doi.org/10.1016/j.cell.2015.06.043
- Peng H, Talebzadeh-Farrooji M, Osborne MJ, Prokop JW, McDonald PC, Karar J, Hou Z, He M, Kebebew E, Orntoft T, et al. LIMD2 is a small LIM-only protein overexpressed in metastatic lesions that regulates cell motility and tumor progression by directly binding to and activating the integrin-linked kinase. Cancer Res 2014 Mar 1; 74(5):1390-403; PMID:24590809; http://dx.doi.org/10.1158/0008-5472.CAN-13-1275
- Wu C. Integrin-linked kinase and PINCH: partners in regulation of cell-extracellular matrix interaction and signal transduction. J Cell Sci 1999 Dec; 112(Pt 24):4485-9; PMID:10574698
- Sasaki A, Yasukawa H, Suzuki A, Kamizono S, Syoda T, Kinjyo I, Sasaki M, Johnston JA, Yoshimura A. Cytokine-inducible SH2 protein-3 (CIS3/SOCS3) inhibits Janus tyrosine kinase by binding through the N-terminal kinase inhibitory region as well as SH2 domain. Genes Cells 1999 Jun; 4(6):339-51; PMID:10421843; http://dx.doi.org/10.1046/j.1365-2443.1999.00263.x
- Babon JJ, Lucet IS, Murphy JM, Nicola NA, Varghese LN. The molecular regulation of Janus kinase (JAK) activation. Biochem J 2014 Aug 15; 462(1):1-13; PMID:25057888; http://dx.doi.org/10.1042/BJ20140712
- Babon JJ, Nicola NA. The biology and mechanism of action of suppressor of cytokine signaling 3. Growth Factors 2012; 30:207-219; PMID:22574771; http://dx.doi.org/10.3109/08977194.2012.687375
- Balthasar N, Coppari R, McMinn J, Liu SM, Lee CE, Tang V, Kenny CD, McGovern RA, Chua SC Jr, Elmquist JK, et al. Leptin receptor signaling in POMC neurons is required for normal body weight homeostasis. Neuron 2004; 42:983-991; PMID:15207242; http://dx.doi.org/10.1016/j.neuron.2004.06.004
- Allison MB, Myers MG Jr. 20 years of leptin: connecting leptin signaling to biological function. J Endocrinol 2014 Oct; 223(1):T25-35; PMID:25232147; http://dx.doi.org/10.1530/JOE-14-0404
- Marroquí L, Gonzalez A, ∇eco P, Caballero-Garrido E, Vieira E, Ripoll C, Nadal A, Quesada I. Role of leptin in the pancreatic β-cell: effects and signaling pathways. J Mol Endocrinol 2012 May 29; 49(1):R9-17; PMID:22448029; http://dx.doi.org/10.1530/JME-12-0025
- Naylor C, Petri WA Jr. Leptin Regulation of Immune Responses. Trends Mol Med 2016 Feb; 22(2):88-98; PMID:26776093; http://dx.doi.org/10.1016/j.molmed.2015.12.001
- Sanchez-Garrido MA, Tena-Sempere M. Metabolic control of puberty: roles of leptin and kisspeptins. Horm Behav 2013 Jul; 64(2):187-94; PMID:23998663; http://dx.doi.org/10.1016/j.yhbeh.2013.01.014
- Freitas Lima LC, Braga VA, do Socorro de França Silva M, Cruz J C, Sousa Santos SH, de Oliveira Monteiro MM, Balarini C M. Adipokines, diabetes and atherosclerosis: an inflammatory association. Front Physiol 2015 Nov 3; 6:304; PMID:26578976; http://dx.doi.org/10.3389/fphys.2015.00304
- Fernández-Formoso G, Pérez-Sieira S, González-Touceda D, Dieguez C, Tovar S. Leptin, 20 years of searching for glucose homeostasis. Life Sci 2015 Nov 1; 140:4-9; PMID:25744051; http://dx.doi.org/10.1016/j.lfs.2015.02.008
- Martínez-Micaelo N, González-Abuín N, Ardévol A, Pinent M, Petretto E, Behmoaras J, Blay M. Leptin signal transduction underlies the differential metabolic response of LEW and WKY rats to cafeteria diet. J Mol Endocrinol 2016 Jan; 56(1):1-10; PMID:26450996; http://dx.doi.org/10.1530/JME-56-A1
- Mori H, Hanada R, Hanada T, Aki D, Mashima R, Nishinakamura H, Torisu T, Chien KR, Yasukawa H, Yoshimura A. Socs3 deficiency in the brain elevates leptin sensitivity and confers resistance to diet-induced obesity. Nature Medicine 2004; 10:739-743; PMID:15208705; http://dx.doi.org/10.1038/nm1071
- Kievit P, Howard JK, Badman MK, Balthasar N, Coppari R, Mori H, Lee CE, Elmquist JK, Yoshimura A, Flier JS. Enhanced leptin sensitivity and improved glucose homeostasis in mice lacking suppressor of cytokine signaling-3 in POMC-expressing cells. Cell Metab 2006; 4:123-132; PMID:16890540; http://dx.doi.org/10.1016/j.cmet.2006.06.010
- Schuett H, Luchtefeld M, Grothusen C, Grote K, Schieffer B. How much is too much? Interleukin-6 and its signalling in atherosclerosis. Thromb Haemost 2009; 102:215-222; PMID:19652871; http://dx.doi.org/10.1160/TH09-05-0297
- Sindhu S, Thomas R, Shihab P, Sriraman D, Behbehani K, Ahmad R. Obesity is a positive modulator of IL-6R and IL-6 expression in the subcutaneous adipose tissue: significance for metabolic inflammation. PLoS One 2015 Jul 22; 10(7):e0133494; PMID:26200663; http://dx.doi.org/10.1371/journal.pone.0133494
- Asselbergs FW, Guo Y, van Iperen EP, Sivapalaratnam S, Tragante V, Lanktree MB, Lange LA, Almoguera B, Appelman YE, Barnard J, et al. Large-scale gene-centric meta-analysis across 32 studies identifies multiple lipid loci. Am J Hum Genet 2012 Nov 2; 91(5):823-38; PMID:23063622; http://dx.doi.org/10.1016/j.ajhg.2012.08.032
- Zheng YY, Wang LF, Fan XH, Wu CH, Huo N, Lu HY, Xu XY, Wei L. Association of suppressor of cytokine signalling 3 polymorphisms with insulin resistance in patients with chronic hepatitis C. J Viral Hepat 2013 Apr; 20(4):273-80; PMID:23490372; http://dx.doi.org/10.1111/j.1365-2893.2012.01644.x
- Chambers JC, Loh M, Lehne B, Drong A, Kriebel J, Motta V, Wahl S, Elliott HR, Rota F, Scott WR, et al. Epigenome-wide association of DNA methylation markers in peripheral blood from Indian Asians and Europeans with incident type 2 diabetes: a nested case-control study. Lancet Diabetes Endocrinol 2015 Jul; 3(7):526-34; PMID:26095709; http://dx.doi.org/10.1016/S2213-8587(15)00127-8
- Al Muftah WA, Al-Shafai M, Zaghlool SB, Visconti A, Tsai PC, Kumar P, Spector T, Bell J, Falchi M, Suhre K. Epigenetic associations of type 2 diabetes and BMI in an Arab population. Clin Epigenetics 2016 Jan 28; 8:13; PMID:26823690; http://dx.doi.org/10.1186/s13148-016-0177-6